Long
Long
 Short
Short
 Long
Long
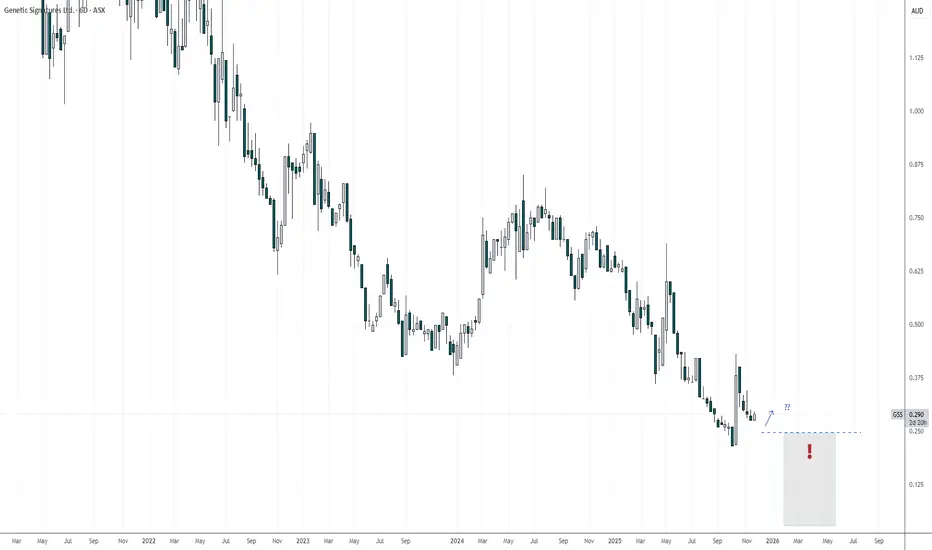
GSS - A Sleeping Genomic Bull?Genetic Signatures Ltd. is a research company engaging in the identification & commercialization of individual genetic signatures purposed for diagnosing infectious diseases.
A more specific focus lately has been on clinical Gastro-intestinal parasite testing kits named 'EasyScreen GI Parasite Kit', which received FDA 510(k) clearance in May/June 2024.
US uptake has been slower than expected, however group revenue figures are showing promising signs with FY25 revenue reaching $15.9m, well beyond FY24 revenue of $9.77m.
The market will be watching closely to see if revenue can continue to scale, and whether meaningful margin can be established, noting FY25 income although up on FY24, is still below FY23's result.
Our Team has identified a point of potential interest & volatility in this code ASX:GSS .
If price can hold above $0.245 ... Significant Bullish potential may be unlocked.
If however price falls below $0.245 ... Significant Bearish risk may come into play.
We're inspired to bring you the latest developments across worldwide markets, helping you look in the right place, at the right time.
Thank you for reading! Stay tuned for further updates, and we look forward to being of service along your trading & investing journey...
Disclaimer: Please note all information contained within this post and all other Bullfinder-official Tradingview content is strictly for informational purposes only and is not intended to be investment advice. Please DYOR & Consult your licensed financial advisors before acting on any information contained within this post, or any other Bullfinder-official TV content.  Long
Long
"FMG" Is Setting Up a Structural Breakout Too Big to IgnoreFMG — Wave 3 Expansion Continues With Macro (5) in Progress
FMG remains in a strong higher-timeframe Wave 3 expansion , with the internal macro structure developing cleanly. Macro Wave (4) has already completed after a controlled corrective phase that held within the 0.236–0.382 retracement zone , reflecting continued institutional accumulation rather than distribution.
Price is now advancing through macro Wave (5) , which itself is unfolding in five micro waves. Micro Waves 1–4 have already formed, with micro Wave 4 completing as a shallow pullback that preserved bullish market structure and respected prior demand.
The current phase represents the early progression of micro Wave 5 inside macro Wave (5) , all within the broader and still-developing Wave 3 . Fibonacci extensions across both macro and micro degrees align toward higher continuation targets, supporting the ongoing structural trend.
As long as the market maintains key structural lows, the directional bias remains firmly upward, with price positioned to complete the remaining segment of this Wave 3 cycle.
⚠️ Disclaimer
This analysis is provided for educational purposes only and does not constitute financial advice. Trading financial markets involves risk, and you are solely responsible for your own investment decisions. Always conduct your own research and use proper risk management.
If you found this analysis valuable, leave a like, drop your thoughts in the comments, and follow for more structured market insights.  Long
Long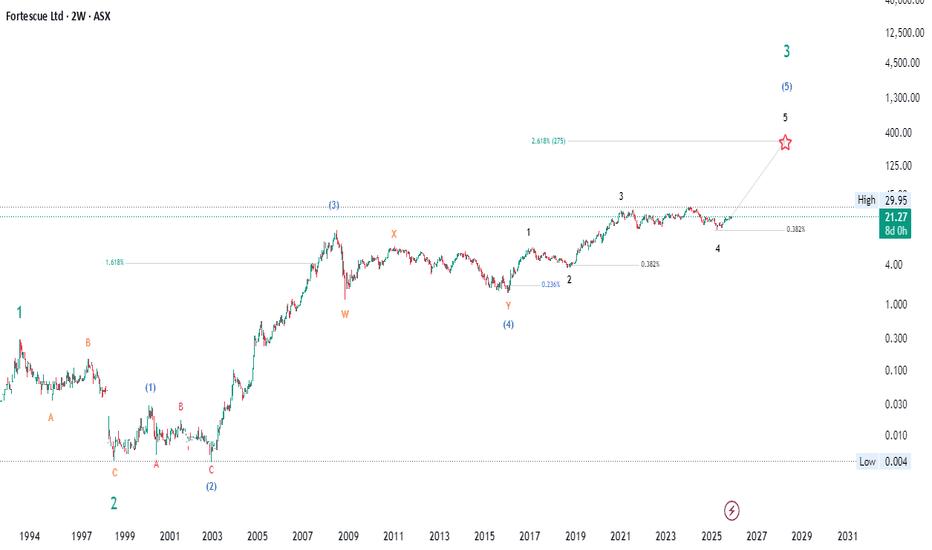
Sideways Risk Until Breakout ClearsHDN is showing some promise here, but the reaction at this level is critical. Price has pulled back to the top of the range and bounced, yet there’s still no clear signal that the pullback has fully run its course. Extra caution is warranted, especially since price dipped below the macro 50% level, a key area that often defines broader trend strength.
Given these conditions, the prudent play is to stay conservative and wait for confirmation. A clean break and close above $1.415, ideally accompanied by rising volume and wider candle spreads, would signal genuine strength. While this approach may mean giving up a portion of the early gains, it ensures you’re buying into momentum rather than risk. Without that confirmation, price could easily slip back into the range and churn sideways for longer.
If the above plays out, TP 1 would be just below the EQ of supply structure and LVN zone as marked. From here, there isn't much resistance until ATH. For SL trail with higher weekly swing lows to capture the move.
BHP Group Strikes Back in the Copper Battle
Ion Jauregui – Analyst at ActivTrades
BHP Group (ASX: BHP), the world’s largest mining producer, has reignited its push to acquire Anglo American (LSE: AAL), just months after the latter agreed to merge with Canadian Teck Resources (TSX: TECKb). The move comes as no surprise: copper has become the “star metal” of the energy transition, and whoever controls future supply will dominate much of the industrial pulse of the next decade. BHP’s interest is clear. If the deal goes through, the company would add approximately 1.9 million tonnes of annual copper production, surpassing the future Anglo-Teck, whose combined potential would be around 1.2 million tonnes. In a market where demand for copper in power grids, electric vehicles, and energy storage is growing at double-digit rates, this difference is strategic: volume is power.
Anglo, meanwhile, is undergoing a comprehensive restructuring, focusing on higher-quality assets and reducing exposure to less profitable segments. The merger with Teck aimed to strengthen its critical minerals portfolio, but renewed pressure from BHP could completely reshape the global mining map. This is not just about size; it is about securing long-life assets in key regions such as Chile and Peru, where major copper mines remain essential for global supply stability.
Strategy, Power, and Influence
At the same time, copper prices remain firm, supported by expectations of a structural deficit starting in 2026 due to the scarcity of new large-scale projects. The industry needs investment, and BHP wants to lead it. The company’s move should be understood in the context of a global electrification push that demands increasing amounts of copper for grids, electric vehicles, and digital infrastructure. As global supply stagnates and new mining projects advance slowly, controlling major assets in Chile and Peru provides an exceptional strategic advantage. BHP is not just buying size; it is buying the future.
The potential transaction also raises geopolitical stakes. Anglo is a historical player in South Africa and the United Kingdom, meaning the deal could face political and regulatory resistance. Nevertheless, BHP believes the synergies and scale outweigh the risks. The Australian miner arrives with a solid financial structure and record copper production, enabling it to pursue such a high-stakes bet.
Fundamental Analysis
In its latest fiscal year, BHP maintained robust margins despite pressure from iron ore prices. Its EBITDA exceeded USD 26 billion, with copper contributing significantly to the results, surpassing 2 million tonnes of production. The company maintains a healthy balance sheet, controlled net debt, and sufficient cash flow to fund both organic growth and strategic acquisitions. The Jansen potash project adds further diversification, though execution risks remain. The main challenges continue to be iron ore volatility and rising costs in some assets. Still, BHP’s exposure to copper positions it well to capitalize on the metal’s secular uptrend.
Technical Analysis
BHP’s chart shows a wide lateral movement since 2022. Last year, it reached a high of 46.19 AUD, but in 2025 it dropped to lows of 31.71 AUD, reflecting sector volatility. More recently, the price has tested the 44.55 AUD area twice, most recently on October 31. The most stable operational range lies between 41.69 AUD and 37.48 AUD, with the current price around 40.60 AUD, positioned near the middle. The point of control (POC)—the area with the highest traded volume—is slightly below, at approximately 38.24 AUD.
Regarding indicators, the price has lost the 50- and 100-day moving averages and is currently supported by the 200-day moving average, a significant long-term support level. The RSI is at 37.7, indicating a high level of oversold conditions, while the MACD remains bearish. If this structure persists, a retest of the POC and a possible correction toward the lower range is plausible. Conversely, if the 200-day support holds, the stock could attempt to retest the key resistance at 44.55 AUD. A solid breakout above this level, supported by strong copper prices, could open the door to a new upward leg. On the downside, losing key supports would increase bearish pressure, especially if iron ore and coal prices continue to weigh on margins.
*******************************************************************************************
The information provided does not constitute investment research. The material has not been prepared in accordance with the legal requirements designed to promote the independence of investment research and such should be considered a marketing communication.
All information has been prepared by ActivTrades ("AT"). The information does not contain a record of AT's prices, or an offer of or solicitation for a transaction in any financial instrument. No representation or warranty is given as to the accuracy or completeness of this information.
Any material provided does not have regard to the specific investment objective and financial situation of any person who may receive it. Past performance and forecasting are not a synonym of a reliable indicator of future performance. AT provides an execution-only service. Consequently, any person acting on the information provided does so at their own risk. Political risk is unpredictable. Central bank actions can vary. Platform tools do not guarantee success.
 Long
Long
 Short
Short
 Long
Long
 Long
Long
 Long
Long
 Long
Long
 Long
Long
Long 
 Short
Short
Long 
 Long
Long
 Short
Short
I