• Products
  • Community
  • Markets
  • Brokers
  • More
Get started
  • Markets
  • /Australia
  • /Stocks
  • /Ideas
Xero Limited is a cloud-based accounting software platform mainl# Xero Limited Ticker: XRO Market: ASX Xero Limited is a cloud-based accounting software platform mainly used by small and medium-sized businesses (SMBs). Where it operates: Australia / NZ (core stronghold) UK (growing) US (big opportunity, still developing) How Xero makes money: - Monthly subscriptions per business - Tiered pricing (basic → premium) - Add-ons (payroll, advanced features) Why investors like it: - Strong moat Once a business is set up → hard to switch Data + workflows deeply embedded - Recurring revenue Subscription model = predictable income - Large market Millions of small businesses globally Risks / challenges: - Competing with Intuit Inc. (QuickBooks) in the US - Growth slowing vs earlier years - Still proving profitability at scale - High valuation (even after recent drop) Negatives (this is where it fails Warren Buffett test) - Valuation still high ~50–65x earnings is far above Buffett comfort zone Buffett typically prefers ~15–25x (rough guide) - Growth slowing, used to be 30–40%, now more like 15–20% - High multiple + slowing growth = risky combo Reasons to invest: - 2026, the entire tech sector has been repriced lower due to AI disruption fears. - potential for 140% upside gain - perhaps wait for price to drop to $60 level before buying
ASX:XRO
by tfcting
REA Group → Network effect monopoly, basically owns online real Moat type: Network effects Why it dominates: realestate.com.au = default platform for all real estate listings More listings → more buyers → more agents → repeat Since Feb 2025 share price has dropped from all time high of $275 due to 1) Earnings miss vs very high expectations REA reported solid growth, but it missed market expectations slightly. That triggered a sharp selloff (one day ~-17% intraday). Profit was also affected by things like higher tax and absence of one-off gains, leading to weaker headline numbers. 2) Slowing listings (this is the BIG one) Residential listings fell ~6% in the latest half. Listings are REA’s core revenue driver. Fewer houses for sale = fewer paid listings = slower revenue growth due to: Higher interest rates Lower transaction volumes Weak housing turnover 3) Valuation compression (multiple shrink) REA was trading at very high multiples (~40–50x earnings range previously). Now: Investors are rotating out of expensive “quality tech-like” names Into cyclicals, resources, or cheaper stocks 4) Macro / housing cycle pressure Recent macro backdrop: Weak consumer & business sentiment High inflation + rates Lower confidence in property transactions REA is indirectly a leveraged bet on property turnover, not just prices. 5) Competition + regulatory risk Ongoing concerns about: Competition (e.g. Domain, new entrants, AI disruption) ACCC scrutiny on pricing power These have been weighing on sentiment even while earnings remain strong. 6) “Great company, bad timing” effect REA is still: Growing revenue Increasing dividends Running buybacks But the stock: Is down ~30–35% over 12 months in some periods Because market expectations reset faster than fundamentals Why invest? Potential for 57% upside gain.
ASX:REA
by tfcting
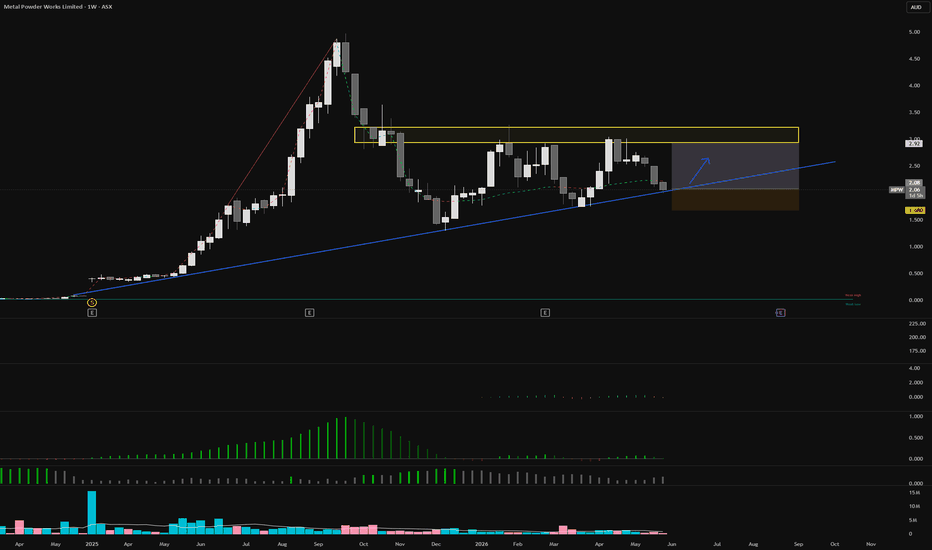
Metal? More into jazz.Bit of a loose play but will see if it hits my target and what it looks like before we get into this short. Its all mostly witchcraft anyways. Not financial advice, not any advice.
ASX:MTMShort
by BringTheFingerBack
Bullish potential detected for BXBEntry conditions: (i) higher share price for ASX:BXB along with swing up of indicators such as DMI/RSI. Depending on risk tolerance, the stop loss for the trade would be: (i) below the recent swing low of $22.66 (7th April), or (ii) below previous potential support on the daily chart at $22.41 (from the open of 18th March).
ASX:BXBLong
by Ivory_Wolf
Updated
The gold rushWith the death cross in and the bullish trend line broken I would expect a push up to the 7.43 area before see the price sink to lower levels, unless they strike a huge nugget of gold in the plutonic mine, which is unlikely since that mine has been gutted long ago. Not financial advise, so its not.
ASX:CYLShort
by BringTheFingerBack
Why Classic Trend-Following is Failing in the Current Market?The attached chart clearly illustrates the hallmark dynamics of 2026, where periods of low volatility are abruptly succeeded by sharp and often deceptive impulses that MNCTNglobal analysis classifies as a deficit of structural trends. In today's market reality, the classical concept of following a long-term directional move has become increasingly unreliable, as phases of sustained growth or decline have shortened significantly and are more frequently interrupted by sudden, deep corrections. A primary driver of this instability is the widening gap between market expectations and reality, where even robust economic reports can trigger sell-offs if they fail to exceed the highly inflated forecasts of analysts. To operate effectively in such conditions, traders are forced to prioritize flexibility over rigid algorithms, as strategies that performed perfectly in stable environments instantly lose their edge when price action enters a phase of turbulence. Adapting to the 2026 market implies a substantial reduction in decision-making cycles and a shift toward lower timeframes, which allows for minimized risk while maintaining the ability to capture short-lived impulsive moves. Special attention in the MNCTNglobal analytics is given to execution quality and platform stability, as during moments of peak load and spread widening, technical reliability becomes a more critical survival factor than the trading strategy itself. The perception of risk has also undergone an evolution, forcing market participants to focus on capital preservation through reduced leverage and the use of wider stop-losses capable of weathering market noise and frequent false breakouts. A modern trader's most valuable asset is information hygiene and the ability to filter out redundant data, focusing exclusively on key liquidity drivers and central bank signals. Ultimately, success in the current landscape is determined not by the ability to predict every turn of the chart, but by the skill to react with discipline to changes, maintaining clarity of thought and relying on a transparent infrastructure that remains stable even during periods of extreme uncertainty.
ASX:EUR
by TricksterTrader
Is a Cuba gold mining op worth a stab? $AAU.ax It is another I like to manually add into and looking for an opportunity to snag some more..... and I see a potential setup. Cuba is a very interesting location. Will be a hot topic now lots of extra tanker traffic is coming into the gulf. Have the feeling it's next on the 'list' if you know what I mean. Not sure if this is bearish or bullish. Gold overall not really super frothy with its seasonality so this could poop its pants. It's a wild world out there now - hard to put a dime of money into these crazy markets.
ASX:AAULong
by Bradledoo
Bullish potential detected for VEAEntry conditions: (i) higher share price for ASX:VEA along with swing up of indicators such as DMI/RSI. Depending on risk tolerance, the stop loss for the trade would be: (i) below the recent swing low of $1.975 (10th March), or (ii) below the rising VWAP on the daily chart (currently $1.945).
ASX:VEALong
by Ivory_Wolf
Updated
Genesis Minerals Weekly outlook (Count 3)Genesis Minerals ASX:GMD Weekly outlook looking for the chart to progress higher in wave (5). i hold a position in this stock, not massive, but nice looking chart. More comments on the chart. A few caveats: 1. Some of the projections i have put forward are based on estimates of uncompleted waves, once i feel i can anchor the next wave i will update the chart and recalculate the levels for the next wave, the chart is an evolving puzzle and there is only so much we can determine based on the information we have. 2. I put more emphasis on price levels as opposed to time, dependent on volatility the waves could play out quickly or prolonged, i do factor in an element of 'the right look' in terms of wave proportionality, but also want the patterns i am projecting to be easily visible on the outlook, so bear that in mind. Note: i create my outlooks with the browser tabs hidden (F11) so if they look squashed, that is why. If you appreciate my analysis then please show your appreciate with a like and follow.
ASX:GMDLong
by TheWaveCave
HOW-TO: Scaling Stage Analysis with SW Stage Analysis ToolkitThe Challenge: The Paradox of Choice In a trending market, there are hundreds of potential setups. The manual process of checking the 30-week WMA, volume trends, and Mansfield Relative Strength (MRS) for every ticker on the ASX or S&P 500 is inefficient. The SW Final Dash is designed to solve this by providing a high-level "Status Map" of your watchlist, allowing you to identify Stage 2 breakouts before they appear on the retail radar. 1. Understanding the Dashboard Status The dashboard condenses complex technical requirements into a visual status. When using the Dash, focus on these three primary data points: Stage Status: The dash identifies if the ticker is currently in Stage 1 (Base), Stage 2 (Advance), Stage 3 (Top), or Stage 4 (Decline). The Trend Pillar: It monitors the slope of the 30-week Weighted Moving Average. A "Green" status across multiple timeframes indicates a high-conviction trend. Relative Strength (MRS) Intensity: Rather than just a line, the dash shows whether the asset is gaining or losing momentum relative to the broader index. 2. How to Use the "Confluence" Filter The most powerful way to use the Dash is to look for Confluence. A "perfect" Weinstein setup appears on the dashboard when: Stage Change: The status flips from Stage 1 to Stage 2. Volume Confirmation: The dash highlights a volume "surge" (relative to the 30-day average). Positive MRS: The Relative Strength component turns green, indicating the stock is leading the market. 3. The Workflow: From Dash to Entry Step 1 (Scan): Open your watchlist and look for "Stage 1" symbols that have a "Improving" Relative Strength status. These are your candidates for a breakout. Step 2 (Alert): Set alerts based on the Dash’s transition logic. You want to be notified the moment a ticker moves into a "Stage 2 Confirmed" status. Step 3 (Verify): Once the Dash flags a ticker, click the symbol to view the price action. Ensure the breakout is "clean" (above clear horizontal resistance) with the Dash showing all green pillars. 4. Managing the "Weight of Evidence" The dashboard isn't just for entries; it’s for defense. If you are holding a Stage 2 position and the Dash begins to show "Stage 3" or "WMA Flattening" warnings, it is an objective signal to tighten your trailing stops or begin scaling out. Best Practices for the Dashboard Watchlist Sizing: The Dash works best with curated watchlists (e.g., Sector ETFs, ASX 200, or specific thematic lists). Timeframe Alignment: Always ensure the Dash is pulling data from the Weekly timeframe for true Stage Analysis, even if you are viewing the daily chart for your entry. The dashboard is a tool to assist in the Weinstein methodology with a few modern upgrades.
ASX:BOQEducation
by StageAnalysisPro
22
Spring + Throw‑Under Setup FormingPEN is starting to shape up as an interesting asymmetric setup. The chart still has work to do, but the upside potential is attractive if the structure completes. Price has potentially printed a throw-under the wedge support and printed what looks like a deep, high‑volume Spring on the horizontal range. Under Wyckoff logic, when the Spring shows higher volume than the Selling Climax, we typically expect a Test to confirm demand before any meaningful markup. If PEN can deliver a clean Test and then break above the swing high at $1.075, that would confirm the Spring and shift control back to buyers. From there, the logical upside targets sit at the range highs around ~$2.90, with scope for continuation if momentum builds. This is one to keep on the radar — the structure is early, but the reward‑to‑risk could become compelling if the Test plays out.
ASX:PEN
by AlvinDeo96
AQZ@AQZ It is punished by the market due to short-term debt for new aircraft, but its assets (the aircraft) are worth more than the company itself on the stock exchange. The chairman's insider purchases are a "golden" signal of a bottom.
ASX:AQZLong
by SimeonNikolaev-invest
WTC: Cheap Stock with Strong FinancialThe company, best known for its CargoWise logistics SaaS platform, continues to demonstrate strong fundamentals. Revenue growth remains resilient, supported by global expansion and high customer retention rates. Despite recent earnings pressure, WiseTech maintains healthy cash flow and a solid balance sheet, positioning it well for long-term growth. Financially, WTC trades at a premium valuation, reflecting investor confidence in its market leadership. The recent deep drop has created a cyclical discount, and technical indicators suggest the stock is nearing oversold territory. With fundamentals intact, WiseTech appears poised for a rebound.
ASX:WTC
by danny_peanuts
Ready to BuyNSB (Neuroscientific Biopharmaceuticals) on the ASX exchange is looking like it is ready to take off. Why? First the RSI7 has gone below the 30 line and returned above it giving an alert. Second, the Stochastic 39,1 has fallen below the 30 line and then crossed above the 27 line within 6 weeks of the alert giving a buy signal. The EMA21 had been falling and then is either level or rising giving confirmation. The 10 period average daily liquidity is around $84000 meaning a buy parcel up to $8400 (1/10 daily average liquidity) would be OK and the PEGY ratio is less than 1 which Peter Lynch has as his requirement. Use an initial 8% stop loss and then loosen that as the price rises. Speculative.
ASX:NSBLong
by Katandra
11
$LRV , SetupENTRY : CMP TP1 : 2.24 TP2 : 2.74 TP4 : 6.50 TP5 : 9.20 SL : If you wish My SL is never a SELL, just an alarm to stop adding money and wait for better dca Follow, Boost, Thank You !! Website available !! ⚠️ Financial Disclaimer: This post is not financial advice. I am not your financial advisor, your life coach, or your legally responsible adult. Always do your own research and never trade based solely on internet comedy.
ASX:LRVLong
by evolutionqc
11
HUGE ASX UPSIDE! TREND CONTINUATION!!!!The C-wave phase in markets doesn’t discriminate. It doesn’t care about fundamentals. It doesn’t reward logic. It feeds on fear, uncertainty, and emotional reaction — and only later does the narrative catch up to justify it. That’s exactly where the ASX has been operating on the lower timeframes. Over the past ~5 years, we’ve seen a sustained corrective move, with the market nearly halving from ~95.7 to ~49. Structurally, that’s been enough to convince most participants that something is fundamentally broken. Yesterday, the Prime Minister addressed the nation — and what was delivered wasn’t confidence. It was caution. Uncertainty. A tone that reinforced the exact sentiment already present in the market. To most, that confirms downside. To me, that completes it. Because here’s what matters — causation, not reaction. When fear is already embedded into price, and leadership amplifies that uncertainty at the exact moment price reaches higher timeframe support… that’s not the beginning of a new move lower. That’s exhaustion. On the higher timeframe, the ASX remains in an uptrend. What we’ve just experienced aligns far more with another similar-sized “X” wave correction within a broader bullish structure, rather than the start of a long-term breakdown. And now, price has reacted directly off the higher timeframe trendline. At the same time, the lower timeframe C-wave — the phase dominated by panic and emotional selling — appears to be completing. This is where it gets interesting. Because as that C-wave ends, the higher timeframe Z-wave is beginning to assert itself. Read that again. The lowest timeframe fear is peaking at the exact moment the highest timeframe trend is re-engaging. That’s not coincidence. That’s structure. What most are interpreting as confirmation of weakness, I see as the final emotional flush of a completed correction. Positioning is defensive. Sentiment is heavy. Narratives are pessimistic. Perfect conditions for reversal. My view is simple: The correction is complete — or extremely close to it. The ASX has reacted from key higher timeframe support. The lower timeframe C-wave is ending. The higher timeframe Z-wave has begun. From here, the path of least resistance is no longer down. The ASX is preparing to reverse — and continue higher. This isn’t financial advice. It’s a structural perspective on market behavior.
ASX:ASXLong
by Trading_Matrix
Distribution Taking Control, Bears Driving the TapeCCP showing classic signs of distribution. Candle spreads are widening while volume is rising a clean indication that supply is overwhelming demand and that bears are firmly in control of the current leg. For the market to shift back into a “safe zone” • A decisive break above $14.61, • Followed by a higher low to confirm structural strength. Until that happens, rallies into resistance remain vulnerable. Trade Plan Entry If you’re not already positioned, the higher‑probability play is to wait for: • A retest of the lows, • Ideally on declining volume, • With a rejection wick into the LVN to show absorption. This keeps you aligned with the dominant trend rather than fighting it. Targets • Yearly S2 pivot — this level aligns with multiple demand factors and is the cleanest confluence zone on the chart. Stops Your stop placement depends on your risk appetite: • Aggressive: Above $12.84, the recent swing high. Note: This sits inside the LVN, so a sweep is possible. • Conservative: Above $14.61, the key structural swing high. This gives the setup more breathing room but increases risk per trade. As always, nothing is guaranteed manage risk according to your plan and stay adaptive.
ASX:CCPShort
by AlvinDeo96
Bullish potential detected for ARUEntry conditions: (i) higher share price for ASX:ARU along with swing up of indicators such as DMI/RSI, and (ii) observation of market reaction at prior potential resistance area of $0.285 (from the open of 12th March 2026). Depending on risk tolerance, the stop loss for the trade would be: (i) below the rising 200 day moving average (currently $0.24), or (ii) below the support level from the open of 24th February ($0.225), or (iii) below the swing low formed on 13th February ($0.215).
ASX:ARULong
by Ivory_Wolf
Updated
Potential key reversal top detected for EHLLevel of interest: Prior support/resistance level in the past of $1.31 (07-Oct-2024) (key support/resistance area to observe). Await signals for entry such as DMI/ADX and/or RSI swing to the bearish direction, and observe market reaction to support/resistance area at $1.31 to confirm. Stop loss for the trade involving ASX:EHL (and indication that this trade is an absolute 'no-go') is any trade above the high of the signal day of 19th February (i.e.: any trade above $1.46).
ASX:EHLShort
by Ivory_Wolf
Updated
Deep Yellow Playbook: Aggressive Trigger vs. Staggered Value EntDYL is shaping up for a potential bullish leg, with price action suggesting the pullback may be complete as of the week beginning 18 August, marked by a doji candle into prior resistance zone that flipped to support—classic PA behavior. Price also found support in a Low Volume Node (LVN) zone—adding confluence to the setup. Aggressive Entry Timing: Week beginning 25 August Entry: Market or limit near current levels Stop Loss: Just below the 18 August doji low Target: Two range targets based on prior structure (can be layered or scaled) This approach suits traders looking to front-run the breakout with tighter risk and earlier positioning. Conservative Entry Trigger: Wait for a clean break above the 14 July high of $1.870 Stop Loss: Below the structure that forms post-breakout Target: Same range targets, with potential for extension if momentum builds This method prioritizes confirmation and structure, ideal for those seeking higher conviction. Alternative Scenario – Pullback Continuation If price continues to retrace, it may revisit Buy Zones identified in prior modeling. This opens the door for: Staggered entries across the zone Higher R-multiple potential if price rebounds from deeper value Larger position sizing with tighter invalidation This setup favors traders with patience and capital flexibility, aiming to build a position into strength.
ASX:DYLLong
by AlvinDeo96
Updated
11
Approaching a Major Inflection Point After 2.5‑Year DowntrendNHC is shaping up for a meaningful breakout after a ~2.5‑year downtrend. We’ve still got a few days left in the monthly candle, but a close above $4.71 would strengthen the probability of a sustained trend reversal. Why the setup is interesting - Price has reacted cleanly from a macro 50% retracement (ATL → ATH). - It’s also sitting right on the major 50% level from the COVID low to ATH. - Price is currently resting on the old ATH region, turning prior resistance into support. - We’re seeing a potential first test and impulsive break of the yearly pivot (need to see spike of volume relative by end of month with larger candle spread) - Volume has been declining for ~2 years, hinting at seller exhaustion rather than active distribution. Where caution is still warranted - The monthly candle hasn’t closed, and price is pressing into the yearly pivot for the first time. - Coming in sideways increases the chance of a rejection wick before any true breakout. - A sharp pullback into S1 wouldn’t be unusual, especially if the pivot acts as initial resistance before a stronger rally and eventual breakout attempt. Overall, the structure is improving, the higher‑timeframe levels are doing their job, and the pivot interaction will likely dictate whether we break now or after a cleaner retest.
ASX:NHCLong
by AlvinDeo96
Updated
Bearish potential detected for ALXEntry conditions: (i) lower share price for ASX:ALX along with swing of DMI indicator towards bearishness and RSI downwards, and (ii) observing market reaction around the potential resistance area of $4.60 from the open of 17th February. Depending on risk tolerance, the stop loss for the trade would be: (i) above the declining VWAP (currently $4.75), or (ii) above the recent swing high of 10th March (open of $4.92).
ASX:ALXShort
by Ivory_Wolf
Updated
Potential outside week and bullish potential for IPTEntry conditions: (i) higher share price for ASX:IPT above the level of the potential outside week noted on 6th March (i.e.: above the level of $0.070). Stop loss for the trade would be: (i) below the low of the outside week on 4th March (i.e.: below $0.057), should the trade activate.
ASX:IPTLong
by Ivory_Wolf
Updated
112233445566778899101011111212131314141515161617171818191920202121222223232424252526262727282829293030313132323333343435353636373738383939404041414242
…999999

Made by humans

Select market data provided by ICE Data Services. Select reference data provided by FactSet. Copyright © 2026 FactSet Research Systems Inc.Copyright © 2026, American Bankers Association. CUSIP Database provided by FactSet Research Systems Inc. All rights reserved. SEC filings and other documents provided by Quartr.© 2026 TradingView, Inc.

More than a product
  • Supercharts
Screeners
  • Stocks
  • ETFs
  • Bonds
  • Crypto coins
  • CEX pairs
  • DEX pairs
  • Pine
Heatmaps
  • Stocks
  • ETFs
  • Crypto coins
Calendars
  • Economic
  • Earnings
  • Dividends
  • IPOs
More products
  • News Flow
  • Portfolios
  • Fundamental Graphs
  • Yield Curves
  • Options
  • Macro Maps
  • Pine Script®
Apps
  • Mobile
  • Desktop
Community
  • Social network
  • Wall of Love
  • Refer a friend
  • House Rules
  • Moderators
Ideas
  • Trading
  • Education
  • Editors' picks
Pine Script
  • Indicators & strategies
  • Wizards
  • Freelancers
  • Paid Spaces
Tools & subscriptions
  • Features
  • Pricing
  • Market data
  • Gift plans
Trading
  • Overview
  • Brokers
  • Brokers comparison
  • The Leap
Special offers
  • CME Group futures
  • Eurex futures
  • US stocks bundle
About company
  • Who we are
  • Space mission
  • Blog
  • Help Center
  • Careers
  • Media kit
Merch
  • TradingView store
  • Tarot cards for traders
  • The C63 TradeTime
Policies & security
  • Terms of Use
  • Disclaimer
  • Privacy Policy
  • Cookies Policy
  • Accessibility Statement
  • Security tips
  • Bug Bounty program
  • Status page
Business solutions
  • Widgets
  • Charting libraries
  • Lightweight Charts™
  • Advanced Charts
  • Trading Platform
Growth opportunities
  • Advertising
  • Brokerage integration
  • Partner program
  • Education program
Community
  • Social network
  • Wall of Love
  • Refer a friend
  • House Rules
  • Moderators
Ideas
  • Trading
  • Education
  • Editors' picks
Pine Script
  • Indicators & strategies
  • Wizards
  • Freelancers
  • Paid Spaces
Business solutions
  • Widgets
  • Charting libraries
  • Lightweight Charts™
  • Advanced Charts
  • Trading Platform
Growth opportunities
  • Advertising
  • Brokerage integration
  • Partner program
  • Education program
Look FirstLook First