Long
Long
 Long
Long
 Long
Long
 Long
Long
 Long
Long
 Long
Long
 Long
Long
 Long
Long
 Long
Long
CSL Grand Supercycle Correction Over?They used to say "never sell CSL", they were right up until it peaked on March 2020. This was at the height of the Covid dump, whilst other stocks crashed; CSL was putting in a supercycle top. If you didn't sell the top, you are now down 72% since the all time high. Ouch!
CSL is not any old stock, this is a leader in the ASX, one of the greatest businesses out of Australia. I was closely looking at this stock less than a year ago, fortunately I only purchased a tracker share and didn't pull the trigger for a bigger order, as it didn't have any positive momentum. Little did I know that management would fall apart and the business would have a $5 billion non cash impairment charge scheduled across FY26 and FY27. This triggered a massive sell off event, the stock capitulated to levels not seen since 2016. Yikes!
This used to be a growth stock, now I am looking at it as a turnaround play. This requires patience and belief, I think the market is over reacting here and this business presents an opportunity. If you have 1-2 years and can stomach volatility, this stock may be for you.
I consider CSL a wide moat business. It is split between CSL Behring (plasma, 70% revenue), CSL Seqirus (flu vaccines, 20% business), and CSL Vifor (10% of business). Trading at $97 AUD against a $3.1 billion cash profit run rat puts CSL at an implied forward multiple of 10.1x NPATA. I think patient investors are getting a 50% margin of safety at current levels.
The technicals suggest a complete flush out of sellers, an RSI of 16 on the weekly completely resets the RSI from the previous cycle low. This is a rubber band setup that value investors look for, to ensure sellers have completely exited.
My technical analysis has so far caught the exact love of the move, but I would like to see it reclaim $100 AUD and show some positive momentum. If it fails to hold $94, this could head down another 50%, I don't think that will happen but anything is possible given how badly this business has been managed in recent years.
Whilst the world clamours over AI stocks, and tech puts in a euphorics high, I am looking at deep value plays in dividend compounders - CSL ticks the box.
Keep a close eye on this, not financial advice.  Long
Long
Theta Gold Mines: Nordic Bond at 14-15% with Strong CollateralTheta Gold Mines ASX:TGM is an Australian-listed gold exploration and development company with its primary assets located in South Africa’s historically prolific gold mining region. The company is preparing to issue a four-year Nordic senior secured bond with an expected size of approximately $90 million. Proceeds will be used to restart the brownfield Transvaal Gold Mining Estate (TGME) project near the historic mining town of Pilgrim’s Rest in Mpumalanga province. Commercial production is targeted for 2028, with projected all-in sustaining costs of around $1,200 per ounce - well below the industry average.
Project Economics and Financial Outlook
According to the company’s financial model , once in full production the project is expected to generate significant free cash flow. In 2029, Theta Gold anticipates free cash flow of approximately $150 million. The low-cost profile, combined with confirmed reserves and existing infrastructure, positions the project to remain viable even at substantially lower gold prices than current spot levels.
Bond Structure and Terms
The bonds will be issued at the holding company level as senior secured debt. The offering features a fixed quarterly coupon, expected in the region of 15%. The structure includes scheduled amortization of $7.5 million per quarter after the first two years, with the remaining principal due at maturity in 2030. Call options allow early redemption with make-whole protection in the first two years, followed by step-down premiums thereafter. A put option at 101% is available upon change of control or delisting. The documentation also includes an equity claw-back feature permitting the issuer to redeem up to 35% of the principal within six months of a successful IPO.
Security and Credit Protection
The bonds benefit from strong structural protections. Guarantees are provided by all material group companies, including the South African operating entity. Security consists of pledges over the shares of each guarantor and a first-ranking claim on all subordinated and intercompany debt. The loan-to-value ratio is extremely conservative at approximately 10%, indicating that the debt is significantly over-collateralized. Financial covenants include a minimum liquidity requirement of 10% of outstanding principal and, after the first 30 months, a net debt to EBITDA test capped at 2.0x.
Investment Considerations
The combination of low production costs, a clear path to substantial free cash flow, and robust security features makes the offering attractive at the indicated yield range of 14-15%. The market appears to be pricing in a highly conservative scenario, while the underlying project economics and collateral package suggest a materially stronger credit profile. For investors comfortable with the South African jurisdiction and gold price exposure, the bond provides a compelling risk-adjusted return in the Nordic high-yield segment.  Long
Long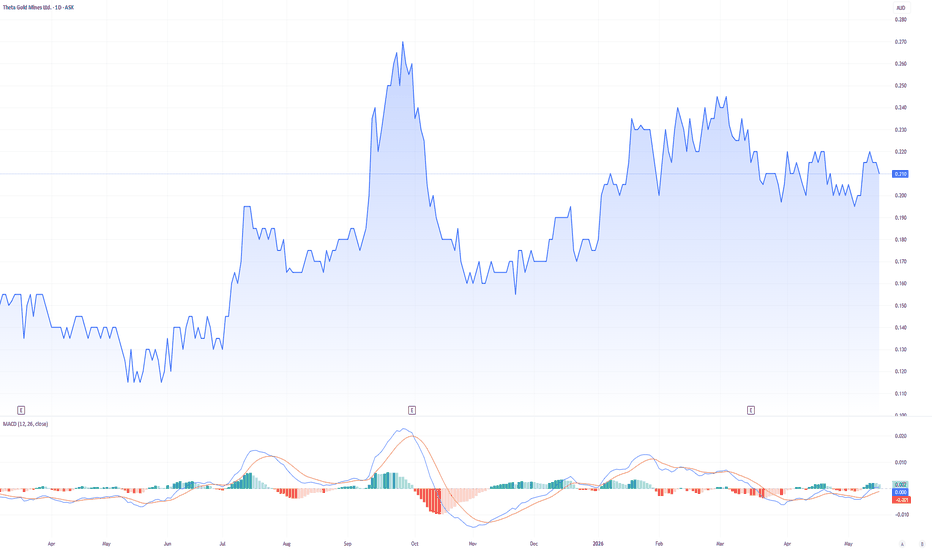
 Long
Long
Phase E incomming?AFG is shaping up with a structure that demands attention. Since August 25, price has retraced a clean 25% into the first key area of interest, with subsequent support zones clearly defined on the chart.
The ideal scenario is for price to hold above the purple box. Should it pierce that zone, any entry would need to be backed by a compelling signal for example, a bullish doji or hammer candle accompanied by a spike in volume. For now, price remains well above that level, so the focus is on taking it step by step.
For those employing a DCA approach, risk management is paramount. The invalidation level is set at the LPS low, which serves as the hard stop. This choice reflects the nature of small caps: price can wick through key zones and trigger stops, so anchoring risk to the LPS provides a more robust safeguard.
Once a clear monthly higher swing low is established, the stop can be adjusted and trailed beneath each new monthly swing low. The initial target sits just below the local August high. If price achieves a clean breakout above those highs, stops can be trailed further to capture the bulk of the move.  Long
Long
 Long
Long
 Short
Short
 Long
Long
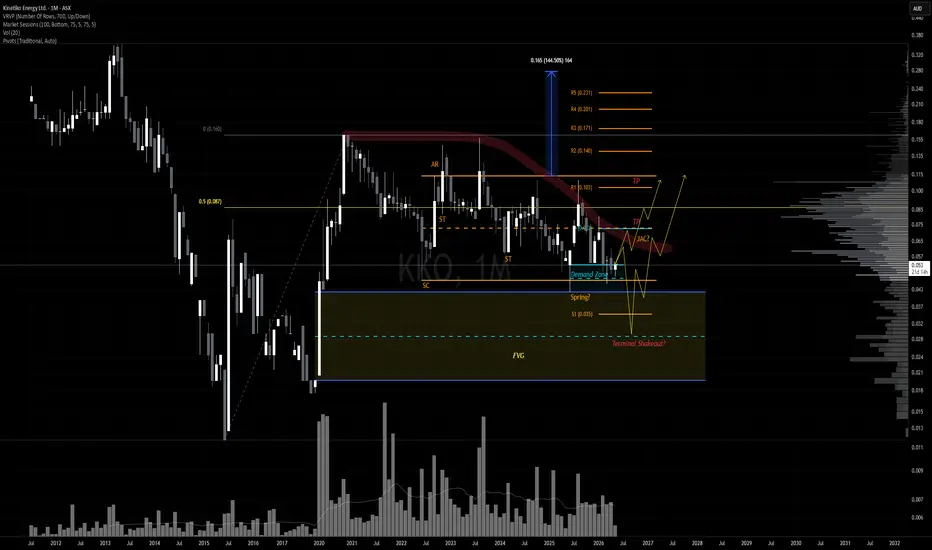
Spring Retest or Terminal Shakeout LoadingKKO is starting to look interesting again.
After trending down consistently since December 2020, the June 2025 low printed what appears to be a low‑volume Spring. Price rallied cleanly into the range highs before supply stepped in, and we’ve since pulled back toward the Spring.
Ideally, this pullback would’ve shown declining volume and a quick rejection from the lows. Instead, volume has lifted — but importantly, we’re not seeing wide candle spreads or aggressive selling, which you would expect if this were true distribution. That keeps the re‑accumulation scenario alive.
There’s also a realistic chance of a terminal shakeout. For that to confirm, we’d need a sharp push down followed by a fast reclaim back into the range. This aligns with the current structure: price has been moving sideways between the yearly Pivot and S1, and the first test of S1 (Feb 2026) produced a clean rejection.
With the current S1 sitting just below the range lows and inside the May 2020 COVID wick FVG, the setup is ideal for a quick liquidity flush before markup.
Trade Scenarios
Aggressive Entry
Enter now since price hasn’t broken the Spring.
Stop‑loss: just below the Spring low.
If the terminal shakeout plays out, you can always re‑enter with better R.
Targets: clearly marked on the chart.
If this is true re‑accumulation, the minimum range target is ~$0.28 — but price has a lot of work to do. One step at a time.
Conservative Entry
Wait for the terminal shakeout and a monthly close back inside the range.
Stop‑loss: below the wick of the shakeout.
Risk Note
This is a speculative setup with multiple moving parts. Manage risk carefully — nothing is guaranteed.  Long
Long
 Long
Long
 Long
Long
 Long
Long
 Long
Long