LongLong
-37 then +56% since IPO. So what is a realistic target for 2030?Good question, I'm glad you asked :)
So, this is quite a bit more challenging to put a number on compared to the Westgold update I just published. Because, there isn't as much track record to go on and the multi-year guidance isn't there.
Personally, I am expecting them to fully utilise their rather vast processing capacity of 20Mtpa. So, just based on the current ore reserve statement, I would expect that 15.5Mtpa would be a mix of Main Dome underground, Telfer Open Pit, and lower grade stockpiles. Hard to say in what proportion, but I am putting that at a combined grade of 0.9gpt. At some point in the future, the planned underground ore crusher and ore transport system should reach the planned 4.2 to 4.5Mtpa level - I used 4.5Mtpa in my calculation. The grade I used was 2.6gpt.
That implies 13,950,000 grams from Main Dome etc and 11,700,000 from Haverion. This will be reduced by processing losses of about 15% to 21,802,500 grams Au or 700,977 ounces of gold. That is quite a significant number. If we value gold at a very conservative AUD5000/oz and current All in Sustaining Cost per ounce of AUD1849/oz that would imply a fair valuation (at some point in the furture) of between 2.5 times higher at low valuations and 3.7 times higher.
So, simple story; I expect Greatland to be worth around three times as much within 5 years. That is without further increases in the gold or copper price. It is also without acquisitions, ANTIPA seems to be a potential future take-over target as they have some impressive intercepts and have large exploration tenements adjacent to the Telfer processing plant.
 Long
Long
Westgold fair value 2026 and 2028Hi guys,
Disclaimer - I own this - not trying to "pump it," just trying to put a value on it for within the next 12 months and before the end of 2028.
This is entirely based on their 1st October three year gold production guidance for both years, which may change.
Within 2026 - even without further gold price rises - I would expect Westgold should be valued at or around 32% more at $6.96 - let's say $7. That was just based on a gold sale price of AUD5000 (spot price is AUD5845.65 at the time of writing). Should be valued at and will be valued at are two different things, although, at the moment, it would be reasonable to expect some 'over-shoot' of its fair-value.
By 2028 I am expecting WGX to be trading around $9.96 (lets call it $10) or another 89% higher. This is based on expected production numbers less expected costs of production at AUD$5000 gold. Add (or subtract) as the spot gold price fluctuates. However, I firmly believe that there are medium term (5 to 10 year) tail-winds in place that will drive the gold price higher over time.
For me; gold is generational wealth and gold miners represent leverage on an appreciating asset class.
 Long
Long
WHC, White Heaven coal is calling again ! - ^.^^Either you Go Big or Go Bust!
White Heaven Coal new price target raises to $8.
There will be volatility of coal price in the near future
However,
Price bounces back above 20/60MA with huge Volume.
Signaling there are powerful investors come in.
Most investors have positive outlook about this stock.
Price Target Next is $8.


Trade Idea: Aristocrat Leisure (ALL.ASX)After consolidating post-May earnings, ALL is showing signs of strength and attempting another breakout. Price has reclaimed key moving averages and is forming a potential right-side pattern, giving a favorable risk/reward entry.
• Buy Zone: 70.50 – 70.80
• Stop: 67.00 (just below recent support)
• Target 1: 75.00
• Target 2: 80.00 (if momentum builds)
💡 Rationale:
Volume is supporting the move, and the stock is tightening around key levels. A decisive push above 71 could trigger momentum buying. Risk is well-defined and manageable.
DISCLAIMER : The content and materials featured are for your information and education only and are not attended to address your particular personal requirements. The information does not constitute financial advice or recommendation and should not be considered as such. Risk Management is Your Shield! Always prioritise risk management. It’s your best defence against losses.


Easy Money...Expecting big things here - either company turns into a producer or gets bought out via take over bid imo.
 Long
Long
Bearish potential detected for BENEntry conditions:
(i) lower share price for ASX:BEN along with swing of DMI indicator towards bearishness and RSI downwards, and
(ii) observing market reaction around the share price of $12.44 (open of 23rd June).
Depending on risk tolerance, the stop loss for the trade would be:
(i) above the potential prior resistance of $12.84 from the open of 11th June, or
(ii) above the potential prior resistance of $12.90 from the open of 11th July, or
(iii) above the declining 10 day moving average (currently $13.02), or
(iv) above the low of the range of day prior to the gap-down (1st September) of $13.10.
 Short
Short
Bullish potential detected for PME (gap continuation)Entry conditions:
(i) higher share price for ASX:PME along with swing up of indicators such as DMI/RSI (gap continuation play).
Depending on risk tolerance, the stop loss for the trade would be:
(i) below the previous potential support of $294.88 from the open of 18th September, or
(ii) below the low of the recent swing low of $288.28 of 15th September.
 Long
Long
Bullish potential detected for IREEntry conditions:
(i) higher share price for ASX:IRE along with swing up of indicators such as DMI/RSI.
Depending on risk tolerance, the stop loss for the trade would be:
(i) below the low of the recent gap-up (4th September) of $8.80, or
(ii) below previous potential support of $8.63 from the open of 13th May.
 Long
Long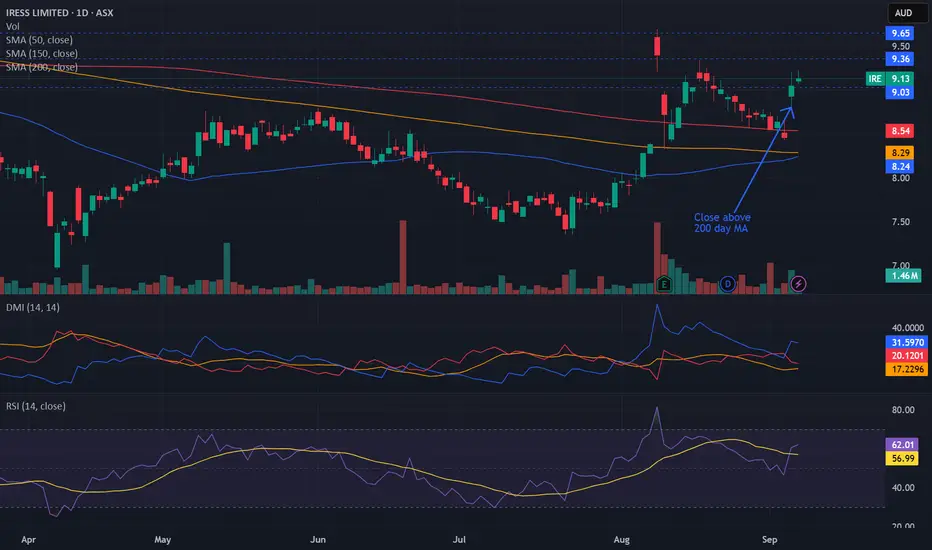
Potential outside week and bullish potential for CDTEntry conditions:
(i) higher share price for ASX:CDT above the level of the potential outside week noted on 5th September (i.e.: above the level of $0.078).
Stop loss for the trade would be:
(i) below the low of the outside week on 2nd September (i.e.: below $0.063), should the trade activate.
 Long
Long
 Long
Long
ART 0.415 AIRTASKER leaning on the breakIts been a grind but finally with some positive financials in the background, we may see some upside soon.
Pnf60 also printed for those interested
Tests are becoming very light volume events, but do also make it tricky to get a decent fill.
Holding from 0.39
 Long
Long
Constructive Gold
It’s been building for a while.
Respected 10cents and pushing through.
Known gold deposit and 20k metres of drilling under way.
Small cap, control your risk!
 Long
Long
PDN Long triggers on PDN IF we get the pullback this is where il look to take a long.
If Price trade below Range low and holds Idea is wrong and its time to re-evaluate
Uranium

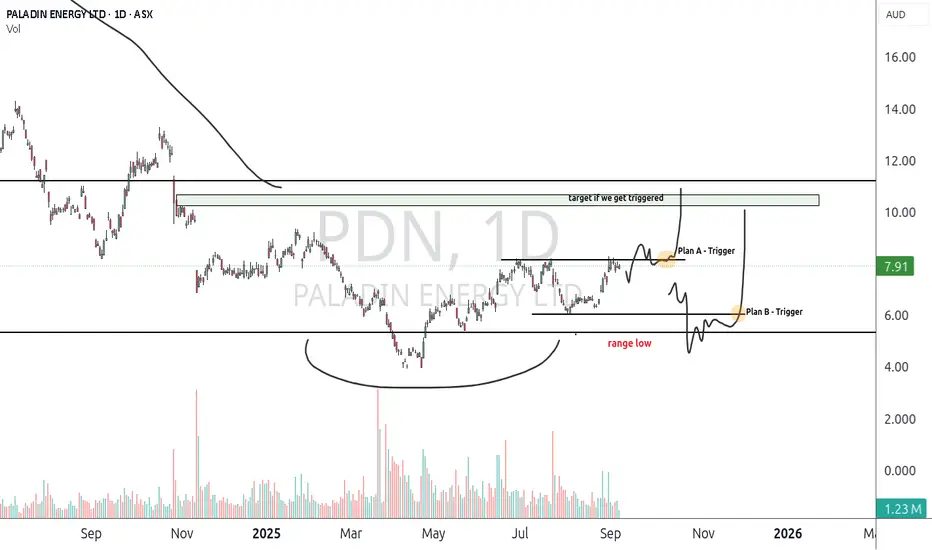
$dylTwo Trigger plans marked out on chart,
1. A push down take liquitity marked in orange and a reclaim of the mide range = trigger 1
2.A fast push into range low and hold the "Big quartely level" = trigger 2
#uranium
#dyl


$pdn$pdn.ax ASX:PDN
Still just range bound, deviated the big Quaterly level and now trading into the Big yearley level..
pullback almost 33% so far
Plan marked out on chart..
Under, then trigger once back over.. Then a resending back to into green zone..
Not a prediction
#uranium

$IBX My Bias is long on this stock it put in a 10 month rounded bottom, Deviated the 2024 Yearly low and back above.
Plans:
Plan A (Pullback)
-Price trade's back into the green zone and backtests the 50-day moving average. This is my ideal setup to get long on this.
Plan B
Price ranges inside the local range, sweep the range low then reclaim it will be a trigger to get long also. This ties into Plan A a little.
Plan C
Price ranges inside the local range, then breakout of local range high.. Get long. Stoploss back indside the range..
Good Luck
 Long
Long
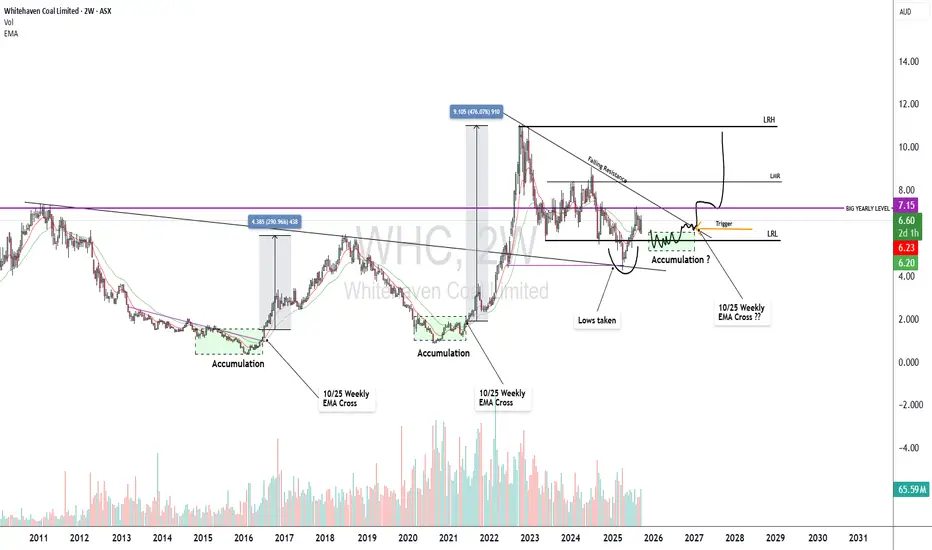
WHCWhitehaven coal, This is on the WL (watch List) for now. Has some work to do to proive itself.
Needs to hold LRL imo, a breakout of the falling resistance line and an EMA cross will be the trigger. With expectance price clear's the Big Yearly level.
COH Re-Entry Setup: High Dividend Play With Upside PotentialCochlear (ASX: COH) continues to stand out as one of the premier dividend stocks on the ASX, currently paying A$2.15 per share semi-annually (A$4.30 annually). With the next ex-dividend date falling on 18 September 2025, investors who accumulate positions within the coming weeks can secure strong passive income while also positioning for potential capital growth. This dividend flow adds a layer of consistency to the portfolio, making COH a defensive yet opportunistic play in uncertain markets. Unlike many high-growth names, COH offers a blend of stability and upside potential, which is attractive for investors aiming to compound both yield and price appreciation.
From a technical perspective, COH has cleanly respected the weekly Fair Value Gap (FVG), offering a well-defined buy zone between A$276.05 – A$291.70. This zone aligns with a retracement into structural demand, giving confluence for a high-probability long setup. Should price continue to hold above this level, the next logical upside targets sit around A$350+, with intermediate liquidity resting at A$322.75. Price has built significant buyside liquidity pools above prior highs, which the market tends to seek in order to rebalance inefficiencies. For dividend-focused investors, this setup is especially compelling — not only is there steady income from the semi-annual payout, but also the possibility of capturing 30%+ capital growth from current levels. COH therefore provides a dual benefit: reliable cash returns and strong technical momentum that could fuel a multi-month rally.
 Long
Long
GRX Swing Setup Watch $0.595 and $0.875GRX is showing promising signs here, but as a small-cap stock, it demands disciplined risk management and a cautious approach. Price action is currently pulling back into a strong macro zone, aligning with the major 50% retracement level and previous structural highs—an area worth watching closely.
Trade Scenarios
Scenario 1 Optimal Entry:
Ideally, price pulls back to the demand structure around $0.595.
Look for a bullish candle confirmation at this level.
This setup offers the most favorable risk-to-reward ratio.
Scenario 2 – Trend Continuation:
If price holds the swing low at $0.68 and breaks above the local swing high at $0.875, it confirms an uptrend.
Same TP targets apply.
Targets:
Initial target: ATH resistance near $1.305
Potential for further upside by trailing stop-loss along swing highs.
If price starts to break and close below $0.56 expect lower prices and the potential of this being a fakeout
Reminder: This is a speculative setup on a small-cap stock. Always size positions appropriately and manage risk with precision.
Please note, arrows are not based on time analysis just overall market structure.
 Long
Long
BWP Setup: Support Holding, Momentum BuildingKeeping it simple here. Price has established a strong base between $3.20 and $3.70, showing clear signs of accumulation. All major trend indicators have just turned up, suggesting momentum is building.
Trade Plan
Entry: Current levels offer a solid technical foundation
Target: Initial TP around $4.20
Risk Management: Respect the All-Time High (ATH) resistance zone
Trailing Strategy: Trail stop losses below each new swing low to stay aligned with the trend
 Long
Long
Simple Trade Plan on Small Cap StrengthConfirmed, BU/LPS in Play
Another promising small cap chart showing strong technical alignment. After a healthy pullback, price has now printed a significant Higher Low (HL) right at the confluence of two major 50% retracement levels (macro and local). This zone has historically acted as a magnet for liquidity and trend continuation.
Adding to the bullish case:
We've seen a Jump Across the Creek (JAC), signaling strength
Followed by a clean Back Up / Last Point of Supply (BU/LPS), confirming the retest and potential for markup
Trade Strategy
Simple Execution Plan:
Entry: Current levels offer a solid entry opportunity
Stop Loss: Just below the BU/LPS zone. If price breaks below, reassess as this could signal a failed breakout or fakeout
Take Profit: Initial TP just below the R2 yearly pivot
Trend Management: Potential Trail stop loss beneath each new swing low to stay aligned with trend structure and maximize upside
 Long
Long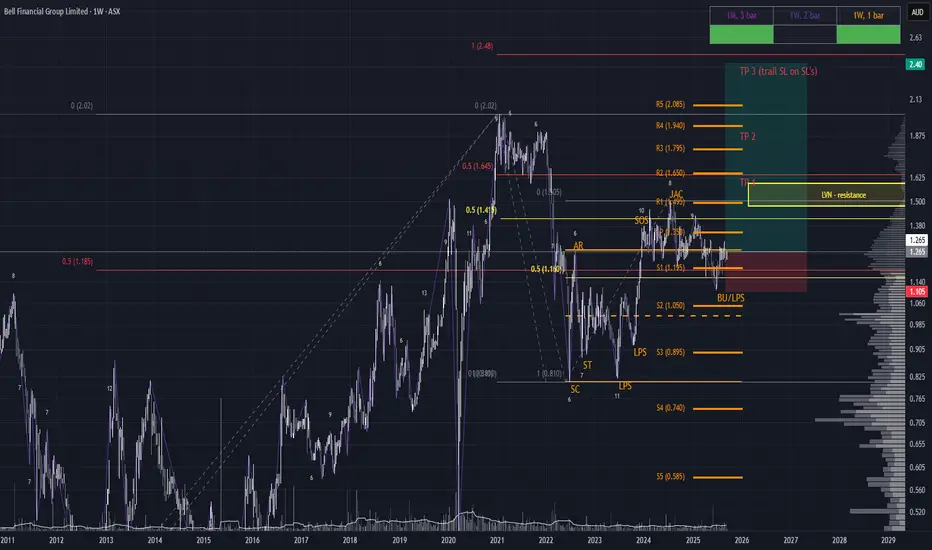
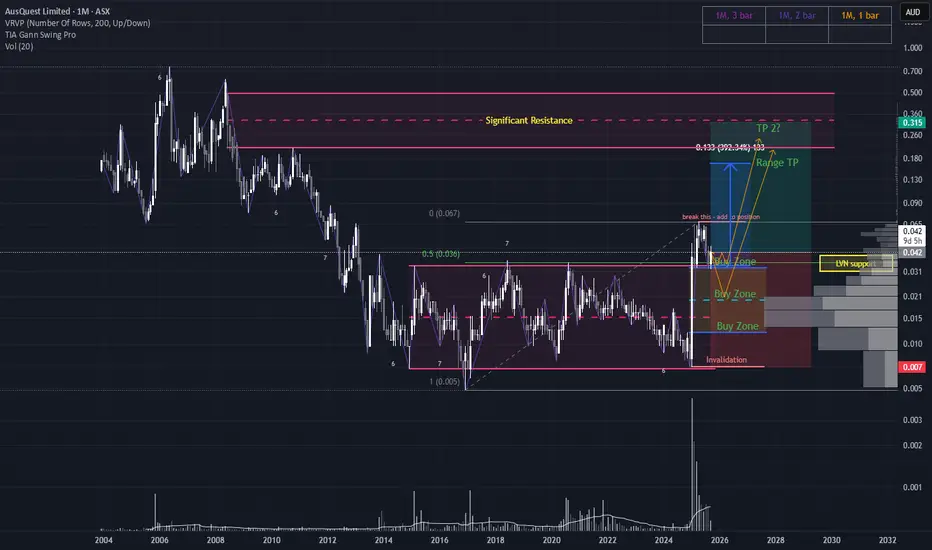
High-Risk, High-Reward Play with Dual Entry StrategyAs always with nanocap stocks, extreme caution and disciplined risk management are essential. That said, the chart structure for AQD is showing promising signs of continuation, and there are a couple of strategic ways to approach this setup:
Conservative Entry Strategy
Trigger: Entry only if price breaks above the recent high at $0.068
Stop Loss: To be placed at the newly formed structural low once confirmed
Take Profit: Initial target would be the range high; depending on market structure, a more ambitious target could be the supply structure equilibrium zone near $0.315
Staggered Entry Strategy
Price has pulled back into a key area of interest, aligning with:
Range tops
A major 50% Fibonacci retracement from the swing high of $0.65 to the low of $0.005
Low Volume Node region
If the pullback continues:
Watch for price to find support within the Fair Value Gap (FVG), especially around the equilibrium zone
A well-formed doji or bullish hammer candle in this region would offer a fantastic opportunity to scale into the position.
If price doesn't pullback into the FVG then you are already positioned and can add to the winning position when $0.068 top is broken and trail stop loss at the new SL
Until a clear structural low is formed, the provisional stop loss must be placed at $0.007 therefore highlighting the importance of proper risk management.
 Long
Long