EMFD: Descending Flag Signals Potential Breakout Toward New High📊 EMFD: Descending Flag Could Fuel the Next Breakout Toward New Highs 🚀
🏛️ Fundamental Review:
📊 Business Quality:
EMFD is one of Egypt's premier real estate developers and a subsidiary of Emaar Properties PJSC. The company develops landmark residential, hospitality, and mixed-use projects including Marassi, Mivida, Uptown Cairo, and Cairo Gate, making it one of the highest-quality real estate companies on the EGX. 🏗️
✅ Strengths & Catalysts:
EMFD delivered exceptional Q1 2026 results, with revenue increasing to 6.76B EGP while net profit surged 134% year-over-year to 7.77B EGP. 📈
The company maintains a cash-rich balance sheet that generated more than 6B EGP in finance and investment income during the quarter. 💰
Strong backing from Emaar Properties provides financial strength, execution capability, and one of the strongest brands in the regional real estate sector. 🏆
⚠️ Risks:
Operating margins remain sensitive to construction cost inflation and delivery expenses. ⚠️
The company focuses on premium real estate, making sales activity more dependent on luxury demand and Gulf investors. 🏘️
Management continues to prioritize reinvestment over cash dividend distributions. 📉
🕌 Sharia Compliance:
🟢 EMFD is a constituent of the EGX33 Shariah Index, indicating that it satisfies the EGX33 Sharia Supervisory Committee's business activity and financial screening requirements. ☪️
💰 Valuation:
EMFD continues to trade at an attractive valuation considering its earnings growth, asset quality, and dominant market position within Egypt's premium real estate sector. 💎
🔍 The Pulse:
EMFD is currently developing a descending flag pattern, which is typically considered a continuation pattern within an existing uptrend. 📊
The stock is waiting for a confirmed breakout before starting the next bullish leg toward new highs. 🚀
The main bearish scenario would be a confirmed break below the lower boundary of the flag. ⚠️
If that happens, the stock could retrace toward the unfilled Fair Value Gap around 10.50 EGP before buyers regain control. 📉
My preferred scenario remains a breakout above the upper side of the flag supported by strong trading volume. 💪
Such a move would provide the momentum needed to challenge and break the previous all-time high. 📈
🧱 The Key Structural Boundaries
🚀 Breakout Trigger.
A confirmed breakout above the upper boundary of the descending flag with strong volume signals the continuation of the primary uptrend.
⚠️ Bearish Trigger.
A confirmed break below the lower boundary of the flag increases the probability of filling the Fair Value Gap around 10.50 EGP.
📍 Fair Value Gap, 10.50 EGP.
A potential retracement zone where buyers could re-enter the market.
🎯 First Major Objective.
A successful breakout targets a new all-time high.
🎯 Long-Term Target, 15.75 EGP.
The primary technical objective for this year if the bullish trend continues.
🛑 Stop Loss, 9.75 EGP.
A confirmed close below the main support level invalidates the current bullish outlook.
🎯 The Verdict:
EMFD remains one of the strongest long-term investment opportunities in the Egyptian real estate sector. 🏆
Its outstanding fundamentals continue to support a bullish long-term outlook despite the current consolidation phase. 📈
The descending flag should be monitored closely, as a breakout accompanied by strong volume could trigger the next major advance toward new highs. 🚀
Until then, patience remains the best strategy while respecting the stop loss below 9.75 EGP. 🛡️
---
If you like my insights, follow and boost! 🙌💙🚀
🎁 $15 TradingView Discount:
www.tradingview.com ✨💸🤑
 Long
Long
ETEL: Blue-Chip Strength Remains Intact While 110 EGP Is the Key📊 ETEL: Long-Term Leader, But Wait for 110 EGP to Confirm the Next Rally 🚀
🏛️ Fundamental Review:
📊 Business Quality:
ETEL is Egypt's national telecommunications operator and the country's digital infrastructure backbone, providing fixed-line, mobile, internet, cloud, and international subsea cable services. It also owns a strategic stake in Vodafone Egypt, making it one of the highest-quality blue-chip companies on the EGX. 🌐
✅ Strengths & Catalysts:
The company continues to deliver outstanding revenue and earnings growth, supported by expanding data consumption, international USD-denominated cable revenues, and recurring income from Vodafone Egypt. 📈
Its dominant market position, government backing, and exceptional competitive moat make ETEL one of the strongest long-term growth investments on the Egyptian Exchange. 🏆
⚠️ Risks:
Short-term price volatility is usually driven by institutional profit-taking rather than deterioration in the underlying business. 📉
🕌 Sharia Compliance:
🟢 ETEL is a constituent of the EGX33 Shariah Index, indicating that it satisfies the EGX33 Sharia Supervisory Committee's business activity and financial screening requirements. ☪️
🔍 The Pulse:
ETEL should always be considered a core holding in a long-term investment portfolio. 🏛️
Its combination of strong fundamentals, government backing, and structural growth makes every healthy pullback a potential accumulation opportunity rather than a reason to panic. 🤝
Today's session printed a potentially dangerous candle, mainly driven by exceptionally strong trading volume resulting from an institutional block transaction around 104 EGP. 📊
As long as any pullback remains above 99.66 EGP, the overall bullish structure remains healthy. 💪
A confirmed close below 99.66 EGP would likely return the stock to the sideways trading range that dominated the previous weeks. ⚠️
If the bullish momentum continues next week, I would wait for a confirmed breakout and close above 110.00 EGP before adding new positions. 🚀
A successful breakout above 110.00 EGP would open the way toward the next major technical target near 130.00 EGP. 🎯
🧱 The Key Structural Boundaries
📍 Healthy Pullback, 99.66 EGP.
Holding above this level keeps the current bullish structure intact.
🚀 Breakout Trigger, 110.00 EGP.
A confirmed close above this level signals the beginning of the next bullish leg.
🎯 Final Target, 130.00 EGP.
The next major long-term technical objective.
⚠️ First Warning, 99.66 EGP.
A confirmed close below this level returns the stock to its previous consolidation range.
🛑 Stop Loss, 93.33 EGP.
A confirmed close below this level for two consecutive trading sessions invalidates the current bullish setup.
🛡️ Risk Note.
The stop loss is intentionally placed well above the 200-day Moving Average, currently around 77.30 EGP, to avoid unnecessary exits during sharp retail-driven panic selloffs.
🎯 The Verdict:
ETEL remains one of the highest-quality investment opportunities on the EGX and deserves a place in long-term portfolios. 🏆
Any controlled pullback should be viewed as an opportunity to accumulate rather than a change in the long-term trend. 📈
A confirmed breakout above 110.00 EGP would provide the strongest technical signal for the next advance toward 130.00 EGP. 🚀
Risk remains well managed with a disciplined stop below 93.33 EGP confirmed over two consecutive trading sessions. 🛡️
---
If you like my insights, follow and boost! 🙌💙🚀
🎁 $15 TradingView Discount:
www.tradingview.com ✨💸🤑
 Long
Long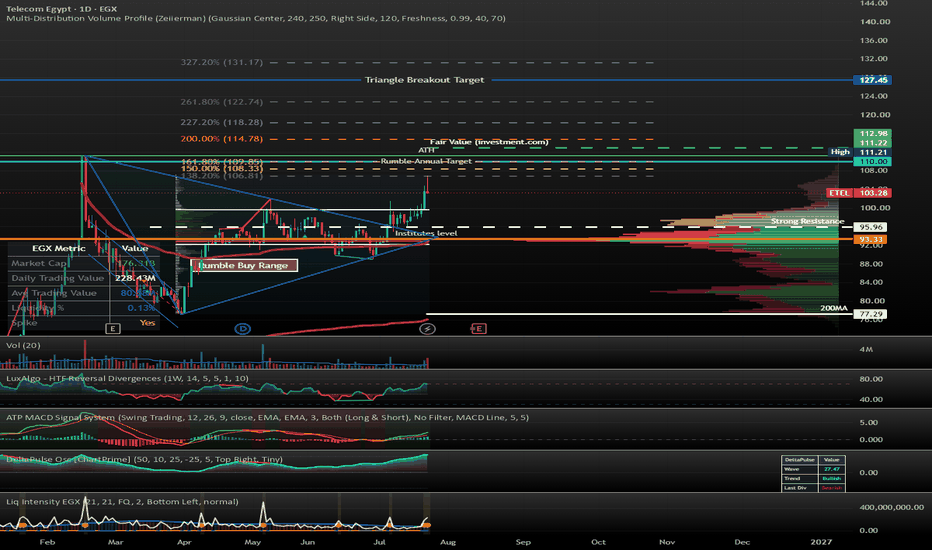
ATQA: Strong Liquidity Breakout, But Key Resistance Still Ahead 📊 ATQA: Strong Liquidity Breakout, But Key Resistance Still Ahead ⚠️
🏛️ Fundamental Review:
📊 Business Quality:
ATQA is a leading Egyptian steel producer specializing in steel rebar and wire rods, benefiting from long-term infrastructure and construction demand. 🏗️
✅ Strengths & Catalysts:
The company returned to profitability in Q1 2026 while maintaining a conservative balance sheet with a low debt-to-equity ratio. 📈
Its dominant institutional ownership provides financial stability and supports the long-term investment case. 💪
⚠️ Risks:
Steel margins remain highly sensitive to billet, scrap metal, and energy prices. ⚠️
The stock also has a relatively limited free float, which can increase volatility during periods of heavy trading. 📉
🔍 The Pulse:
After several weeks of consolidation around the major support at 9.57 EGP and the 200-day Moving Average, ATQA finally delivered a bullish breakout. 🚀
Today's breakout was supported by approximately 90M EGP in trading value, almost three times the average daily liquidity, making this an encouraging first signal. 📊
However, I still believe the stock must overcome several major resistance levels before confirming a sustainable uptrend. ⚠️
During the coming week, I want to see continued strong liquidity to support further upside. 💪
The first major confirmation will be a close above the 61.8% Fibonacci resistance at 10.26 EGP. ✅
A breakout above this level could justify an initial position with a stop loss at 9.80 EGP. 📍
The second confirmation will be a breakout above the long-term descending trend line, where additional exposure can be considered after confirmation. 📈
The next major obstacle is the strong resistance around 11.15 EGP, followed immediately by a bearish Fair Value Gap. 🚧
Clearing these resistance levels would open the way toward a retest of the all-time high near 12.38 EGP. 🎯
🧱 The Key Structural Boundaries
📍 Initial Entry, 10.26 EGP.
A confirmed close above the 61.8% Fibonacci level provides the first buying opportunity.
🚀 Second Confirmation.
A confirmed breakout above the long-term descending trend line strengthens the bullish case and supports increasing the position.
⚠️ Major Resistance, 11.15 EGP.
A key supply zone before the bearish Fair Value Gap.
🚧 Bearish Fair Value Gap.
The final technical barrier before the stock can challenge its previous highs.
🎯 Final Target, 12.38 EGP.
A retest of the all-time high.
🛑 Stop Loss, 9.80 EGP.
A confirmed close below this level invalidates the current bullish setup.
🎯 The Verdict:
ATQA has delivered its first meaningful bullish signal after a prolonged consolidation phase. 🏆
The strong increase in trading liquidity is encouraging, but additional confirmation is still required before becoming aggressively bullish. 📈
Following a staged entry strategy by increasing exposure only after each confirmed breakout offers a more disciplined approach. 🤝
Protect capital with a firm stop below 9.80 EGP while monitoring liquidity closely throughout the coming sessions. 🛡️
---
If you like my insights, follow and boost! 🙌💙🚀
🎁 $15 TradingView Discount:
www.tradingview.com ✨💸🤑
INEG: Breakout But Major Resistance May lead a Healthy Pullback📊 INEG: Breakout Confirmed, But Major Resistance May Trigger a Healthy Pullback ⚙️
🏛️ Fundamental Review:
📊 Business Quality:
INEG (Integrated Engineering Group) is a small-cap industrial and engineering company specializing in steel fabrication, industrial construction, maintenance, and turnkey engineering projects. The company remains a speculative turnaround story driven by execution and future expansion rather than established earnings. 🏗️
✅ Strengths & Catalysts:
The company has returned to profitability, demonstrating positive earnings despite its relatively small operating scale. 📈
A planned capital increase could strengthen the balance sheet and support future business expansion if deployed efficiently. 💰
Recent trading activity has attracted strong speculative interest, supported by improving liquidity and positive technical momentum. 🚀
⚠️ Risks:
The planned capital increase introduces meaningful dilution risk for existing shareholders. ⚠️
The company operates in a cyclical industrial sector where project execution and working capital management remain critical. 🏭
Current profitability remains modest, leaving earnings vulnerable to project delays and rising operating costs. 📉
🕌 Sharia Compliance:
🟡 INEG operates in a Sharia-permissible industrial business. However, sufficient public financial information is currently unavailable to conclusively verify compliance with the latest EGX33 Sharia financial screening criteria. ☪️
💰 Valuation:
The stock should be viewed primarily as a speculative technical opportunity rather than a fundamentally driven value investment until profitability becomes more consistent. 💎
🔍 The Pulse:
INEG has traded inside a well-defined downtrend channel since the beginning of the year. 📉
Last week, the stock delivered a confirmed breakout from that channel supported by strong trading volume. 🚀
The breakout is encouraging, but the price has now reached one of its strongest technical resistance zones. ⚠️
This area combines the Fibonacci 61.8% retracement around 0.534 EGP with a major historical order block, making it a difficult resistance to overcome on the first attempt. 📍
I expect either a period of sideways consolidation or a healthy pullback before the next breakout attempt. 🔄
A normal correction could retest the Fibonacci 50% level, while a deeper pullback may revisit the 200-day moving average before buyers return. 📊
If the stock successfully clears the current order block with strong volume, the medium-term bullish trend would be confirmed. 💪
🧱 The Key Structural Boundaries
🚀 Breakout Trigger, 0.534 EGP.
A confirmed close above the Fibonacci 61.8% level and the major order block signals the next bullish leg.
🎯 First Target, 0.635 EGP.
This aligns with the 52-week high resistance area.
🎯 Second Target, 0.713 EGP.
A successful breakout opens the path toward the previous all-time high.
🎯 Final Target, 0.820 EGP.
This represents the Investing.com fair value estimate and the long-term technical objective.
⚠️ Healthy Pullback Zones.
A retracement toward the Fibonacci 50% level or the 200-day moving average would remain technically healthy.
🛑 Stop Loss, 0.436 EGP.
A confirmed break below this major support invalidates the current bullish setup.
🎯 The Verdict:
INEG has delivered its first meaningful technical breakout after months of trading inside a downtrend channel. 📈
The current resistance zone is exceptionally important, and patience is warranted before chasing higher prices. ⚠️
A confirmed breakout above 0.534 EGP would significantly strengthen the bullish outlook and open the door toward higher targets. 🚀
Until then, expect consolidation or a healthy pullback before the next major move. 🛡️
---
If you like my insights, follow and boost! 🙌💙🚀
🎁 $15 TradingView Discount:
www.tradingview.com ✨💸🤑
ADPC: Distribution Phase Signals Patience Over Aggressive Buying📊 ADPC: Distribution Phase Signals Patience Over Aggressive Buying ⚠️
🏛️ Fundamental Review:
📊 Business Quality:
ADPC (Arab Dairy Products – Panda) is one of Egypt's best-known dairy and cheese producers, owning established consumer brands with broad nationwide distribution. The company operates in the defensive FMCG sector, where demand remains relatively stable throughout economic cycles. 🧀
✅ Strengths & Catalysts:
ADPC benefits from strong brand recognition and a well-established distribution network across Egypt. 📈
Annual revenue continues to grow, exceeding 3.0B EGP, supported by pricing adjustments and resilient consumer demand. 🏪
Expansion into regional export markets provides an additional source of hard-currency revenues. 🌍
⚠️ Risks:
The company continues to suffer from weak profitability due to high imported raw material costs and financing expenses. ⚠️
Its highly leveraged balance sheet remains one of the biggest concerns, with debt levels significantly above comfortable ranges. 📉
Margins remain highly sensitive to foreign exchange movements and global dairy commodity prices. 💱
🕌 Sharia Compliance:
🔴 ADPC is not considered Sharia compliant based on publicly available financial information. Although its core business is permissible, its financial structure appears to exceed commonly accepted Sharia leverage thresholds. ☪️
💰 Valuation:
While the stock appears inexpensive after a prolonged consolidation, the weak financial health and ongoing profitability challenges reduce its investment appeal. 💎
🔍 The Pulse:
ADPC has spent nearly the entire year trading inside a broad sideways range. 📊
The prolonged consolidation increasingly resembles a distribution phase rather than healthy accumulation. ⚠️
Despite operating in a defensive sector, the stock has failed to generate meaningful bullish momentum. 📉
The current technical structure does not justify committing fresh capital while stronger opportunities exist elsewhere in the market. 🚫
Rather than trying to predict a breakout, preserving capital should remain the priority until a confirmed trend reversal develops. 🛡️
🧱 The Key Structural Boundaries
⚠️ Current Structure.
The stock remains trapped inside a long-term sideways distribution channel.
📍 Preferred Strategy.
Avoid new positions until a confirmed bullish breakout supported by strong volume.
🚀 Bullish Confirmation.
A sustained breakout above the long-term consolidation range would be required before reassessing the outlook.
🛑 Risk Management.
Continue respecting the major support near 3.00 EGP as the structural invalidation level.
🎯 The Verdict:
ADPC is fundamentally challenged by weak profitability and elevated leverage despite owning valuable consumer brands. 📉
The current technical picture favors patience rather than accumulation. ⏳
Protect your capital and avoid becoming liquidity for stronger hands during this prolonged distribution phase. 🛡️
Wait for a confirmed breakout before considering any medium-term investment. 📈
---
If you like my insights, follow and boost! 🙌💙🚀
🎁 $15 TradingView Discount:
www.tradingview.com ✨💸🤑
 Short
Short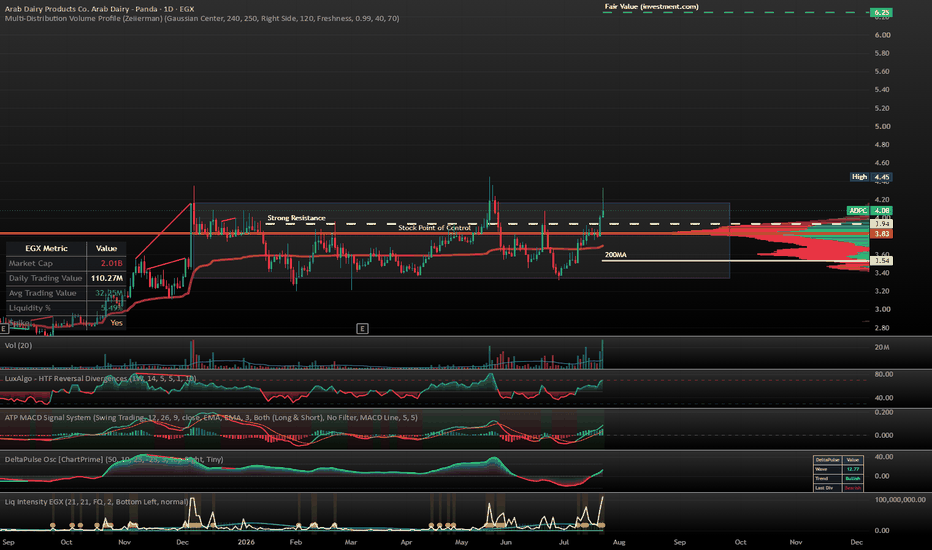
AMES: Strong Rally Needs Deeper Pullback Before the Next Bullis📊 AMES: Strong Rally Needs Deeper Pullback Before the Next Bullish Wave ⚕️
🏛️ Fundamental Review:
📊 Business Quality:
AMES is a leading private healthcare provider on the Egyptian Exchange, operating integrated hospital, surgical, and diagnostic facilities in Alexandria. The company benefits from the defensive nature of the healthcare sector and is backed by strong institutional shareholders. 🏥
✅ Strengths & Catalysts:
The company continues to improve its operating performance, delivering double-digit revenue growth and recovering profit margins. 📈
Healthcare remains one of the most defensive sectors, allowing AMES to maintain resilient demand regardless of economic cycles. 🛡️
Institutional ownership exceeding 96% provides long-term financial stability and supports future expansion plans. 🏆
⚠️ Risks:
The extremely low free float limits liquidity and can result in sharp price movements during periods of low trading activity. ⚠️
Operations remain exposed to imported medical equipment and foreign exchange fluctuations. 💱
The stock currently trades at premium valuation multiples, leaving less room for earnings disappointments. 📉
🕌 Sharia Compliance:
🟡 AMES operates in a Sharia-permissible healthcare business. However, sufficient public financial data is currently unavailable to conclusively verify compliance with the latest EGX33 Sharia financial screening criteria. ☪️
💰 Valuation:
Although the company's business quality remains attractive, the recent rally has pushed the stock above its historical valuation range, making technical entry timing increasingly important. 💎
🔍 The Pulse:
AMES experienced exceptional liquidity over the past month, driving the stock into a parabolic advance that reached a new all-time high near 144.94 EGP. 🚀
Following that rally, the stock entered a healthy correction and retraced toward the Fibonacci 38.2% level around 107.00 EGP. 📉
Last week confirmed that the correction is still underway. 📊
Despite the current pullback, I remain bullish over the medium term because the exceptional institutional and retail liquidity suggests the long-term trend remains intact. 💪
My long-term technical target remains around 245.00 EGP if the broader bullish structure continues. 🎯
However, momentum and volume indicators remain significantly overbought, suggesting the correction has not yet fully matured. ⚠️
I would prefer to wait for a deeper retracement toward the Fibonacci 61.8% level around 83.50 EGP before considering new entries. 📍
That area offers a much more attractive risk-to-reward opportunity for medium-term investors. ✅
🧱 The Key Structural Boundaries
📍 Preferred Entry Zone, 83.50 EGP.
The Fibonacci 61.8% retracement represents the preferred accumulation area.
⚠️ Current Outlook.
The correction appears incomplete while momentum indicators remain overheated.
🎯 Long-Term Target, 245.00 EGP.
The primary medium-term objective if the long-term bullish trend resumes.
🛑 Stop Loss, 66.00 EGP.
A confirmed close below this level invalidates the current bullish structure.
🎯 The Verdict:
AMES remains one of the stronger healthcare names on the EGX with improving operational performance and strong institutional backing. 🏥
The recent correction should be viewed as a healthy reset following a parabolic rally rather than a deterioration in fundamentals. 📈
Patience is warranted, as waiting for the Fibonacci 61.8% retracement around 83.50 EGP provides a significantly more attractive entry than chasing the current price. 🎯
Maintain disciplined risk management with a stop loss below 66.00 EGP. 🛡️
---
If you like my insights, follow and boost! 🙌💙🚀
🎁 $15 TradingView Discount:
www.tradingview.com ✨💸🤑
MOED: Strong Selling Pressure Keeps the Downtrend in Control📊 MOED: Strong Selling Pressure Keeps the Downtrend in Control ⚠️
🏛️ Fundamental Review:
📊 Business Quality:
MOED is a private K-12 education provider operating the Third Millennium Language Schools in Egypt. The company benefits from the defensive nature of the education sector but remains a small-cap, high-beta stock driven primarily by retail participation. 🏫
✅ Strengths & Catalysts:
The company has returned to profitability after reporting positive operating earnings during recent reporting periods. 📈
Demand for private education remains resilient due to stable student enrollment and annual tuition growth. 🎓
MOED continues to attract active retail trading, making it suitable for momentum-oriented traders. 💹
⚠️ Risks:
The company has a highly diluted capital structure with more than one billion outstanding shares, limiting earnings per share growth. ⚠️
Margins remain vulnerable to inflation, higher staff costs, and maintenance expenses. 📉
Government regulations continue to limit tuition fee increases, restricting pricing flexibility. 🚧
🕌 Sharia Compliance:
🟡 MOED operates a Sharia-permissible business within the education sector. However, sufficient public financial data is currently unavailable to conclusively verify compliance with the latest EGX33 Sharia financial screening criteria. ☪️
💰 Valuation:
The stock trades as a speculative penny stock where technical momentum currently has a greater influence than fundamental valuation. 💎
🔍 The Pulse:
Last week's heavy selling pressure confirmed the continuation of the existing downtrend. 📉
The technical structure remains weak, and I do not currently see any meaningful bullish signals. ⚠️
Investors already holding the stock should closely monitor the major support level at 0.728 EGP. 📍
A confirmed break below 0.728 EGP should be treated as an exit signal for the entire position. 🛑
If the stock experiences any temporary rebound before that happens, I would use the strength to reduce exposure rather than increase positions. 📊
The technical outlook will only improve after a confirmed breakout above the major order block around 0.835 EGP. 🚀
Until that level is reclaimed, the downtrend remains in control. 📉
🧱 The Key Structural Boundaries
⚠️ Main Support, 0.728 EGP.
A confirmed break below this level confirms further downside.
📍 Partial Exit Zone.
Use any technical rebound to reduce exposure while the stock remains below resistance.
🚀 Breakout Trigger, 0.835 EGP.
A confirmed close above the major order block would be the first meaningful bullish signal.
🎯 Trend Confirmation.
Only a sustained move above 0.835 EGP would shift the outlook from bearish to neutral or bullish.
🛑 Stop Loss, 0.728 EGP.
A confirmed close below this support level should trigger a full exit.
🎯 The Verdict:
MOED remains under technical pressure despite operating in a defensive sector. ⚠️
The current chart favors capital preservation rather than aggressive buying. 🛡️
Wait for a confirmed breakout above 0.835 EGP before considering new positions. 🚀
Until then, any rallies should be viewed as opportunities to reduce exposure rather than chase momentum. 📉
---
If you like my insights, follow and boost! 🙌💙🚀
🎁 $15 TradingView Discount:
www.tradingview.com ✨💸🤑
 Short
Short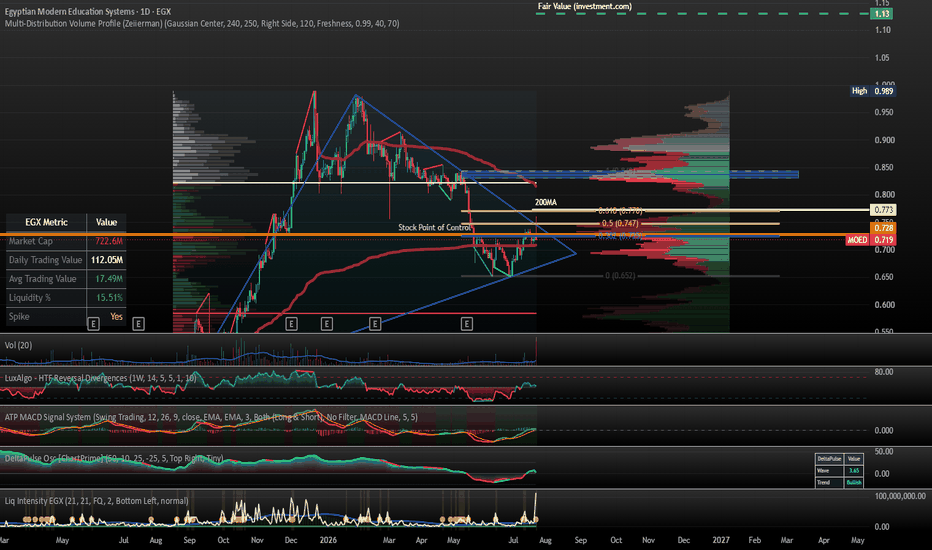
 Long
Long
SDTI: Confirmed Breakout Signals More Upside Ahead📊 SDTI: Confirmed Breakout Signals More Upside Ahead 🚀
🏛️ Fundamental Review:
📊 Business Quality:
SDTI is a leading tourism and hospitality company with premium resort assets in Sharm El Sheikh, generating significant foreign currency revenues through hotels, leisure facilities, and tourism services. 🏨
✅ Strengths & Catalysts:
The company delivered an exceptional turnaround in FY2025, with net profit surging more than 380% as tourism activity recovered strongly. 📈
⚠️ Risks:
Financial performance remains seasonal and highly dependent on tourism demand and regional geopolitical stability. ⚠️
The company also carries relatively high leverage, making financing costs an important risk factor. 📉
🔍 The Pulse:
SDTI is a relatively low-liquidity stock, so position sizing is especially important despite the positive technical outlook. 📊
The stock confirmed yesterday's breakout with a second consecutive strong session today, improving the probability of a sustained bullish move. 🚀
An attractive entry would be on any healthy pullback toward the 49.60 EGP breakout area or on a momentum entry before the price crosses 51.00 EGP. 📍
A confirmed close above 51.93 EGP would open the door to the next upside targets. ✅
Because of the stock's limited liquidity, avoid allocating a large percentage of your portfolio even if the technical setup remains positive. 🛡️
🧱 The Key Structural Boundaries
📍 Entry Zone, 49.60 EGP.
A successful retest of the breakout level could provide an attractive buying opportunity.
🚀 Momentum Trigger, 51.00 EGP.
A move through this level strengthens the bullish momentum.
✅ Breakout Confirmation, 51.93 EGP.
A confirmed close above this resistance signals the next bullish leg.
🎯 First Target, 53.44 EGP.
The next technical resistance.
🎯 Second Target, 55.87 EGP.
The next Fibonacci objective.
🎯 Final Target, 58.44 EGP.
The longer-term upside target if momentum remains strong.
🛑 Stop Loss, 48.00 EGP.
A confirmed close below this level invalidates the current bullish setup.
🎯 The Verdict:
SDTI has confirmed a bullish breakout supported by improving technical momentum. 🏆
The tourism sector remains one of the strongest themes on the EGX, supporting the medium-term outlook. 🌍
Buying either on a pullback toward 49.60 EGP or after further confirmation above 51.93 EGP offers the most favorable risk-to-reward setup. 🤝
Due to the stock's relatively low liquidity, position sizing should remain conservative even if the bullish scenario plays out. 🛡️
---
If you like my insights, follow and boost! 🙌💙🚀
🎁 $15 TradingView Discount:
www.tradingview.com ✨💸🤑
 Long
Long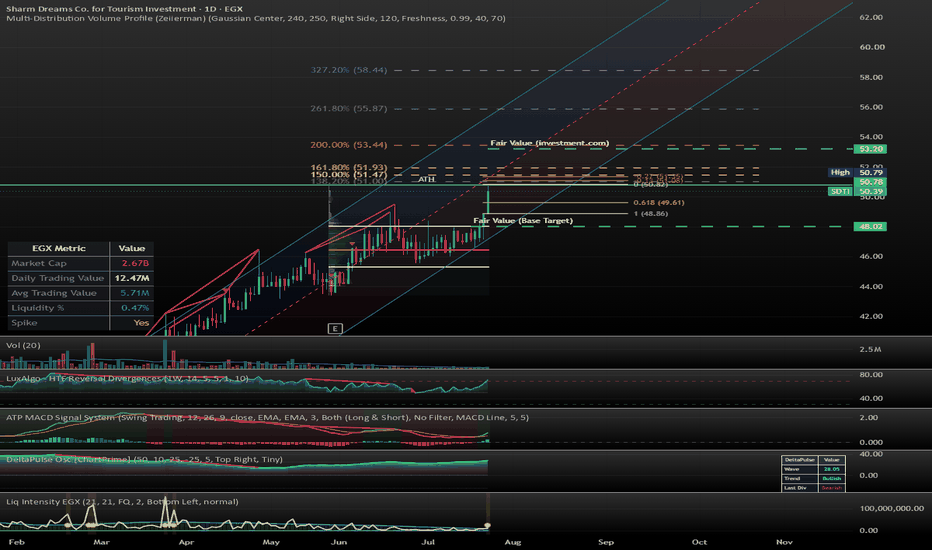
ACGC: Strong ATH Breakout Opens the Door to Higher Targets📊 ACGC: Strong ATH Breakout Opens the Door to Higher Targets 🚀
🏛️ Fundamental Review:
📊 Business Quality:
ACGC is one of Egypt's leading agricultural processing companies, operating across cotton ginning, textile manufacturing, vegetable oil extraction, and agricultural commodity trading. 🌾
✅ Strengths & Catalysts:
The company generates more than 2.6B EGP in annual revenue while maintaining a strong asset-backed balance sheet with equity exceeding 3.3B EGP. 📈
Its attractive valuation, deep institutional ownership, and strategic position within Egypt's agricultural supply chain provide solid long-term support. 💪
⚠️ Risks:
Profitability remains cyclical and sensitive to cotton prices, seasonal harvests, and working capital requirements. ⚠️
Higher financing costs and commodity price volatility could pressure future margins. 📉
🔍 The Pulse:
Today's session delivered a major technical breakout as ACGC cleared its strongest historical resistance and printed a new all-time high. 🚀
The breakout was supported by exceptionally strong liquidity of approximately 150M EGP, adding credibility to the move. 📊
As long as the price remains above 10.40 EGP, the bullish structure remains intact. 💪
Any healthy retest of the 10.40 EGP breakout level could provide an attractive entry opportunity for traders who missed today's move. 📍
The next upside objectives are 12.40 EGP followed by 14.00 EGP if momentum continues. 🎯
🧱 The Key Structural Boundaries
📍 Entry Zone, 10.40 EGP.
A successful retest of the breakout level could offer an attractive buying opportunity.
🚀 Breakout Confirmation, 10.40 EGP.
Holding above this level keeps the new bullish trend intact.
🎯 First Target, 12.40 EGP.
The next major technical resistance.
🎯 Second Target, 14.00 EGP.
The next Fibonacci extension and long-term momentum objective.
⚠️ First Warning, 9.68 EGP.
A confirmed close below the 61.8% Fibonacci level weakens the current bullish structure.
🛑 Stop Loss.
A confirmed close below the lower band of the rising trend channel, or below 9.68 EGP, invalidates the bullish setup.
🎯 The Verdict:
ACGC has delivered one of its strongest technical signals by breaking its major resistance and recording a new all-time high. 🏆
The breakout is supported by exceptional trading liquidity, increasing the probability of further upside. 📈
As long as the stock holds above 10.40 EGP, buying pullbacks remains the preferred strategy. 🤝
Risk remains well defined with a stop below the lower trend channel or the 61.8% Fibonacci level at 9.68 EGP. 🛡️
---
If you like my insights, follow and boost! 🙌💙🚀
🎁 $15 TradingView Discount:
www.tradingview.com ✨💸🤑
 Long
Long
 Short
Short
AMIA: New ATH, Weak Liquidity, and Bearish Divergence Caution📊 AMIA: Strong Fundamentals, But Momentum Suggests a Healthy Pullback First ⚖️
🏛️ Fundamental Review:
📊 Business Quality:
AMIA is one of Egypt's leading investment holding companies, with diversified exposure across financial services, real estate, agriculture, and industrial investments through a portfolio of strategic subsidiaries. 🏢
✅ Strengths & Catalysts:
The company continues to deliver exceptional earnings growth, supported by strong investment gains and high-quality subsidiary performance. 📈
Profitability, revenue growth, operating efficiency, and valuation all remain attractive, making AMIA one of the fundamentally stronger holding companies on the EGX. 💪
Its strategic shareholders control more than 80% of the company, providing long-term stability and institutional confidence. 🏦
⚠️ Risks:
Financial health remains the company's weakest area, with net debt exceeding comfortable levels despite the strong operating performance. ⚠️
Investment income can fluctuate significantly depending on asset sales and market conditions, making quarterly earnings less predictable. 📉
🕌 Sharia Compliance:
❌ Not Sharia-compliant.
Although the company's activities are generally permissible, its leverage exceeds the financial screening thresholds required for EGX33 Sharia compliance. ⚖️
🔍 The Pulse:
AMIA has delivered an impressive rally and recently printed a new all-time high. 🚀
However, today's breakout came on relatively weak liquidity, with around 40M EGP traded compared to nearly 120M EGP during the previous all-time high. 📊
Several momentum indicators are also showing bearish divergence, suggesting that buying momentum is beginning to weaken. ⚠️
I expect a healthy pullback before the stock attempts another bullish leg. 📉
As long as price remains above the key support at 9.31 EGP, the long-term structure remains constructive. 💪
If buyers regain control after the pullback, the next technical objective becomes the Fibonacci extension near 12.86 EGP. 🎯
🧱 The Key Structural Boundaries
📍 Support, 9.31 EGP.
Holding above this level keeps the current bullish structure intact.
🚀 Bullish Continuation.
A successful rebound from support could restart the primary uptrend.
🎯 First Target, 12.86 EGP.
The next major Fibonacci extension and my primary technical target.
⚠️ Warning.
Bearish momentum divergence and declining breakout liquidity increase the probability of a short-term pullback.
🛑 Stop Loss.
A confirmed break below the middle band of the rising trend channel invalidates the current bullish setup.
🎯 The Verdict:
AMIA remains fundamentally one of the stronger investment holding companies on the EGX. 🏆
The main concern is its weak financial health due to elevated net debt. ⚠️
Technically, I believe a healthy pullback is more likely before another advance because momentum is fading while liquidity has weakened. 📉
Patient investors should wait for the pullback to complete before considering new positions. 🤝
---
If you like my insights, follow and boost! 🙌💙🚀
🎁 $15 TradingView Discount:
www.tradingview.com ✨💸🤑
 Short
Short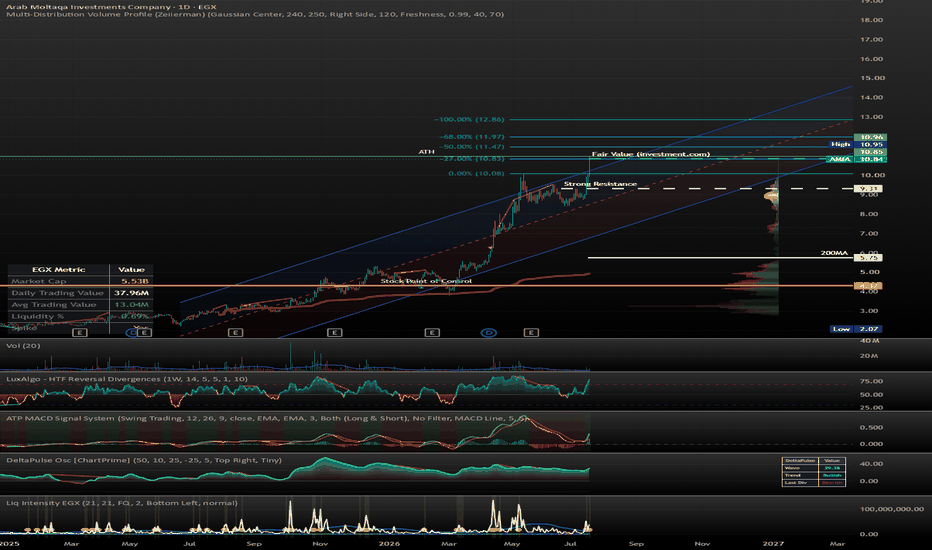
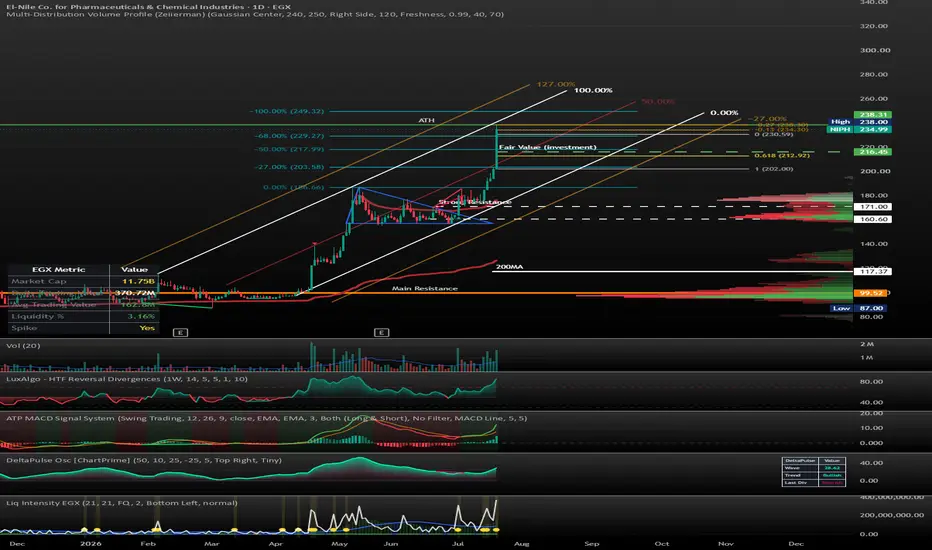
NIPH: Waiting for Confirmation After a Powerful Rally 📊 NIPH: Waiting for Confirmation After a Powerful Rally 🚀
🏛️ Fundamental Review:
📊 Business Quality:
NIPH is one of Egypt's leading state-backed pharmaceutical manufacturers, supplying a wide range of essential medicines and healthcare products to the domestic market. 🏥
✅ Strengths & Catalysts:
The company continues to deliver impressive operational growth, with quarterly revenue increasing 71% YoY and net profit rising 19% YoY. 📈
Its defensive healthcare business, strong demand for essential medicines, and government-backed position provide long-term stability. 💊
The stock also benefits from exceptionally strong retail participation, with trading liquidity reaching nearly 370M EGP during the latest session. 🚀
⚠️ Risks:
Despite strong operational growth, valuation has become stretched after the recent parabolic rally. ⚠️
Financial health also remains a concern due to the company's relatively high leverage and elevated debt-to-equity ratio. 📉
Drug pricing regulations continue to limit the company's ability to fully pass higher production costs to customers. 💰
☪️ Sharia Compliance:
❌ NIPH is currently not considered Sharia-compliant based on its financial leverage, which exceeds the acceptable thresholds commonly applied under AAOIFI and EGX33 Sharia screening methodologies. While its core pharmaceutical business is permissible, its capital structure prevents it from qualifying. ⚖️
💰 Valuation:
Operationally the company remains very strong, but both valuation and financial health appear stretched after the recent rally, reducing the margin of safety for new investors. 💎
🔍 The Pulse:
The stock completed a triangle breakout before entering a healthy consolidation phase. 📊
Following that consolidation, buyers launched a strong parabolic rally that pushed the stock to a new all-time high. 🚀
Both technical indicators and fundamental valuation now suggest that the stock is becoming extended after its impressive advance. 📈
However, the exceptional trading liquidity of around 370M EGP indicates that retail buying momentum remains extremely strong. 💰
A confirmed close above 234.30 EGP would signal that buyers are still in control and could extend the current bullish wave. ✅
A close below 219.20 EGP would be the first warning that momentum is fading and a deeper correction could begin. ⚠️
Until either level is broken, the stock may continue moving sideways while digesting recent gains. ⏳
🧱 The Key Structural Boundaries
🚀 Breakout Trigger, 234.30 EGP.
A confirmed close above this level would confirm continuation of the bullish momentum.
🎯 First Target.
The stock has already exceeded most technical and fundamental targets, making any further advance dependent on sustained liquidity and continued momentum.
⚠️ First Warning, 219.20 EGP.
A close below this level would indicate weakening momentum and increase the probability of a larger pullback.
🛑 Stop Loss, 186.66 EGP.
A close below this level invalidates the current bullish structure.
🎯 The Verdict:
NIPH remains fundamentally strong with excellent revenue and earnings growth. 🏆
However, valuation and financial health are currently the weakest parts of the investment case. 📊
The recent rally has pushed both technical and fundamental indicators into stretched territory. 📈
As long as the stock remains above 219.20 EGP, the bullish structure remains intact. 🤝
A confirmed breakout above 234.30 EGP would provide the next high-probability continuation signal. 🚀
---
If you like my insights, follow and boost! 🙌💙🚀
🎁 $15 TradingView Discount:
www.tradingview.com ✨💸🤑
MCQE: New Highs Required Before the Next Bullish Leg📊 MCQE: Break Above the All-Time High Could Trigger the Next Expansion Wave 🚀
🏛️ Fundamental Review:
📊 Business Quality:
MCQE is one of Egypt's strongest cement producers, benefiting from exceptional earnings growth, strong export demand, and significant institutional ownership. 🏗️
✅ Strengths & Catalysts:
The company continues to deliver outstanding financial performance, with Q1 2026 net profit more than doubling year-over-year while maintaining strong pricing power across its regional markets. 📈
Its attractive valuation, expanding clinker exports, and backing from major institutional investors make it one of the strongest fundamental stories in Egypt's cement sector. 💪
⚠️ Risks:
Despite its excellent fundamentals, the stock remains sensitive to coal prices, energy costs, and transportation expenses. ⚠️
After its strong multi-year rally, the price may experience healthy corrections before resuming its longer-term uptrend. 📉
☪️ Sharia Compliance:
MCQE is compliant with the index's Sharia screening methodology. ✅
💰 Valuation:
The stock continues to trade at an attractive valuation relative to its earnings growth, making it one of the stronger long-term industrial opportunities on the EGX. 💎
🔍 The Pulse:
MCQE remains in a strong long-term uptrend, but I am still waiting for a confirmed breakout above the all-time high before becoming more aggressive. 📈
A confirmed close above the previous all-time high would signal the start of the next bullish expansion wave. 🚀
Failure to break the upper boundary of the long-term rising channel could trigger another healthy correction toward the middle or even the lower channel support. 📉
The Order Block around 160 EGP remains one of the strongest demand zones on the chart and should attract buyers if tested. 🛡️
Until the breakout is confirmed, patience remains the best strategy. ⏳
🧱 The Key Structural Boundaries
🚀 Breakout Trigger, Above the All-Time High.
A confirmed close above the previous all-time high signals the beginning of a new bullish leg.
🎯 First Target, 280.00 EGP.
The projected technical expansion target following the breakout.
📍 Major Support, 160.00 EGP.
A strong Order Block where buyers are expected to defend the trend.
⚠️ First Warning, Middle Trend Channel.
A rejection from the upper channel could lead to a healthy pullback toward this support.
🛑 Stop Loss, Below the 200-day Moving Average.
A confirmed close below the 200-day Moving Average invalidates the bullish structure.
🎯 The Verdict:
MCQE remains one of the strongest fundamentally driven industrial stocks on the EGX. 🏆
The technical structure remains bullish, but confirmation above the all-time high is still required before considering new positions. 📈
A successful breakout could open the door toward the 280 EGP target, while any pullback toward the Order Block may provide a better risk-reward opportunity. 🤝
Patience is key until the market confirms the next expansion phase. 🛡️
---
If you like my insights, follow and boost! 🙌💙🚀
🎁 $15 TradingView Discount:
www.tradingview.com ✨💸🤑
ARCC: Uptrend Remains Intact Despite the Healthy Pullback📊 ARCC: Long-Term Uptrend Remains Intact Despite the Healthy Pullback 🏗️
🏛️ Fundamental Review:
📊 Business Quality:
ARCC (Arabian Cement Company) is one of Egypt's highest-quality cement producers, supported by strong operational efficiency, healthy export exposure, and a leading position in the domestic construction materials sector. 🏭
☪️ Sharia Compliance:
ARCC is considered Sharia-compliant and is a constituent of the EGX33 Shariah Index, indicating it satisfies both business activity and financial ratio screening requirements. ✅
✅ Strengths & Catalysts:
The company continues to deliver exceptional earnings growth, with FY2025 net profit reaching record levels and Q1 2026 profit growing nearly 60% year-over-year. 📈
Its generous dividend policy provides one of the highest cash yields on the EGX, making it attractive for both growth and income investors. 💰
Growing export revenues and continued investment in renewable energy improve long-term profitability and reduce operating costs. 🌍
⚠️ Risks:
The cement industry remains exposed to energy costs, imported fuel prices, and transportation expenses. ⚠️
Domestic production quotas and intense industry competition may limit future pricing power. 🏗️
🔍 The Pulse:
ARCC remains one of the strongest long-term investment opportunities on the EGX. 🏆
The stock continues to trade inside a well-defined long-term rising channel. 📈
After reaching both the upper boundary of the channel and the Rumble annual target, the stock entered a healthy pullback and has repeatedly found support near the middle of the channel. 📍
This correction does not change the primary bullish trend as long as the channel structure remains intact. 💪
The first major bullish confirmation will come with a breakout above the Rumble annual target and a sustained close above the all-time high around 59.00 EGP for several trading sessions. 🚀
🧱 The Key Structural Boundaries
🚀 Breakout Trigger, 59.00 EGP.
A confirmed breakout above the Rumble annual target and the all-time high, followed by several closes above this level, signals the continuation of the long-term uptrend.
🎯 First Target, 70.00 EGP.
The next major upside objective after the breakout.
🎯 Final Target, 80.00 EGP.
The long-term Fibonacci extension target.
⚠️ First Warning.
A break below the middle line of the long-term rising channel would be the first sign that bullish momentum is weakening.
🛑 Stop Loss.
A confirmed close below the lower boundary of the long-term rising channel invalidates the current bullish structure.
🎯 The Verdict:
ARCC remains one of the highest-quality industrial stocks on the EGX, supported by outstanding fundamentals and a strong dividend profile. 🏆
The current pullback appears to be a normal correction within a healthy long-term uptrend. 📉
A confirmed breakout above 59.00 EGP would likely open the door toward 70.00 EGP, followed by the long-term target near 80.00 EGP. 🚀
Until then, monitoring the integrity of the long-term channel remains the key technical factor. 🛡️
---
If you like my insights, follow and boost! 🙌💙🚀
🎁 $15 TradingView Discount:
www.tradingview.com ✨💸🤑
 Long
Long
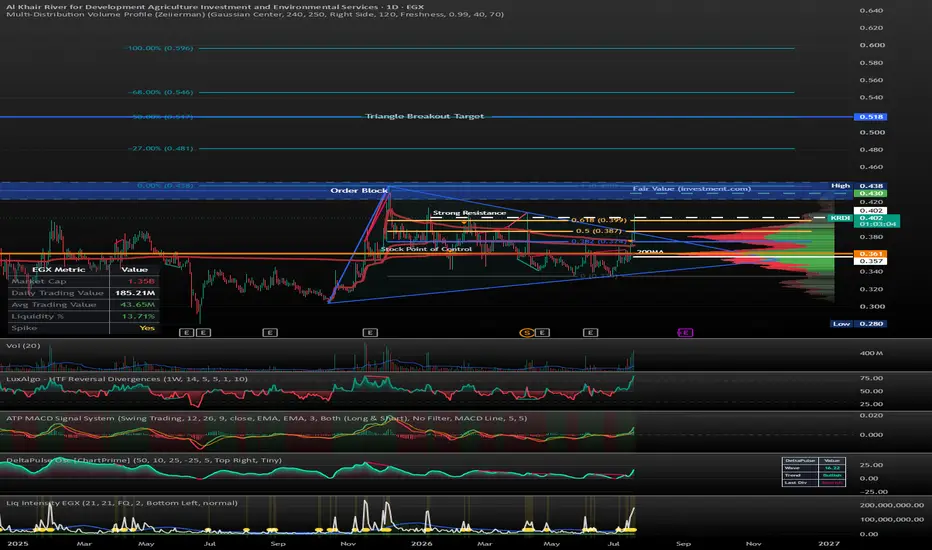
KRDI: Stay Patient Until the Major Resistance Cluster Is Cleared📊 KRDI: Stay Patient Until the Major Resistance Cluster Is Cleared ⏳
⚠️ Risks:
Fundamentals remain weak and do not currently justify aggressive long-term positioning. ⚠️
KRDI has a long history of trapping investors inside prolonged consolidations after momentum rallies. 📉
Retail-driven moves can quickly fade if liquidity fails to continue expanding. 🚨
🔍 The Pulse:
Despite today's positive breakout, I remain cautious on KRDI. 📊
Although retail momentum has improved, the stock is still trading below a major resistance cluster that combines the Order Block, Fair Value, and the 52-week high around 0.43 EGP. 🚧
This area represents the true technical barrier that must be cleared before I become bullish. 📈
KRDI has historically trapped shareholders for months after similar rallies, so I prefer waiting for confirmation rather than chasing early momentum. ⏳
If the stock successfully closes above this resistance cluster, the probability of a sustained trend improves significantly. ✅
🧱 The Key Structural Boundaries
🚀 Breakout Trigger, 0.43 EGP.
A confirmed close above the Order Block, Fair Value, and 52-week high would complete the bullish breakout.
🎯 First Target, 0.518 EGP.
The measured target from the triangle breakout.
🎯 Final Target, 0.596 EGP.
The next major technical objective if momentum continues.
⚠️ Current Resistance Cluster, 0.43 EGP.
This remains the most important level on the chart and must be cleared before considering new positions.
🎯 The Verdict:
I remain bearish to neutral despite today's positive price action. ⚠️
The recent retail momentum is encouraging, but it is still not enough to overcome KRDI's history of prolonged investor traps. 📉
Waiting for a confirmed breakout above 0.43 EGP still leaves more than 35% potential upside while significantly reducing the probability of a false breakout. 🤝
Patience is the best strategy here—protect your capital and wait for confirmation before committing new money. 🛡️
---
If you like my insights, follow and boost! 🙌💙🚀
🎁 $15 TradingView Discount:
www.tradingview.com ✨💸🤑
SCFM: Momentum Returns as Prepares to Challenge It Previous High📊 SCFM: Momentum Returns as the Stock Prepares to Challenge Its Previous High 🚀
🏛️ Fundamental Review:
📊 Business Quality:
SCFM (South Cairo & Giza Mills & Bakeries) is one of Egypt's strategic grain milling and food processing companies, playing an important role in the country's food security through flour, grain, pasta, and bakery production. 🌾
✅ Strengths & Catalysts:
The company has completed an impressive turnaround, returning to profitability after years of weak performance. 📈
Revenue growth continues to improve while asset sales have strengthened liquidity and supported operational restructuring. 💪
Its strategic position within Egypt's food supply chain provides stable long-term demand. 🏭
⚠️ Risks:
Profitability remains sensitive to wheat prices, imported raw materials, and government pricing policies. ⚠️
The stock has a relatively limited free float, making price movements more volatile during periods of heavy buying or selling. 📉
Future earnings still depend on maintaining the recent operational turnaround. 📊
💰 Valuation:
SCFM continues to trade at an attractive valuation relative to its improving fundamentals, while the turnaround story remains intact. 💎
🔍 The Pulse:
After successfully reaching my previous target at 314.00 EGP, the stock entered a healthy correction. 📉
The pullback tested both the upper boundary of the former downtrend channel and the 200-day Moving Average around 236.91 EGP before buyers regained control. 📍
The strong momentum candle printed today suggests the bullish trend may be resuming. 🚀
If buying pressure continues and the stock breaks above the previous 314.00 EGP high, I expect a new impulsive wave toward higher technical targets. 📈
The recent correction appears constructive rather than bearish, provided the major support levels continue to hold. 💪
🧱 The Key Structural Boundaries
📍 Major Support, 257.00 EGP.
Holding above this level keeps the current bullish structure intact.
🚀 Breakout Trigger, 314.00 EGP.
A confirmed close above the previous swing high signals the continuation of the uptrend.
🎯 First Target, 350.00 EGP.
A retest of the all-time high area.
🎯 Second Target, 382.00 EGP.
The next Fibonacci extension target.
🎯 Final Target, 450.00 EGP.
The long-term technical objective if momentum remains strong.
🛑 Stop Loss, 257.00 EGP.
A confirmed close below the major support invalidates the current bullish setup.
🎯 The Verdict:
SCFM continues to be one of the strongest turnaround stories within Egypt's food sector. 🏆
The recent correction successfully held above the 200-day Moving Average before buyers returned with strong momentum. 📈
A confirmed breakout above 314.00 EGP would likely open the door toward 350.00 EGP, followed by 382.00 EGP and potentially 450.00 EGP. 🚀
Risk remains well defined with a stop below the major support at 257.00 EGP. 🛡️
---
If you like my insights, follow and boost! 🙌💙🚀
🎁 $15 TradingView Discount:
www.tradingview.com ✨💸🤑
CERA: Strong Liquidity Continues to Drive the Uptrend 📊 CERA: Strong Liquidity Continues to Drive the Uptrend 📈
🏛️ Fundamental Review:
📊 Business Quality:
CERA (Arab Ceramic Co. – Ceramica Remas) is a well-established Egyptian manufacturer of ceramic tiles, porcelain products, and sanitary ware.
The company benefits from long-standing domestic demand and export exposure, making it a cyclical play on Egypt's construction and real estate sectors. 🏗️
☪️ Sharia Compliance:
CERA is considered Sharia-compliant and is a constituent of the EGX33 Shariah Index, indicating it satisfies both business activity and financial ratio screening requirements. ✅
✅ Strengths & Catalysts:
The company maintains a solid revenue base supported by continued demand from the construction sector. 📈
Following its capital restructuring, CERA is positioned to benefit if profit margins recover alongside improving market conditions. 🚀
⚠️ Risks:
Profitability remains under pressure due to higher financing costs and elevated raw material prices. ⚠️
As a small-cap stock, price movements can become volatile during periods of changing market sentiment. 📉
A sustained recovery in earnings is still needed to fully support a longer-term rerating. 📊
💰 Valuation:
Fundamentally, CERA appears reasonably valued, but the investment thesis still depends on improving margins and continued technical strength. 💎
🔍 The Pulse:
Liquidity has recently improved to levels well above the stock's historical average. 📊
Although the trading activity remains below the 250M EGP seen in some of the strongest momentum names, daily turnover has increased significantly compared with its normal 30M EGP average and previous peaks near 80M EGP. 💰
This improvement in liquidity has already pushed the stock from around 1.00 EGP to nearly 1.40 EGP, confirming growing market interest. 📈
As long as buyers remain active, I believe the stock has the potential to retest its previous all-time high before targeting higher extension levels. 🚀
Because the rally has already advanced significantly, risk management becomes especially important when entering at current levels. 🛡️
🧱 The Key Structural Boundaries
📍 Entry Zone.
Current levels remain tradable while the bullish structure stays intact.
🎯 First Target, 1.54 EGP.
A retest of the previous all-time high.
🎯 Second Target, 1.74 EGP.
The next major technical extension target.
🎯 Final Target, 2.15 EGP.
The longer-term Fibonacci projection if momentum continues.
🛑 Stop Loss, 1.34 EGP.
A confirmed close below this level weakens the current bullish structure and invalidates the setup.
🎯 The Verdict:
CERA is showing improving technical momentum supported by stronger-than-normal trading volume. 📈
While the recent liquidity is encouraging, disciplined risk management remains essential due to the stock's small-cap nature. ⚖️
As long as the price remains above 1.34 EGP, the probability favors a continuation toward 1.54 EGP, followed by 1.74 EGP and potentially 2.15 EGP. 🚀
---
If you like my insights, follow and boost! 🙌💙🚀
🎁 $15 TradingView Discount:
www.tradingview.com ✨💸🤑
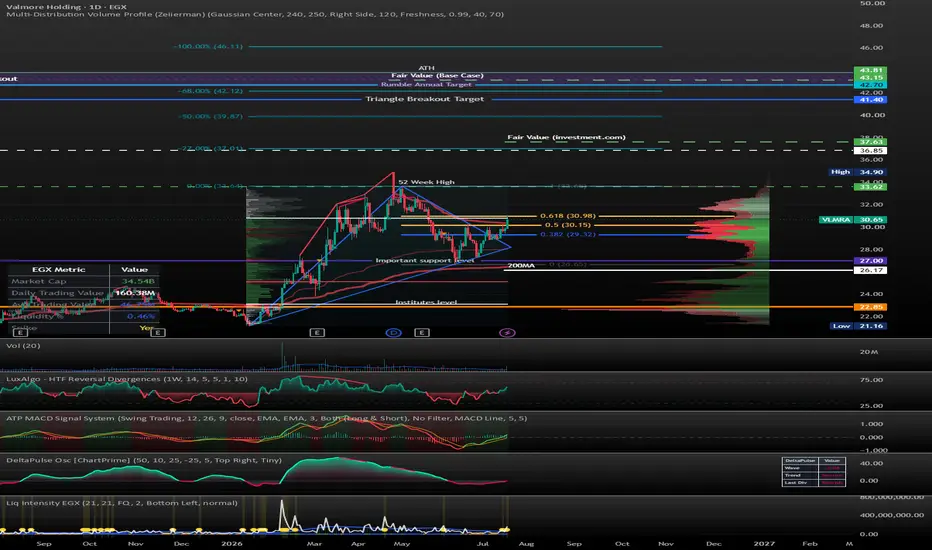
VLMRA: Waiting for the Breakout Before the Next Major Rally 📊 VLMRA: Waiting for the Breakout Before the Next Major Rally 🚀
🏛️ Fundamental Review:
📊 Business Quality:
VLMRA (Valmore Holding) is one of Egypt's strongest diversified investment companies, with exposure to fertilizers, petrochemicals, energy, logistics, insurance, and infrastructure. Its significant USD-denominated revenues provide an effective hedge against local currency depreciation. 🏭
✅ Strengths & Catalysts:
The company generates strong hard-currency cash flows from its export-oriented industrial businesses, providing resilience during periods of currency volatility. 💵
A series of strategic asset sales strengthened the balance sheet while maintaining solid profitability and attractive dividend distributions. 📈
Its diversified business model reduces dependence on a single sector and provides multiple long-term growth drivers. 🚀
⚠️ Risks:
Earnings remain sensitive to global fertilizer, petrochemical, and energy prices. ⚠️
Regional geopolitical developments and export logistics may temporarily affect some operating subsidiaries. 🌍
💰 Valuation:
VLMRA remains one of the strongest long-term value and income opportunities on the EGX, supported by solid fundamentals and an attractive dividend profile. 💎
🔍 The Pulse:
VLMRA remains one of the strongest fundamentally driven stocks on the EGX. 💪
I have been waiting for a confirmed breakout for quite some time, but I do not consider the breakout complete yet. ⏳
The key confirmation will be a weekly close above the 61.8% Fibonacci resistance level, supported by strong trading volume. ✅
Without that confirmation, I prefer to remain patient rather than chase the price. 🤝
Once the breakout is confirmed, the stock could begin a new bullish wave toward higher Fibonacci extension targets. 🚀
🧱 The Key Structural Boundaries
🚀 Breakout Trigger.
A weekly close above the 61.8% Fibonacci resistance with strong volume confirms the next bullish leg.
🎯 First Target, 33.62 EGP.
The first major upside objective following the breakout.
🎯 Second Target, 36.85 EGP.
The next Fibonacci extension target.
🎯 Final Target, 42.00–43.50 EGP.
The long-term resistance cluster and primary technical objective.
⚠️ Main Support, 27.00 EGP.
Holding above this level keeps the long-term bullish structure intact.
🛑 Stop Loss, 27.00 EGP.
A confirmed close below the major support invalidates the current setup.
🎯 The Verdict:
VLMRA remains one of the strongest long-term investment opportunities on the EGX. 🏆
The fundamentals continue to support higher prices, but the technical breakout has not yet been confirmed. 📊
I prefer waiting for a strong weekly close above the 61.8% Fibonacci level with high trading volume before entering new positions. 🤝
Patience here improves the probability of participating in a sustained bullish move rather than a false breakout. 🛡️
---
If you like my insights, follow and boost! 🙌💙🚀
🎁 $15 TradingView Discount:
www.tradingview.com ✨💸🤑
 Long
Long
SCEM: Breakout Confirmed as the Uptrend Resumes 📊 SCEM: Breakout Confirmed as the Uptrend Resumes 🚀
🏛️ Fundamental Review:
📊 Business Quality:
SCEM is one of Egypt's leading cement manufacturers and a major player in the domestic construction materials sector. Backed by the international Vicat Group, the company has transformed into one of the strongest turnaround stories on the EGX. 🏗️
✅ Strengths & Catalysts:
The company has delivered exceptional financial results, with revenue growing more than 41% in FY2025 and Q1 2026 net profit exceeding 1.1B EGP. 📈
A major balance sheet restructuring eliminated legacy financial pressure, leaving the company in a much stronger financial position. 💪
Strong profitability, expanding margins, and continued demand from infrastructure projects support the long-term investment case. 🏗️
⚠️ Risks:
Cement producers remain exposed to fluctuations in fuel and electricity costs, which directly impact production margins. ⚠️
Operations are also sensitive to construction activity and government infrastructure spending cycles. 🌍
💰 Valuation:
Despite the recent rally, SCEM still appears reasonably valued relative to its earnings growth and operational turnaround, making it one of the stronger industrial names on the EGX. 💎
🔍 The Pulse:
SCEM has been one of my favorite breakout candidates since May. 👀
Last week, the stock successfully broke above its triangle pattern. 📈
This week's trading confirmed that breakout with continued buying pressure, strengthening the bullish technical structure. ✅
As long as the price remains above the major support at 67.00 EGP, the bullish trend remains intact. 💪
The breakout opens the door for a retest of the previous all-time high before targeting higher Fibonacci extension levels. 🚀
🧱 The Key Structural Boundaries
📍 Support Level, 67.00 EGP.
Holding above this level keeps the bullish breakout valid.
🎯 First Target, 75.00 EGP.
A retest of the previous all-time high.
🎯 Second Target, 81.77 EGP.
The next major Fibonacci extension target.
🎯 Final Target, 91.30 EGP.
The long-term technical projection if momentum continues.
🛑 Stop Loss, 65.00 EGP.
A confirmed close below the order block around 65.00 EGP invalidates the current bullish setup.
🎯 The Verdict:
SCEM remains one of the strongest industrial turnaround stories on the EGX. 🏆
Both the fundamentals and technical picture are now aligned after the confirmed triangle breakout. 📈
As long as the stock holds above 67.00 EGP, the probability favors continuation toward 75.00 EGP, followed by 81.77 EGP and potentially 91.30 EGP. 🚀
Risk remains well defined with a stop below the order block near 65.00 EGP. 🛡️
---
If you like my insights, follow and boost! 🙌💙🚀
🎁 $15 TradingView Discount:
www.tradingview.com ✨💸🤑
 Long
Long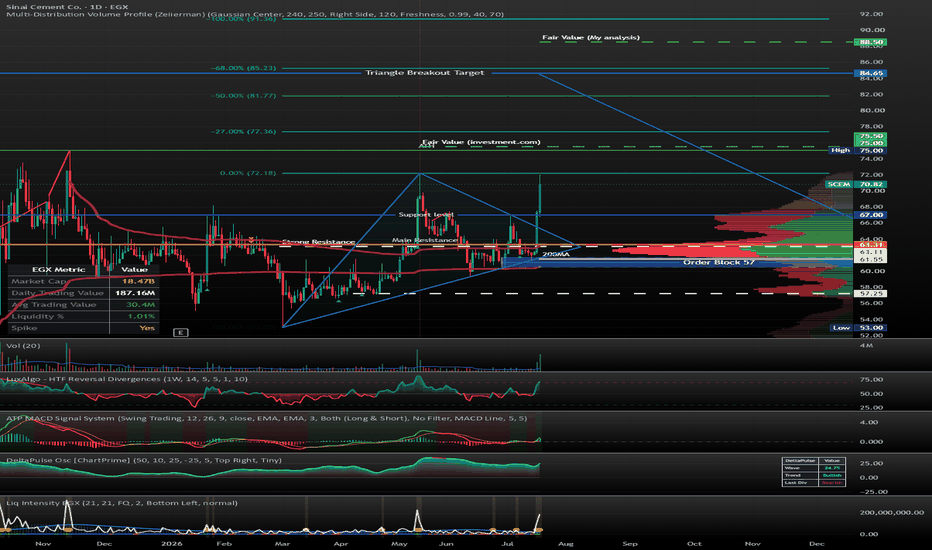
GTWL: Deep Pullback Could Create the Next High-Reward Setup📊 GTWL: Deep Pullback Could Create the Next High-Reward Setup 🎯
🏛️ Fundamental Review:
📊 Business Quality:
GTWL is one of Egypt's leading premium textile manufacturers, specializing in worsted wool fabrics and high-quality formal apparel with a growing export footprint. 🏭
☪️ Sharia Compliance:
GTWL is NOT Sharia-compliant according to the EGX33 Shariah screening methodology due to its elevated leverage, despite operating in a permissible business activity. ❌
✅ Strengths & Catalysts:
Its specialized manufacturing capabilities and export exposure provide a natural hedge against local currency weakness. 🌍
Management continues to benefit from strong pricing power in premium textile products. 💪
⚠️ Risks:
The company carries relatively high financial leverage, making it more sensitive to elevated interest rates. ⚠️
Raw material prices remain exposed to fluctuations in global wool and commodity markets. 🌐
💰 Valuation:
GTWL trades around my estimated fair value, while the current technical structure remains weak after the recent correction. I prefer waiting for stronger technical confirmation before considering larger positions. ⚖️
🔍 The Pulse:
Although GTWL is not Sharia-compliant, it remains on my watchlist because daily liquidity expanded dramatically to nearly 250M EGP, far above its historical average. 👀
The recent surge in liquidity was accompanied by aggressive selling pressure, suggesting institutions are distributing positions rather than accumulating. 📉
The stock has entered a corrective phase and is currently trading around my calculated fair value without any confirmed bullish technical signals. ⚠️
I expect one of two attractive scenarios before considering an entry. 🎯
The first scenario is a healthy pullback toward the 50% Fibonacci retracement around 82.00 EGP, where buyers may step in. 📍
The second, and stronger, scenario would be a deeper decline toward the unmitigated Fair Value Gap around 70.00 EGP, where I expect a stronger technical reaction. 🚀
Until one of these areas is tested and buyers regain control, I prefer to stay patient. 🤝
🧱 The Key Structural Boundaries
📍 First Entry Zone, 82.00 EGP.
The 50% Fibonacci retracement could provide the first attractive swing-trading opportunity.
📍 Second Entry Zone, 70.00 EGP.
The unmitigated Fair Value Gap represents the stronger high-probability accumulation area.
🛑 Stop Loss, 67.00 EGP.
A confirmed close below the Fair Value Gap invalidates the current trading setup.
🎯 The Verdict:
GTWL remains a fundamentally solid industrial exporter, but it is currently not Sharia-compliant. ❌
The recent liquidity spike appears to reflect distribution rather than accumulation, making patience the better strategy. ⏳
I prefer waiting for a technical reaction from either the 82.00 EGP Fibonacci support or the 70.00 EGP Fair Value Gap before considering a small speculative position. 📊
Risk should remain tightly controlled with a stop below 67.00 EGP. 🛡️
---
If you like my insights, follow and boost! 🙌💙🚀
🎁 $15 TradingView Discount:
www.tradingview.com ✨💸🤑
Macro Group Pharmaceutical (MCRO) - EGX : Overview EGX:MCRO
Multi-Timeframe Analysis: Symmetrical Triangle Breakout & Re-test
Macro Group Pharmaceutical (MCRO) is currently trading at 1.33 EGP, exhibiting a multi-timeframe structural breakout from a high-tight symmetrical consolidation pattern following its parabolic move in late 2025.
1. Macro View: Weekly Timeframe (1W)
Macro Geometry:
On the weekly chart, MCRO completed a long-term rounded bottom base construction (dashed orange curve) throughout 2024 and mid-2025 before launching into an explosive upward rally toward the peak at 1.68 EGP.
Consolidation & Structure:
Since early 2026, price action has been coiling within a multi-month symmetrical triangle/wedge structure. The upper descending trendline (blue) capped upside attempts around 1.50 – 1.68 EGP, while the lower ascending support trendline (red) consistently held dips above 1.15 – 1.20 EGP.
Current Candle Action:
The latest weekly candle printed a strong bullish impulse (+6.40%), closing at 1.33 EGP after breaking above the blue resistance trendline on significant volume (502.31M), confirming buyers are regaining structural control.
Weekly Indicators:
RSI (14): Bouncing strongly off the 50 mid-line to 58.81, reflecting fresh bullish momentum without being overbought.
MACD (12, 26, 9): Histogram bars are shifting back toward green/zero as the downward momentum flattens, hinting at a potential bullish line crossover in upcoming sessions.
2. Micro View: Daily Timeframe (1D)
Breakout & Immediate Pullback:
On the daily timeframe, price decisively broke out of the blue falling resistance line, spiking toward 1.40 EGP before executing a minor pullback to 1.33 EGP (-2.21%). This retracement represents a classic throwback/re-test of the newly broken resistance-turned-support zone (~1.28 – 1.32 EGP).
Key Support Floor:
The ascending red trendline (~1.20 EGP) remains the main structural floor for the pattern.
Daily Indicators:
RSI (14): Elevated at 61.46 above its signal line (54.33), maintaining a firm bullish posture.
MACD (12, 26, 9): A clean bullish crossover is in play with the histogram printing positive green values (+0.015), favoring continuation after the current brief consolidation.
Trading Expectations & Key Levels
___ Scenario A: Bullish Continuation (Primary Target)
Confirmation: Holding above the 1.28 – 1.30 EGP re-test support on the daily chart.
Target 1: 1.42 – 1.45 EGP (Intermediate swing high / supply band).
Target 2: 1.65 – 1.68 EGP (Major 52-week high re-test).
Target 3 (Macro Extension): 1.90 – 2.00 EGP (Full measured move of the triangle pattern).
Stop Loss / Invalidation: Daily close below 1.20 EGP (Breaching the ascending red trendline).
___ Scenario B: Deep Retracement / False Breakout
If price falls back inside the triangle and closes under 1.25 EGP, expect a drift back down to re-test the underlying red trendline around 1.18 – 1.20 EGP before another attempt.
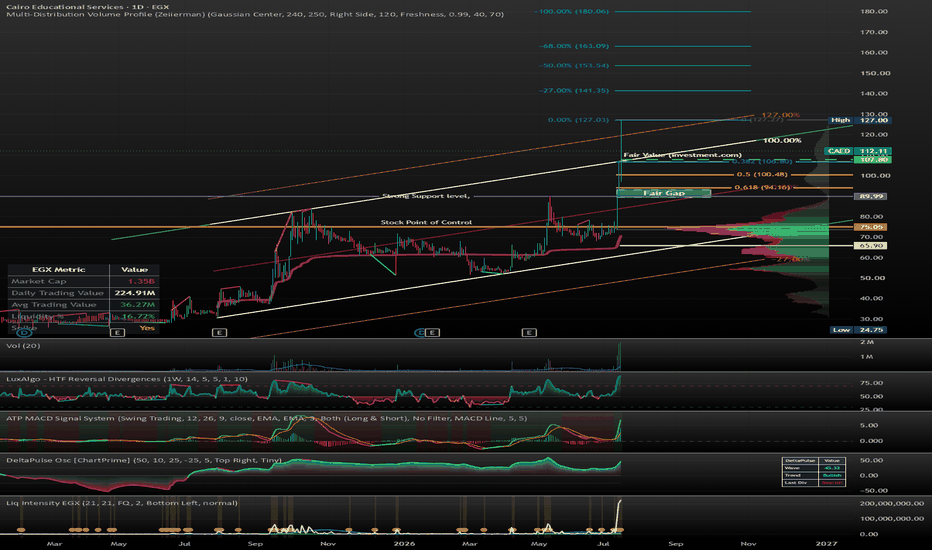
Summary: MCRO has validated a multi-month symmetrical triangle breakout on both the weekly and daily timeframes. As long as price holds above the 1.28 – 1.30 EGP re-test zone, the path of least resistance is up toward 1.45 EGP and 1.68 EGP. CAED: Massive Liquidity Surge Could Fuel Another Bullish Leg 📊 CAED: Massive Liquidity Surge Could Fuel Another Bullish Leg 🚀
🏛️ Fundamental Review:
📊 Business Quality:
CAED is a specialized education company operating private schools under the CIRA Education umbrella, giving it exposure to Egypt's growing demand for high-quality private education. 🏫
✅ Strengths & Catalysts:
The company benefits from strong support and operational synergies with CIRA Education, providing stable business execution and long-term growth potential. 📈
It maintains a healthy balance sheet with more cash than debt while continuing to generate consistent earnings growth and regular cash dividends. 💰
Education remains one of the most defensive sectors in Egypt, supported by structural population growth and rising demand for private education. 🎓
⚠️ Risks:
The stock trades at a very demanding valuation after its explosive rally, making it vulnerable to profit-taking if growth slows. ⚠️
Its low free float can create sharp price swings and high volatility, making position management essential. 📉
The company is not a constituent of the EGX33 Shariah Index, and investors seeking Sharia-compliant investments should perform additional screening before investing. 🕌
💰 Valuation:
Fundamentally, CAED is a quality business, but the current valuation already reflects much of its expected growth. Further upside will depend mainly on continued earnings expansion and technical momentum. 💎
🔍 The Pulse:
CAED experienced the largest liquidity inflow in its trading history, with daily turnover surging from an average of around 36M EGP to approximately 225M EGP. 🚀
Such exceptional liquidity often precedes major price moves and confirms strong institutional interest. 💰
The stock may retest the upper boundary of its long-term rising channel. 📈
A successful rebound from that level could open the door for another bullish expansion. ✅
If the stock closes back below the upper channel boundary, a healthy pullback becomes the more likely scenario. 📉
Any correction that remains above 90 EGP should still be considered technically healthy. 🛡️
Breaking below 90 EGP would increase the probability of revisiting the major support zone around 75 EGP. ⚠️
The upside targets are based purely on Fibonacci extensions and technical momentum rather than fundamental valuation. 📊
🧱 The Key Structural Boundaries
📍 Healthy Pullback Zone, Above 90.00 EGP.
Any correction that holds above this level keeps the bullish structure intact.
🚀 Bullish Continuation Trigger.
A successful rebound from the upper trend channel would confirm buyers remain in control.
🎯 First Target, 127.00 EGP.
The first Fibonacci extension target.
🎯 Second Target, 153.00 EGP.
The next major Fibonacci projection.
🎯 Final Target, 180.00 EGP.
An extended momentum target based entirely on Fibonacci expansion.
⚠️ First Warning, 90.00 EGP.
A close below this level increases the probability of a deeper correction.
🚨 Critical Support, 75.00 EGP.
Losing this support would invalidate the current bullish structure.
🛑 Stop Loss, Below 75.00 EGP.
A confirmed close below the major support level invalidates the setup.
🎯 The Verdict:
CAED remains a fundamentally solid company operating in one of Egypt's strongest defensive sectors. 🏆
The record-breaking liquidity inflow is a very constructive technical signal that deserves close attention. 📈
However, the stock is trading at a rich valuation, so new positions should only be considered if price confirms strength or after a controlled pullback. 🤝
The projected upside targets are driven purely by technical momentum and Fibonacci extensions rather than fundamental fair value. 🛡️
---
If you like my insights, follow and boost! 🙌💙🚀
🎁 $15 TradingView Discount:
🔗 www.tradingview.com ✨💸🤑
 Long
Long