AIDC: Technical Strength vs. Weak FundamentalsAIDC: Technical Strength vs. Weak Fundamentals ⚖️
AIDC remains in a well-defined long-term uptrend, but the current setup presents a conflict between improving technicals and weak underlying fundamentals.
The Fundamentals 📊
AIDC continues to benefit from exposure to Egypt's agricultural and infrastructure development sectors. 🌱
However, the company lacks the earnings quality required for a long-term institutional investment. ⚠️
Margins remain weak and operating profitability has yet to show sustainable growth. 📉
The parent company's financial weakness also weighs on the overall investment case. 🏦
The stock has no meaningful dividend history to support long-term investors. 💰
Overall, the fundamentals point to a higher probability of a deeper correction than continued multiple expansion. 🚨
The Pulse 📈
The stock remains inside a rising channel. 📊
After touching the upper boundary, price entered a healthy correction channel. 🔄
That correction channel was broken to the upside at the end of last week. 🚀
The latest session closed while retesting the breakout, keeping the bullish structure intact. ✅
Technically, the correction appears healthy and the stock is now attempting to reach a new all-time high. 🎯
Despite the bullish chart, I would not initiate a new position because the fundamentals do not support the current valuation. ⏳
I would rather wait for a pullback toward the major order block and support zone around 0.474 before considering an entry. 👀
If you already own the stock, the next upside target is around 0.90. 📈
My stop-loss would be a decisive break below 0.56. 🛑
The Verdict 🎯
The chart is stronger than the business. ⚖️
Momentum traders may continue benefiting while the uptrend remains intact. 📈
Long-term investors should remain patient and wait for a significantly better risk-reward opportunity. ⏳
For me, AIDC remains a watchlist stock until price returns to stronger support or the fundamentals improve. ✅
If you like my insights, follow and boost! 🙌💙🚀 🎁 $15 TradingView Discount: www.tradingview.com ✨💸🤑
 Long
Long
KIMA: Bulls Need One More Confirmation KIMA: Bulls Need One More Confirmation ⚖️
After reaching a 52-week high at 15.37, KIMA experienced a deep correction that erased almost the entire previous bullish wave.
The Fundamentals 📊
KIMA remains one of Egypt's leading fertilizer producers, backed by strong domestic and export demand. 🏭
The Kima 2 expansion continues to strengthen the company's long-term production capacity. 🚀
Management is targeting a recovery in net profit during FY2026/2027, providing a positive long-term catalyst. 📈
However, recent earnings have softened compared to last year. ⚠️
The company's high debt level remains the primary fundamental risk, especially in a high interest rate environment. 💰
Overall, the long-term story remains intact, but the current fundamentals do not justify chasing the stock at this stage. ⏳
The Pulse 📈
The stock is now testing its primary long-term uptrend line. 📊
A break below this trendline would significantly damage the bullish structure. 🚨
Price is also trading just below the key resistance at 12.50. 🎯
A breakout above 12.50 would be the first positive signal, but it would not be enough to confirm a new uptrend. ✅
I would only consider entering after a decisive move above the stronger resistance around 14.00. 💪
That breakout would complete the ABC correction and provide fresh upside targets. 🚀
The first objective would be a retest of the 15.50 area, aligning with both the previous 52-week high and my estimated fair value. 🎯
If the stock fails to reclaim 12.50, the probability of losing the long-term trendline increases. 📉
In that case, the next major support becomes the bullish order block around 11.70, which launched the previous rally. 🛡️
A break below 11.70 would invalidate the bullish thesis and expose the stock to downside targets near 9.50. 🛑
The Verdict 🎯
The long-term fundamentals remain constructive, but the technical structure has not confirmed a new bullish cycle yet. ⚖️
I remain on the sidelines until the stock clears the 14.00 resistance decisively. 👀
Until then, KIMA stays on the watchlist rather than the buy list. 📝
If you like my insights, follow and boost! 🙌💙
🚀 🎁 $15 TradingView Discount:
www.tradingview.com ✨ ISMQ: One More Stretch Before a Healthy Reset? ISMQ: One More Stretch Before a Healthy Reset? ⛏️
ISMQ continues to trade in a powerful long-term uptrend, supported by one of the strongest balance sheets on the EGX.
The company remains debt-free, generates exceptional margins, and occupies a strategic position in Egypt's iron ore supply chain.
However, both the fundamentals and the technical structure are becoming increasingly stretched, suggesting that upside from current levels may be limited.
The Pulse 📈
I see room for one final extension toward 9.70, which aligns with my next major Fibonacci extension target. 🎯
Beyond that level, I don't see any meaningful Fibonacci objectives that justify chasing the rally. ⚠️
The first major support sits around 8.65, which also marks the 38.2% Fibonacci retracement from the recent all-time high. 📊
This level coincides with a strong bullish order block that previously launched the stock to new highs, making it a healthy pullback zone. ✅
If you already own the stock, I would continue holding for one more upside leg. 📈
I would only consider exiting if the price breaks decisively below the 8.65 order block. 🛑
For investors looking to initiate a position, I would avoid buying at current levels and instead wait for a deeper correction toward 7.30, which is my estimated fair value for the stock. 💰
The Verdict 🎯
ISMQ remains one of the strongest fundamental names in the Egyptian basic resources sector, but much of that strength appears to be reflected in the current price.
Existing shareholders can continue riding the trend while respecting the 8.65 support.
New buyers should remain patient and wait for the market to offer a more attractive risk-reward entry closer to fair value.
If you like my insights, follow and boost! 🙌💙🚀 🎁 $15 TradingView Discount: www.tradingview.com ✨💸🤑  Long
Long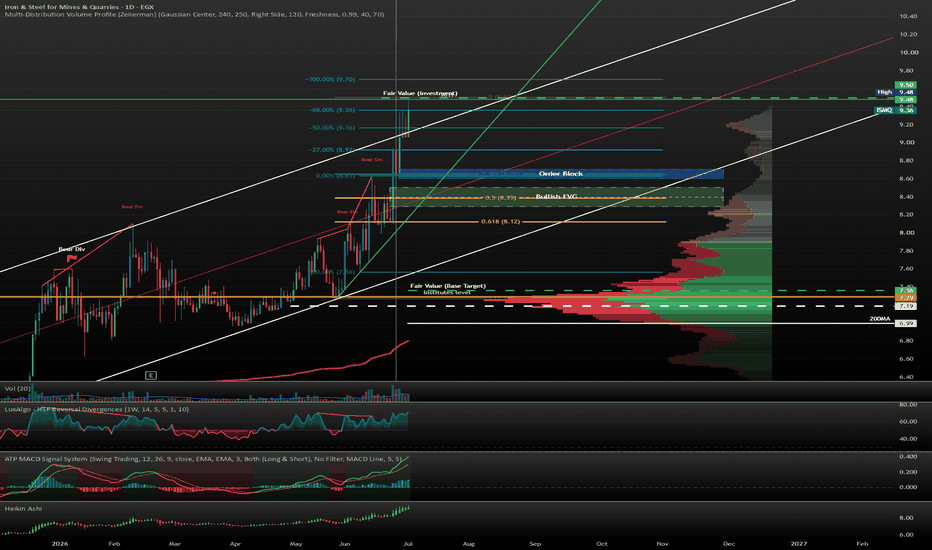
AMES: Retail Momentum Meets Technical Risk AMES: Retail Momentum Meets Technical Risk ⚠️
AMES delivered an explosive parabolic advance to 64, followed by a well-defined descending channel.
After breaking out of the flag pattern, the stock entered a second parabolic rally, extending to 69.5.
The technical picture looks impressive at first glance, but this move appears to be driven primarily by retail momentum rather than improving fundamentals.
With a P/E above 110x, an ultra-thin free float below 4%, and 96% of shares locked by major holders, liquidity remains extremely limited.
That significantly increases execution risk and makes price action less reliable.
The Pulse 📈
The current rally lacks strong fundamental support. ⚠️
I would not recommend initiating a new position at current levels. 🚫
If you already own the stock, watch the gap around **56.0** closely. 👀
A successful gap fill followed by a strong bullish reaction would support holding the position. ✅
If the price loses the 61.8% Fibonacci retracement and breaks below 54.5, that becomes my stop-loss level. 🛑
My base case is for the stock to react before reaching the fair value gap near 57.0. 📊
If that scenario plays out, I would expect a retest of the previous rising trendline, potentially opening the door for another move toward the 70.0 area. 📈
The Verdict 🎯
Despite the recent breakout, I view this as a momentum-driven move rather than a fundamentally supported trend.
The combination of an extreme valuation, limited liquidity, and concentrated ownership keeps the risk profile elevated.
I remain on the sidelines and would only consider the stock again if it establishes a healthier technical structure supported by stronger institutional participation.
If you like my insights, follow and boost! 🙌💙🚀 🎁 $15 TradingView Discount: www.tradingview.com ✨💸🤑
AXPH: Strong Fundamentals, Stretched Technical 📊 AXPH: Strong Fundamentals, Stretched Technical ⚠️
🏛️ Fundamental Review:
📊 Business Quality.
AXPH is a highly profitable pharmaceutical manufacturer with exceptional profitability and a defensive business model. 🏥
✅ Strengths & Catalysts.
A 49.3% ROE, almost debt free balance sheet, and an attractive 5.7% dividend yield make it a premium defensive stock. 🚀
⚠️ Risks.
Very limited share float and slowing quarterly momentum increase volatility and liquidity risk. ⚠️
💰 Valuation.
AXPH is an elite long term value stock, but current prices trade well above my calculated fair value. 💎
🔍 The Pulse:
AXPH confirmed a momentum breakout from a flag pattern. 📈
The rally has pushed the stock into an overbought and stretched technical position. ⚠️
My calculated fair value stands near 980 EGP, well below the current price. 💎
For aggressive investors, I prefer accumulating on a pullback around 1,187 EGP. 🎯
If price fails to break 1,378 EGP next week, a deeper pullback toward 1,156 EGP becomes increasingly likely. 🔄
🧱 The Key Structural Boundaries
🛡️ First Support, 1,156 EGP.
The previous major resistance that should act as support on any correction.
🛡️ Recommended Entry, 1,187 EGP.
My preferred accumulation level for investors willing to accept the risk.
🚀 Breakout Trigger, 1,378 EGP.
A close above this level confirms the next bullish expansion.
💎 Fair Value, 980 EGP.
My calculated fair value for the stock.
🎯 The Verdict:
AXPH remains one of the strongest defensive businesses on the EGX.
The technical picture is bullish, but the stock is significantly stretched.
Avoid chasing the current rally and wait for a healthier entry.
A failure to break 1,378 EGP could trigger a pullback toward 1,156 EGP.
---
If you like my insights, follow and boost! 🙌💙🚀
🎁 $15 TradingView Discount:
🔗 www.tradingview.com ✨💸🤑
PRMH: Wait for Confirmation, Don't Chase 📊 PRMH: Wait for Confirmation, Don't Chase 📈
🏛️ Fundamental Review:
📊 Business Quality.
PRMH is a solid mid tier investment bank with a strong institutional client base and improving fundamentals. 🏦
✅ Strengths & Catalysts.
Low valuation, new institutional fund launches, and rising EGX trading activity support long term growth. 🚀
⚠️ Risks.
Earnings remain highly dependent on capital market activity and the company lacks the scale of the sector leaders. ⚠️
💰 Valuation.
The stock is fundamentally attractive, but the current market price trades well above my fair value estimate. 💎
🔍 The Pulse:
PRMH continues to trade inside a well defined uptrend channel. 📈
Price tested the upper boundary twice before pulling back to the lower boundary and rebounding. 🔄
The rally stalled at the Fibonacci 38.2% level at 2.59 EGP and failed to close above it. ⚠️
The next major resistance sits inside a bullish Fair Value Gap around 2.77 EGP. 🎯
I do not recommend entering before a confirmed close above 2.77 EGP. 🚨
The stock remains overbought, while my calculated fair value stands near 2.20 EGP. 💎
🧱 The Key Structural Boundaries
🛡️ Recommended Entry, 2.08 EGP.
My preferred accumulation level on a healthy pullback.
🚀 Breakout Trigger, 2.77 EGP.
A close above the bullish Fair Value Gap confirms renewed momentum.
🎯 First Target, 3.30 EGP.
The next technical upside objective.
💎 Fair Value, 2.20 EGP.
My calculated fair value for the stock.
🎯 The Verdict
PRMH remains technically bullish inside its long term uptrend.
Avoid chasing the stock at current levels.
If you already hold the stock, consider taking profits if price fails to break 2.80 EGP or reaches 3.30 EGP.
For new positions, I prefer accumulating near 2.08 EGP.
---
If you like my insights, follow and boost! 🙌💙🚀
🎁 $15 TradingView Discount:
🔗 www.tradingview.com ✨💸🤑
 Long
Long
AIH: Retail Momentum Meets Weak Fundamentals 📊 AIH: Retail Momentum Meets Weak Fundamentals ⚠️
🔍 The Pulse:
AIH remains a retail driven momentum stock with very weak fundamentals. 📉
The company continues to post heavy losses, suffers from governance concerns, and lacks meaningful institutional sponsorship. ⚠️
Technically, the stock broke out of a triangle pattern and rallied to the upper boundary of its long term uptrend channel. 📈
The recent pullback found support around the fair value area and the Fibonacci 50% level at 0.43 EGP. 🛡️
Price also managed to close above the Fibonacci 38.2% level at 0.473 EGP, keeping the short term structure intact. 🔄
Despite the technical strength, I do not recommend entering a stock with such weak fundamentals. 🚨
🧱 The Key Structural Boundaries
🛡️ First Support, 0.473 EGP.
The Fibonacci 38.2% level now acts as the first support.
🛡️ Major Support, 0.43 EGP.
The fair value region and the Fibonacci 50% retracement.
🎯 Profit Taking, 0.54 EGP.
The upper trend line remains the primary selling zone.
🔴 Stop Loss, 0.40 EGP.
A break below this level invalidates the bullish structure.
🎯 The Verdict
The technical setup remains driven by retail momentum rather than business quality.
I do not recommend initiating new positions in AIH.
If you already hold the stock, consider taking profits near 0.54 EGP.
A break below 0.40 EGP should be treated as the stop loss.
---
If you like my insights, follow and boost! 🙌💙🚀
🎁 $15 TradingView Discount:
🔗 www.tradingview.com ✨💸🤑
 Short
Short
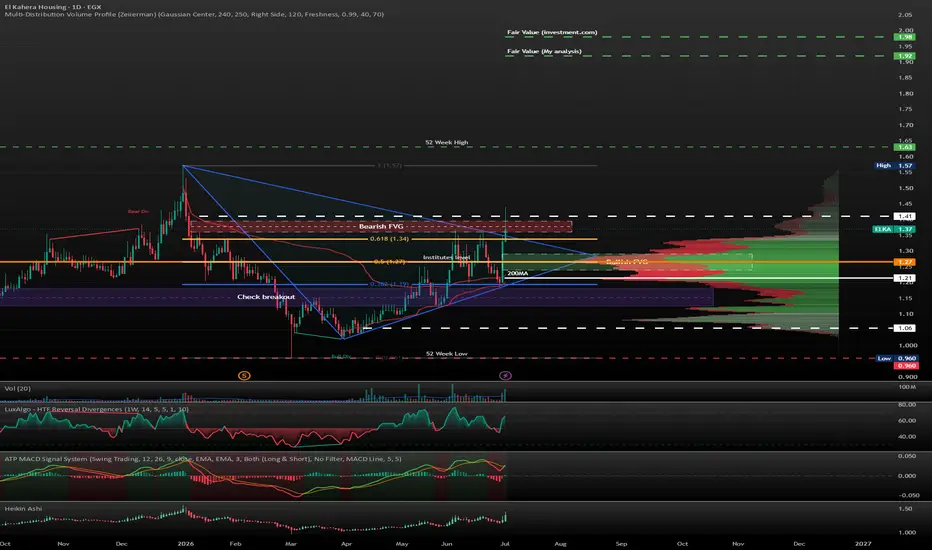
ELKA: Breakout Needs One Final Confirmation 📊 ELKA: Breakout Needs One Final Confirmation ⏳
🔍 The Pulse:
ELKA remains fundamentally weak despite its attractive asset valuation. ⚠️
The stock trades at a deep discount to book value, but inconsistent earnings, delayed financial reporting, and weak institutional sponsorship limit its investment appeal. 📉
Technically, price broke out of the triangle pattern but failed to close above the bearish Fair Value Gap and the major resistance at 1.41 EGP. 📐
A second rejection from 1.41 EGP could trigger a pullback toward the previous breakout level at 1.34 EGP. 🔄
If 1.34 EGP fails to hold, the next destination is the major support at 1.27 EGP. 🛡️
A weekly close above 1.41 EGP would confirm the breakout and shift momentum back to the bulls. 🚀
🧱 The Key Structural Boundaries
🚀 Breakout Trigger, 1.41 EGP.
A close above the bearish Fair Value Gap confirms the breakout.
🛡️ First Support, 1.34 EGP.
The previous resistance now acts as the first support.
🛡️ Major Support, 1.27 EGP.
The stock's primary structural support.
🔴 Stop Loss, Below 1.27 EGP.
A break below this level invalidates the bullish setup.
🎯 First Target, 1.63 EGP.
A retest of the 52 week high.
💎 Fair Value, 1.95 EGP.
My calculated fair value region.
🎯 The Verdict
ELKA remains a speculative value play rather than a quality growth stock.
Wait for a confirmed close above 1.41 EGP before considering an entry.
Failure to reclaim this level increases the probability of a pullback toward 1.34 EGP or 1.27 EGP.
A confirmed breakout opens the path toward 1.63 EGP and the 1.95 EGP fair value region.
---
If you like my insights, follow and boost! 🙌💙🚀
🎁 $15 TradingView Discount:
🔗 www.tradingview.com ✨💸🤑
 Short
Short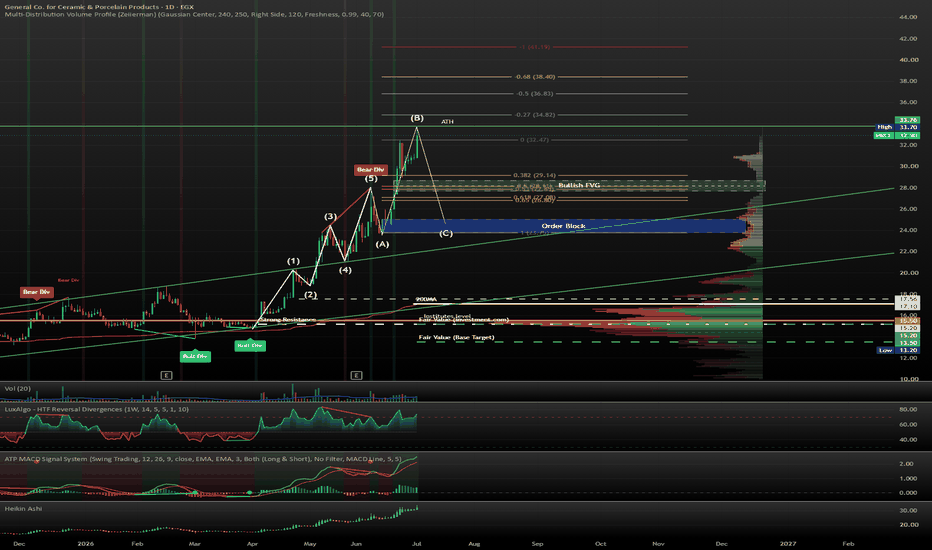
 Long
Long
 Long
Long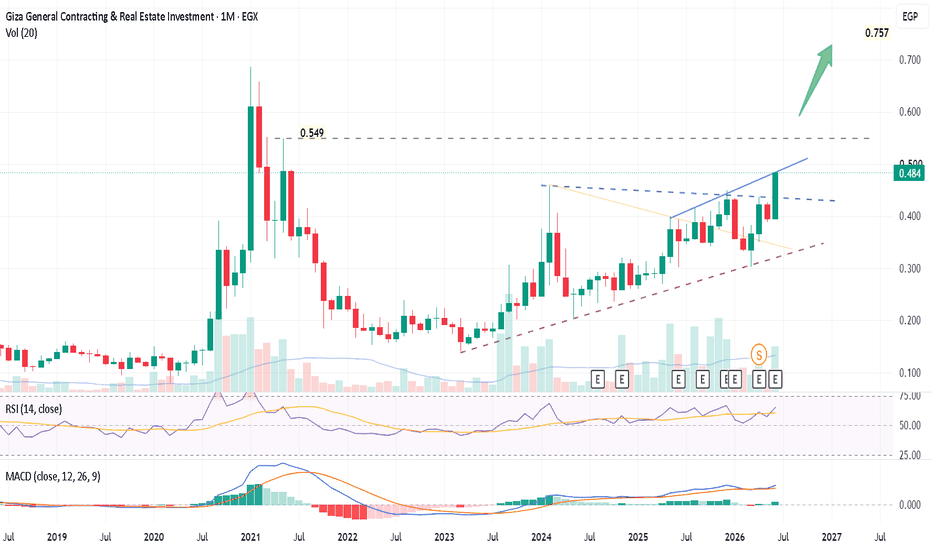
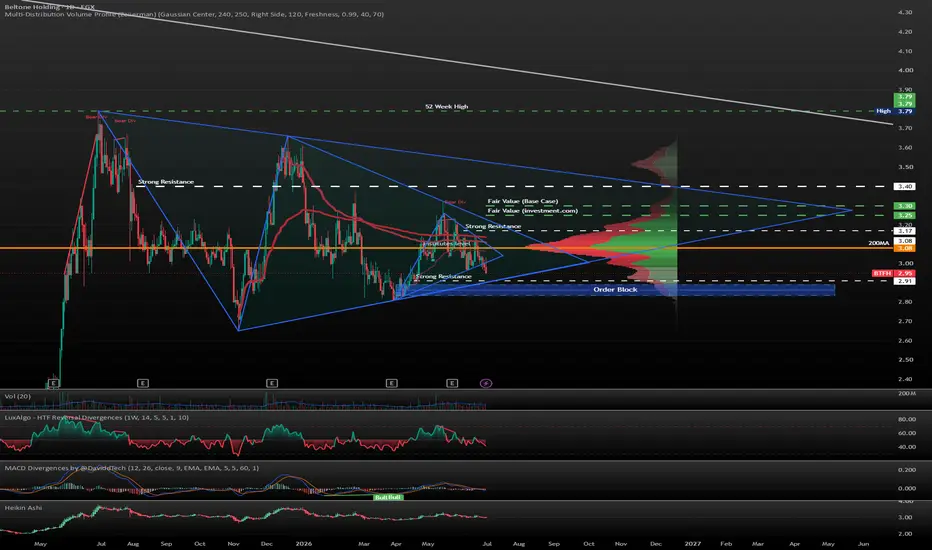
BELTON: Bears Remain Firmly in Control 📊 BELTON: Bears Remain Firmly in Control ⚠️
🔍 The Pulse:
BELTON continues to trade in a well established downtrend that has lasted for nearly a year. 📉
There are still no meaningful signs of a bullish reversal. ⚠️
Three triangle patterns define the short, medium, and long term structure of the stock. 📐
The smallest triangle has already broken to the downside, confirming continued selling pressure. 🔻
The next key support sits at 2.91 EGP, where the medium and long term triangle support lines converge. 🎯
Below that, the 2.83 EGP order block is the final major support before the downtrend could accelerate into a parabolic decline. 🚨
🧱 The Key Structural Boundaries
🛡️ First Support, 2.91 EGP.
The convergence of the medium and long term triangle support lines.
🛡️ Major Support, 2.83 EGP.
The order block that triggered the previous rebound.
🚀 Bullish Confirmation, 3.08 EGP.
A close above the main support and the 200 day moving average is the first positive signal.
🔴 Stop Loss, 2.83 EGP.
A break below the order block invalidates the setup and signals a much stronger bearish trend.
🎯 The Verdict
The technical outlook remains decisively bearish.
Avoid new positions until price reclaims 3.08 EGP.
If you already hold the stock, use a break below 2.83 EGP as your stop loss.
Patience remains the highest probability strategy.
---
If you like my insights, follow and boost! 🙌💙🚀
🎁 $15 TradingView Discount:
🔗 www.tradingview.com ✨💸🤑
 Short
Short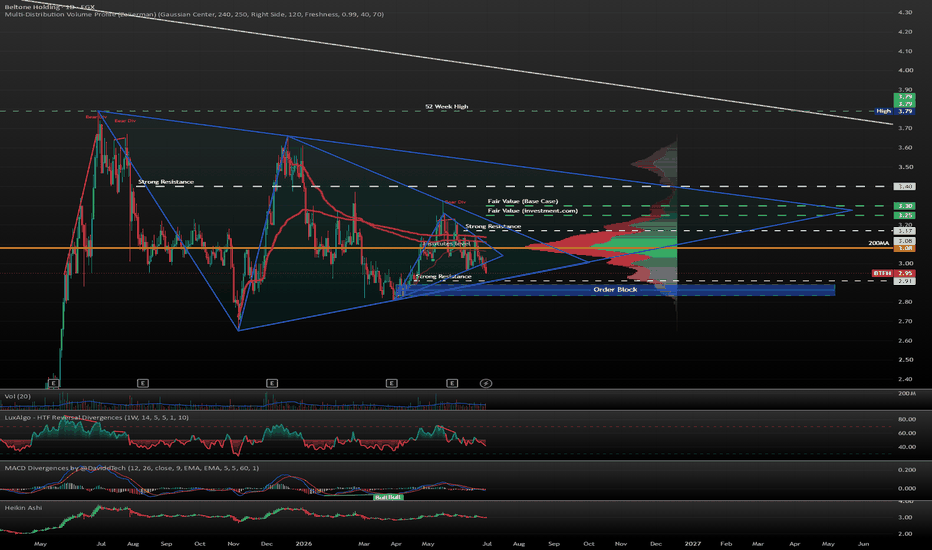
EGAL: Correction Still Has Room to Go 📊 EGAL: Correction Still Has Room to Go ⚠️
🔍 The Pulse:
EGAL completed the fifth Elliott Wave at the all time high and is now trading inside an ABC correction. 📉
At this stage, I believe the market is still developing only the AB portion of the correction. 🔄
Despite today's positive session, global aluminum prices have not recovered enough to support a sustainable reversal. 🌍
For now, the recent strength looks like a technical bounce rather than the start of a new bullish trend. ⚠️
A close above 308 EGP is required to restore a bullish outlook, but I do not expect this in the near term. 🚨
🧱 The Key Structural Boundaries
🛡️ First Support, Lower Uptrend Channel.
This level should contain the current correction and preserve the long term trend.
🛡️ Major Support, 200 Day Moving Average.
A break below this level would signal a change in market character.
🔴 CHoCH Level, 236 EGP.
Watch this level closely, as a break would confirm a transition into a downtrend.
🚀 Bullish Confirmation, 308 EGP.
A close above this resistance is needed before turning constructive.
🎯 The Verdict
The current rebound looks like a temporary pullback within a broader correction.
Monitor the lower channel boundary and the 200 day moving average closely.
A break below 236 EGP would confirm a bearish change of character.
Until price reclaims 308 EGP, caution remains the preferred approach.
---
If you like my insights, follow and boost! 🙌💙🚀
🎁 $15 TradingView Discount:
🔗 www.tradingview.com ✨💸🤑
 Short
Short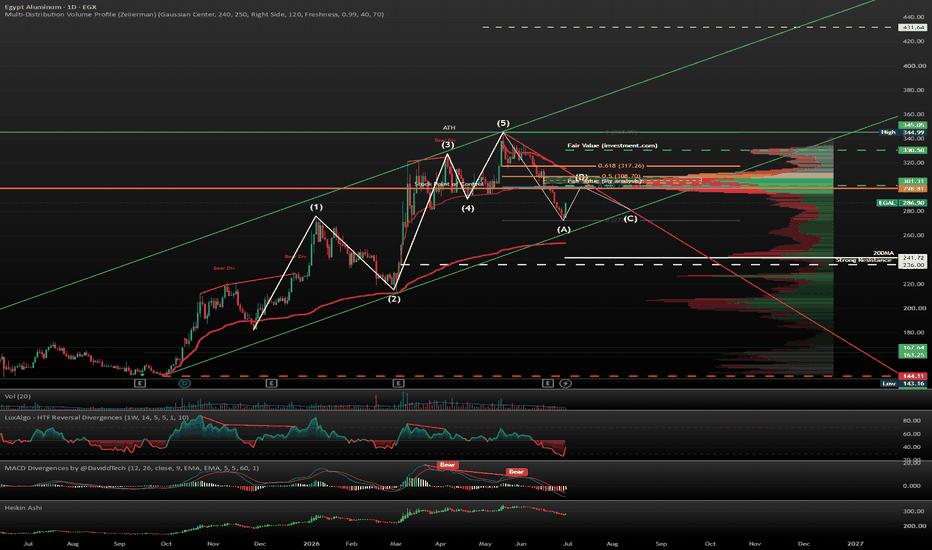
 Long
Long
 Long
Long
 Long
Long
 Long
Long
 Long
Long
 Long
Long