Long
Long
KORRA IPO Analysis, Should You Subscribe? KORRA IPO Analysis, Should You Subscribe? 🤔
📊 TL;DR Snapshot
💰 Offer Price: EGP 2.97
🎯 Advisor Fair Value: EGP 3.20 (~7.2% discount)
📦 Offer Size: 247.5M shares (11% of capital)
🏦 Market Cap @ IPO: ~EGP 6.68B
📈 P/E: ~12x
📚 P/B: ~4.1x
🚀 ROE 2025: ~34%
🎯 My Risk-Adjusted FV: EGP 2.20 – 2.80
My View: 🟡 Cautious / Skip the IPO. Price looks slightly stretched once governance & legal risks are priced in. Better entry post-listing if it dips below EGP 2.50.
🏭 Company Snapshot
Family-owned conglomerate (founded 1997, rebranded 2024). Diversified across:
⚡ Power generation, solar, waste-heat recovery
❄️ HVAC manufacturing (chillers, cooling towers)
🏗️ Class-1 general & electromechanical contracting
🍓 Frozen agri-exports (IQF strawberries)
🛢️ Petroleum & infrastructure
🤝 Partners: Mitsubishi Electric, Siemens, Sidpec
🌍 Branches in KSA & Iraq
📈 Owns 34.54% of Cairo Oil & Soap (EGX-listed)
💹 Financial Highlights (EGP Millions)
Revenue: 4,025 (2023) → 5,752 (2024) → 7,907 (2025)
Growth: +43% (2024) → +37% (2025)
Net Profit: 140 → 306 → 555
Equity: 803 → 1,150 → 1,628
Dividends: 24 → 68 → 96
🔥 Revenue 2x in 2 years, profit nearly 4x.
✅ The Good
🚀 Strong, sustained top-line & bottom-line growth
💎 Excellent 34% ROE
🌐 Sector diversification reduces concentration risk
⚡ Exposure to structural growth themes (renewables, data centers, energy efficiency)
🤝 Tier-1 international partnerships
💰 Growing actual cash dividends
📉 7.2% discount vs. independent advisor's fair value
⚠️ The Bad
👨👩👧 89% remains family-owned post-IPO (founder alone = 75%) → low free float, illiquid
🪑 Founder is both Chairman & CEO, weak governance
🎭 Independent board members hold zero shares, no skin in the game
💳 Heavy reliance on bank debt (explicitly listed as a use of proceeds)
📉 Book value per share dropped 2.74 → 0.72 EGP (multiple splits)
💼 Net margin only ~7%
⚖️ Multiple labor lawsuits & open tax files 2020–2024
🚨 The Fishy (Red Flags!)
🔴 Auditor (Forvis Mazars) resigned days before the prospectus (May 13, 2026).
Classic IPO red flag, reason undisclosed.
⚖️ Major arbitration case vs. Heidelberg Materials (Helwan Cement) at the Cairo Regional Centre for International Commercial Arbitration, no provisions booked, amount undisclosed.
🔄 4 capital increases in a single year (2024) scaling from EGP 225M to 2.25B → looks like pre-IPO dressing.
✂️ Two par-value splits in 2024 (10 → 1 → 0.20 EGP), unusual frequency.
🏢 Pre-IPO merger with Consoukra Real Estate needs scrutiny on valuation.
⏳ IPO postponed twice (Jun 2025 → Dec 2025 → Jun 2026).
🛡️ Price stabilization fund = only 100% of public tranche for 30 days, short window, risk of post-stabilization sell-off.
🕌 Sharia Compliance
Likely NOT compliant (preliminary, not a fatwa):
✅ Core business is halal (energy, manufacturing, agri, contracting)
❌ Heavy reliance on conventional interest-bearing debt, explicitly stated
❌ No Sharia board or Islamic financing mentioned
❌ 34.54% stake in Cairo Oil & Soap requires separate screen
🔑 Watch closely:
👀 Heidelberg arbitration outcome:
KORRA is in international arbitration with Heidelberg Materials (owner of Helwan Cement) at the Cairo Regional Centre for International Commercial Arbitration (Case 1846/2026).
The dispute is over end-of-project financial settlements on a major contract.
🚩 The company booked ZERO provisions for it, meaning if they lose, the entire loss hits net profit in one shot.
🚩 The claim amount is NOT disclosed in the prospectus, could be small, could be hundreds of millions.
📉 Worst case: A loss could wipe out 1–2 years of profit and crash the stock.
📈 Best case: Settled or won → overhang removed, stock re-rates higher.
👀 What to track: Any 8-K-style disclosures, EGX filings, or news from Heidelberg about settlements.
🕵️ Reason for Forvis Mazars resignation (Auditor Resignation):
🚩 In global capital markets, an auditor walking away right before an IPO is a textbook red flag it usually means one of three things:
Disagreement over accounting treatment (revenue recognition, asset valuation, provisions)
Concerns about internal controls or audit scope.
Refusal to sign off on disclosures management wanted to make.
🎯 My Fair Value Estimate:
I used 3 independent valuation methods, then applied a risk haircut. Here's the logic 👇
1️⃣ Price-to-Earnings (P/E) Method 📈
2025 Earnings Per Share (EPS) = EGP 0.246 (Net profit ÷ 2.25B shares)
Comparable Egyptian industrial/contracting peers trade at 9x–12x earnings
Family-owned + governance risk → I cap at the lower end of the range
➡️ Fair value range: EGP 2.22 – 2.95
2️⃣ Price-to-Book (P/B) Method 📚
Book Value per share = EGP 0.72 (Equity ÷ shares outstanding)
With a strong 34% ROE, the market typically rewards 3.5x–4.5x book
➡️ Fair value range: EGP 2.52 – 3.24
3️⃣ Discounted Cash Flow (DCF) Method 💵
Projected growth: 40% → 25% → 15% over 5 years (tapering as base grows)
Discount rate: 22% (reflects Egypt's country risk, EGP devaluation, inflation)
Terminal growth: 4%
➡️ Fair value range: EGP 2.40 – 3.10
4️⃣ Risk Haircut (15–25%) ✂️ I shave 15–25% off the average of the 3 methods because of:
🚨 Auditor resignation right before the IPO
⚖️ Undisclosed Heidelberg arbitration exposure
👨👩👧 Founder owns 75% post-IPO → low minority protection
💳 High reliance on interest-bearing debt
📉 Limited free float (only 11%) → liquidity discount
➡️ My risk-adjusted Fair Value: EGP 2.20 – 2.80
📍 Bottom line: The IPO price of EGP 2.97 sits 6–35% ABOVE my risk-adjusted fair value.
The advisor's "fair value" of 3.20 doesn't bake in these risks the way I do.
🎬 Final Verdict:
🛡️ Conservative / Income: ❌ Skip.
⚖️ Balanced: ⚠️ Skip IPO, watch post-listing.
🎲 Speculator (Day 1 flip): 🟡 Small position, quick exit.
📉 If drops to EGP 2.20: ✅ Attractive long-term entry.
📈 If pumps to EGP 3.20+: 🔴 Exit / avoid.
If you like my insights, follow and boost! 🙌💙🚀
🎁 $15 TradingView Discount:
🔗 tradingview.com/pricing/?share_your_love=mnmabroukw36ix ✨💸🤑  Long
Long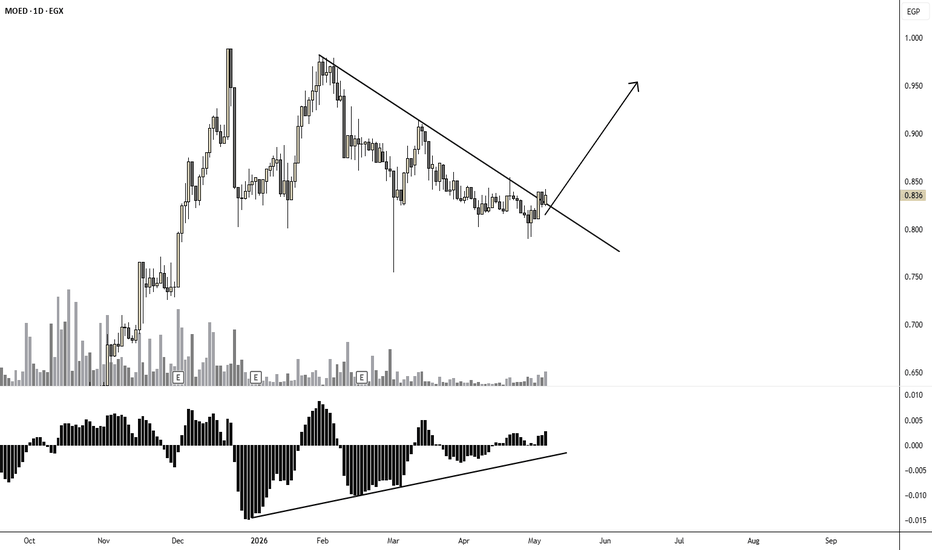
CNFN – Triangle Retest Holds the Key to 6.80 CNFN – Triangle Retest Holds the Key to 6.80 📉💳
The Reality: I see a structural beast disguised as a cash burner! 🏦🔥
In consumer finance, high loan disbursements look like giant operating cash outflows, making traditional cash margins look deceptively thin 📉.
Recognized accounting interest income is growing way faster than cash collections but this is completely normal for a expanding lending portfolio! 📈🚗
The Revenue Quality: I find the earnings to be top-tier, highly repeatable, and fully organic 💎🌟.
Profits are driven directly by interest margins, consumer credit fees, and insurance premiums not one-off asset flips or accounting tricks 💸🛡️.
The Funding Engine: I observe a massive reliance on multi-billion EGP securitized bonds and sukuk issuances to grease its lending wheels ⛓️⚓.
Despite macro inflation pressures on Egyptian consumers, CNFN’s non-performing loan (NPL) ratios remain strictly locked down via aggressive, automated risk filtering 🤖🔒.
The "Below Average" cash flow score is just a cosmetic quirk of the lending sector; its risk controls are absolute elite 🧼🛡️.
Sharia Confirmation: ❌ Non-Compliant.
Technical Analysis:
The Immediate Test: I noticed the stock is currently fighting right at the apex of its previous triangle breakout pattern 🎯🏁.
The Defensive Plan:
5.35: The first critical line of defense.
A daily close below this weakens the short-term bullish structure 🩹.
5.00: The main psychological support floor.
This is the absolute "Line in the Sand" for the current pattern 🧱🏹.
4.00 (The 200MA): If the 5.00 fortress fails, the stock slides into a confirmed bearish downtrend channel to test the long-term moving average 🛑📉.
The Sky Target: If buyers absorb the selling here and volume expands, a clean push past current resistance opens the highway straight toward your 6.50 – 6.80 EGP target range 🚀🏆!
Verdict: The Elite Credit Moat. 👑🚗
Cosmetic cash flow quirks mask a highly profitable finance giant.
Watch the 5.35 and 5.00 levels closely next week; if they hold, it's a high-conviction setup for the 6.50 target! 🛡️🔭
Do you think the auto loan portfolio will see an explosion in growth during the second half of 2026, or will the CBE's 19% interest rates keep consumers cautious? 🤔🚗🔍💼
If I like my posts, I follow and boost 🙌✨
🎁 Get a $15 discount on my next subscription:
🔗 www.tradingview.com ✨💸
 Long
Long
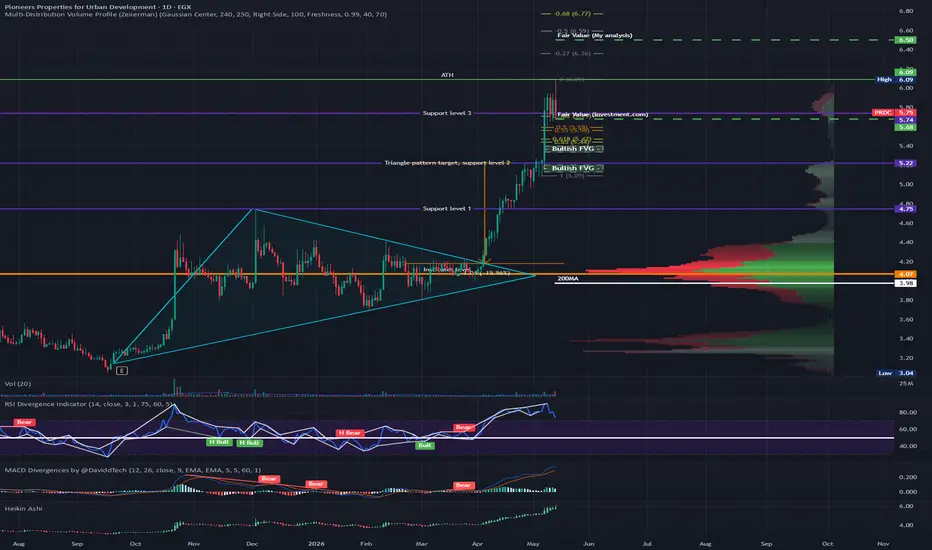
PRDC – Triangle Target Hit as Pullback IntensifiesPRDC – Triangle Target Hit as Pullback Intensifies 📉🏢
The Reality: I see a "Growth Transition Play" with a deep split! 🔀
FY2025 revenue soared to EGP 6.41B 🚀, but consolidated net profit plunged to EGP 361.77M 📉.
Stretched customer installment windows mean "paper profits" are racing way ahead of cold, hard operational cash (CFO)! 💸⚓
The Valuation Gap: I find the stock heavily underpriced at 5.75 EGP 📉.
The market is completely ignoring its huge 6.97 EGP Parent Book Value 📜!
My fair value target of 6.50 EGP (11x P/E on 0.35 EGP Parent EPS + EGP 2.65 asset premium for the new 10,000-key hotel pipeline) exposes a juicy 13.0% discount 🎯⚖️!
The Leverage Overload: I observe a dangerous dependency on bank loans to fuel an aggressive EGP 10B+ contracting backlog 🏗️.
In Egypt’s punishing 19% interest rate environment, heavy financing costs act as a massive anchor on net margins ⚓
commercial bank lines are eating the profits 🏦🔥.
Sharia Status: ❌ Non-Compliant.
Conventional debt heavily breaches the 33% market cap cap ⛓️, and huge conventional cash buffers violate the 5% interest purity filter 💰.
It remains excluded from the EGX33 Shariah Index ❌📜.
Technical Analysis:
The Exhaustion Signal: I noticed the stock hit its target after a triangle breakout to an ATH of 6.09 EGP before hitting an aggressive institutional profit-taking wall 🎯🏁.
The Key Support Levels:
5.74: The first immediate line of defense.
Aligns with local support and key moving averages 🩹.
5.22: The secondary structural floor.
If heavy selling volume persists next week, expect a retest here 🧱🏹.
4.75: The ultimate "Line in the Sand."
A break below marks a structural Change of Character (ChoCh) to a confirmed bearish downtrend 🛑📉.
The Upside Target: If bulls absorb this correction and volume returns, a sustained wave faces open skies up to your 6.50 EGP fair value 🚀🏆.
Verdict: The Heavy Asset Turnaround. 🎲🏗️
I view PRDC as a solid growth play trapped under a debt wall.
If the current structural support holds, it's a modest buy for the 6.50 EGP value gap.
However, the sheer size of the bearish volume means traders should keep defensive lines close to the chest. 🛡️🔭
Do you think management will step in with a treasury stock buyback program to defend the 5.68 support level, or will the debt burden force them to conserve cash? 🤔🏢🔍
If I like my posts, I follow and boost 🙌✨
🎁 Get a $15 discount on my next subscription:
🔗 www.tradingview.com ✨💸
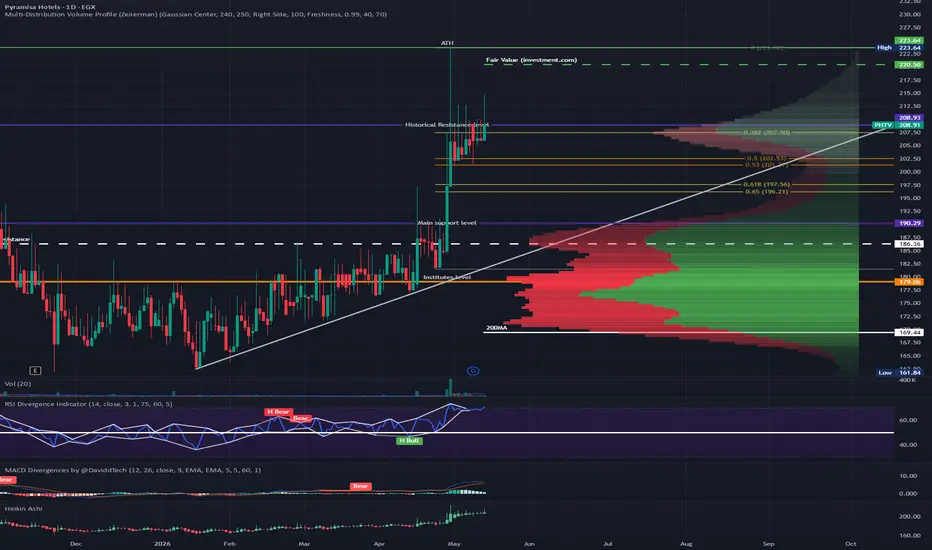
PHTV – Post-Dividend Pullback Meets Historical Resistance PHTV – Post-Dividend Pullback Meets Historical Resistance 📉🏨
The Reality: Fundamental Fortress: Net profit surged 38.9% to EGP 127.52M in Q1 2026 (released May 14). Top-tier earnings honesty means hard cash flows straight from international tour operators to the bottom line, preventing capital bottlenecks. 🏰✨💸
Dollarized Multiplier: Hospitality acts as a bulletproof macro shield.
PHTV aligns room rates with USD/Euro benchmarks while keeping its cost base localized in EGP, locking in a stellar 24.5% net profit margin. 🛡️💵✈️
Interest-Rate Shield: The balance sheet is immune to macro tightening with a negligible 1.4% Debt-to-Equity ratio, completely unbothered by the CBE's 19% interest rates.
Massive cash reserves self-fund expansions and backed a juicy EGP 4.00 dividend paid on May 13. 🧼🏦
Valuation Disconnect: Heavily mispriced trading at a trailing P/E of just 6.6x vs. a 21.6x peer average.
My Fair Value of 296.58 EGP (8.5x multiplier on 31.72 EGP TTM EPS + 10% currency premium) exposes a massive +29.6% upside from the current 208.91 EGP market price. 🎯⚖️
Sharia Status: ❌ Non-Compliant.
I confirm that PHTV is not Sharia compliant. ☪️🚫
Even though its pristine financial ratios (1.4% debt) would easily clear any leverage filter, it fails the structural Qualitative Activity Filter due to its hospitality nature involving hotel bars, entertainment venues, and casino properties (e.g., Pyramisa Suites Hotel and Casino).
Consequently, it remains excluded from the EGX33 Shariah Index. 📜❌
Technical Analysis:
The Fibonacci Reset: I’ve identified that after hitting its recent All-Time High near 228.00 EGP in late April, the stock experienced a healthy post-dividend reset down to the 50% Fibonacci retracement level. 📉🎰
The Overhead Barrier: I see the 209.00 EGP historical resistance level holding firm.
Price is currently tight just under this mark.
A daily candle close above 209.00 is required to confirm that the pullback wave has ended. 🧱🏹
The Liquidity Trigger: I am with you on the volume requirement.
For a clean, non-fake out breakout past 209.00 and back toward the 228.00 ATH, I need to see daily traded values accelerating toward EGP 20M per day. 🌪️📈
Verdict: I classify PHTV as a "Fundamental Strong Buy / Technical Breakout Watch." 🏗️🏎️
Do not chase if liquidity remains thin under the 209.00 ceiling.
I am waiting for an institutional volume spike to trigger an entry, targeting a structural run toward the 296.58 EGP realistic fair value. 🛡️🔝
Do you think the institutional volume will arrive next week to force the break above 209, or will retail traders wait for the full consolidated Q1 numbers to back up the standalone performance? 🤔📈🏢
If I like my posts, I follow and boost 🙌✨
🎁 Get a $15 discount on my next subscription:
🔗 www.tradingview.com ✨💸  Long
Long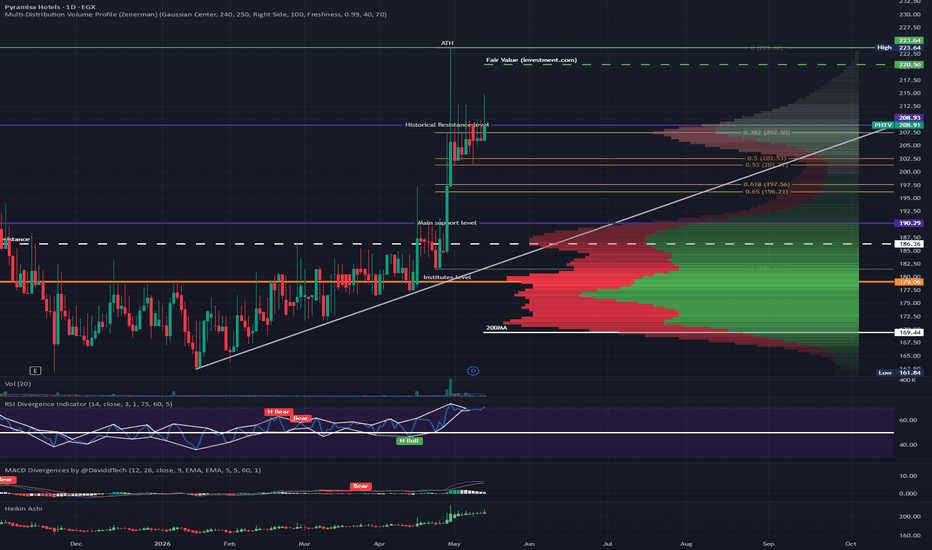
 Short
Short
 Short
Short
 Short
Short
ACAMD – Premium Valuation vs. Support LevelsACAMD – Premium Valuation vs. Support Levels 📉🏢
The Reality: I see a "Land Bank" play where the chart and the balance sheet are speaking two different languages. 🗺️
While the 1.88 EGP Fair Value reflects the mathematical reality of its current operations, the market price of 2.23 EGP is fueled by a 18.6% speculative premium.
This is a stock where investors aren't buying the "company" they are buying the land in Zefta and the Delta region as an inflation hedge. 🌾🏙️
The Treasury Trap: I recognize the "synthetic floor" management has built.
By aggressively purchasing treasury shares between April and May 2026, ACAMD has successfully signaled a "buy" to retail traders. 🏛️🛒
However, I find that while this reduces supply, it doesn't change the underlying EGP 14.09M net loss reported in the last annual cycle. 📉⛽
The "Penalty" Rumor Mill: I observe the classic EGX "Paradox." 🏛️⚖️
On May 6, 2026, the EGX Listing Committee slapped ACAMD with a penalty for delaying its FY2025 financial statements.
In a standard market, this would be a sell-off; here, it has triggered whispers of "hidden" land sales or strategic partnerships, keeping the momentum alive. 🕵️♂️📈
Sharia Confirmation: ❌ Non-Compliant. Fails May 2026 screening criteria. ☪️🚫
Technical Analysis:
The Key Support Levels:
1.94: The technical "test" area. 🩹
Verdict: I classify ACAMD as a "Fundamental Hold / Technical Sell at Resistance." 🏗️🏎️
Do you think the "Zefta Land" revaluation will be included in the delayed FY2025 report, or will the company continue to hide its asset strength behind historical costs? 🤔🗺️🔍
If I like my posts, I follow and boost 🙌✨
🎁 Get a $15 discount on my next subscription:
🔗 www.tradingview.com ✨💸 OIH – Betting on the Brand vs. the Cash Burn OIH – Betting on the Brand vs. the Cash Burn 📉🏛️
The Reality: I see a "Speculative Magnet" that has successfully detached from its financial gravity. 🎈
OIH is the ultimate volume king on the EGX, but the numbers tell a story of "Paper Profits."
While it reports a net income of EGP 412M, the negative EGP 164M operating cash flow reveals that the business is struggling to turn its EGP 3.5B revenue into actual liquid cash. 📉💸
The FX Mirage: I recognize that many investors treat OIH as a "Synthetic USD." 💵
Because of its history in global telecoms and international assets, it acts as a favorite hedge against currency devaluation.
However, I find that much of the "profit" stems from FX gains and asset revaluations rather than selling products or services. 🎭🌬️
The Trophy Assets: I observe the pivot into high-prestige tourism (the Pyramids Plateau and GEM). 🏺
While these are world-class destinations, they are currently capital-intensive "black holes" that haven't yet reached the high-margin, high-collection phase needed to heal the company's liquidity. 🏗️⌛
Sharia Status: ❌ Non-Compliant.
I confirm that OIH is not Sharia compliant. ☪️🚫
Between its historical interest-bearing debt and its involvement in sectors that often breach financial filters (including past legacy telecom/media debt structures), it remains a "Pass" for Shariah-conscious investors. 📜📉
Technical Analysis:
The Support Floor: I’ve identified 1.35 as the critical psychological and technical base. 🩹
If the price dips here on "Red Days," it has historically been a magnet for retail buyers. ⚓🧱
The Resistance Barrier: I see 1.65 as the immediate ceiling. 🧱
A volume-backed breakout above this level is what will trigger the "Euphoria Wave" toward your 1.61target. 🚀🏁
The Momentum Warning: I noticed that the stock is highly sensitive to index volatility. 🌪️
When the EGX30 corrects, OIH often leads the slide because of its high retail concentration. 🛑📉
Verdict: The Momentum Monster. 👹🎰
I view OIH as a trading vehicle, not an investment.
Its high 100%+ Accrual Ratio means you are buying a dream that hasn't been cashed in yet.
If you are a momentum trader, ride the volume; if you are a value investor, the "Paper Profits" are a clear warning to stay away. 🛡️🔭
Do you think the Pyramids Plateau project will start showing operational cash flow in the second half of 2026, or will it remain an "accounting gain" play for the foreseeable future? 🤔🏜️🔍
If I like my posts, I follow and boost 🙌✨
🎁 Get a $15 discount on my next subscription:
🔗 www.tradingview.com ✨💸
 Short
Short
SVCE – Momentum vs. The 10.15 Resistance SVCE – Momentum vs. The 10.15 Resistance 📉🧱
The Reality: South Valley Cement has shifted from a distressed asset into a high-volume speculative favorite on the EGX.
The core story revolves around the EGP 2.4B capital hike (doubling issued capital to EGP 4.82B), which is a "survival lifeline" designed to wipe out long-standing debt. ⚓💸
The Cash Flow Struggle: I find the fundamentals still "in the ICU." 🏥
Despite EGP 2.76B in sales, the company is burning cash with a CFO of around -EGP 60M.
It is physically losing money to keep the kilns running, and the EGP 280M net loss proves that the capital injection is for debt relief, not yet for growth. 📉🔥
The Solvency Pivot: I recognize that before the rights issue, the company was at a breaking point with EGP 3.9B in liabilities. ⛓️
While the new cash provides a buffer, the slow construction market makes collecting the EGP 448M in receivables a grueling task. 🐢💰
The Technical Momentum: I observe that the chart is far more optimistic than the balance sheet. 🐂
The market is clearly "front-running" the post-restructuring recovery.
At the current pace, the technicals are ignoring the historical "Poor" rating and focusing on the path toward the 10.15 EGP resistance. 🚀🎯
Sharia Status: ❌ Non-Compliant.
I confirm that SVCE is currently not Sharia compliant. ☪️🚫
Even though cement production is a Halal activity, the company’s conventional debt-to-market-cap ratio has consistently breached the 33% threshold.
While the rights issue aims to fix this, SVCE must pass a full bi-annual rebalancing cycle (and sustain improved ratios) before it can even be considered for the EGX33 Shariah Index. 📜⏳
Technical Analysis:
The Breakout Race, Testing the Upper Barriers. 🎢🧗
The Immediate Goal: I’ve identified 9.00 as the "Make or Break" resistance.
A clean break here opens the door for a test of the 10.15 ATH. 🔓📈
The Support Net: I am watching 8.00 as the first line of defense. 🩹
If that fails, the main structural support sits at 6.50. ⚓🧱
The Trend Sentinel: If the price drops below this 200 moving average, the "turnaround dream" is over, and the stock enters a confirmed downtrend channel. 🛑📉
Verdict: I classify SVCE as a "Fundamental Pass / Technical watch." 🏗️🏎️
Do you think the institutional coverage for the rights issue will be high enough to push the price past 10.15? 🤔🏗️🔍
If I like my posts, I follow and boost 🙌✨
🎁 Get a $15 discount on my next subscription:
🔗 www.tradingview.com ✨💸 CRST Parabolic Run Meets the Cash Flow Wall CRST – Parabolic Run Meets the Cash Flow Wall 📉🎢
The Reality: I see a classic "Turnaround Trap" in the making. 🪤
While CRST has finally posted a "clean" net profit of EGP 77.7M (EPS 0.14) driven by core contracting and tunneling, the underlying mechanics are alarming.
I find the negative free cash flow (-EGP 9.1M) to be a major red flag the company is reporting profits on paper but is physically losing cash to sustain its operations. 📉💸
The Cash Crunch: I recognize that CRST has less than a year of cash runway based on current trends. ⏳
With a high reliance on credit in a 19% interest rate environment, the company is effectively "financing" its turnaround.
I find the huge accruals and growing receivables indicate a significant lag in actually collecting the money it earns. ⚓🏦
The Speculative Surge: I observe massive retail interest, with 28% of the market cap trading in a single day. 🌊
This is pure euphoria, not institutional accumulation.
While the technicals are "parabolic," I see that the gap between the EGP 1.40 Growth Target and the current fundamental health is a "Quality Trap." 🎈📍
Sharia Status: it is not in EGX33. ☪️📜
Technical Analysis:
Fibonacci Extension Target Hit, Brace for Consolidation. 🎢🧗
The Target Reached: I noticed the price hit the Fib extension level exactly, a common area for trend exhaustion. 🎯🏁
The Pullback Scenario: I am eyeing a retreat to the 0.90 support level. 🩹
If the euphoria breaks, a "strong bearish wave" could easily test the 0.70 stop-loss zone, representing a "Change of Character" from the current parabolic run. 📉🌊
The Liquidity Warning: Trading 28% of a company's total shares in one day is a sign of extreme churn. 🌪️
When the music stops, the exit door will be very narrow. 🚪🏃♂️
Verdict: I classify CRST as a "Fundamental Avoid / Technical Spec." 🏗️🏎️
"Big Pass." I am staying away from this trap and waiting for the price to settle at the 0.90 safety level before even checking the pulse of the buyers again. 🛡️🔝
Do you think the recent EGX inquiries and the suspension on May 11th will be the pin that finally pops the euphoria, or will the "huge liquidity" swallow the news? 🤔🔍📈
If I like my posts, I follow and boost 🙌✨
🎁 Get a $15 discount on my next subscription:
🔗 www.tradingview.com ✨💸  Long
Long
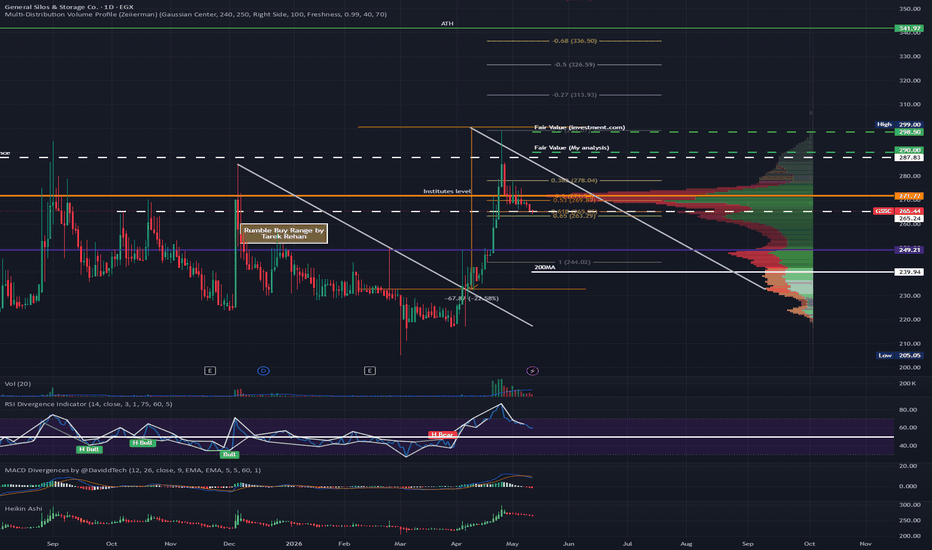
GSSC – Post-Triangle Retest at SupportGSSC – Post-Triangle Retest at Support 📉🌾
The Reality: I see a "Strategic Utility" that serves as the backbone of Egypt’s food security. 🏛️✨
As the primary custodian of the nation’s grain reserves, GSSC operates a high-volume, thin-margin model where performance is tied to government wheat cycles and the modernization of storage logistics.
The Cash Engine: I recognize a company with a strong ability to convert operating profits into cash, free from "financial engineering".
However, I find that a significant portion of liquidity is consistently tied up in receivables from state entities, making collection delays the primary drag on its cash position.
The Growth Drivers: I observe that the expansion of "Silo Complexes" across the Delta and Upper Egypt is increasing throughput and discharge fees, which are largely shielded from local inflation.
While GSSC doesn't own the grain, higher global wheat prices increase the "Security and Insurance" value of its operations, often triggering fee adjustments.
The Dividend Play: I find that GSSC remains a "Dividend King" with a high payout ratio (recently ~EGP 4.25 per share).
In a sideways market, it acts as a defensive yield play, particularly attractive to domestic pension funds seeking stability.
Sharia Status: ✅ Confirmed Compliant.
I confirm that GSSC is Sharia compliant, meeting the necessary financial and activity-based criteria.
However, it is not currently included in the EGX33 Shariah Index, which typically highlights the most liquid compliant stocks.
Technical Analysis:
The Pattern Exit: I noticed the stock successfully hit its target following the ascending triangle breakout and is now undergoing a healthy technical reset.
The Support Cluster: I’ve identified a strong support zone between 265 and 271. 🩹📈
If the price can stabilize and close above 271, the "take profit" phase is likely over.
The Correction Target: Should the 265 level fail, I am eyeing the 249 mark as a high-conviction entry point, which aligns with historical price action and the lower boundaries of the current trend.
The Red Line: I am keeping a close watch on the 200MA. A break below this would signal a transition into a downtrend, invalidating the current defensive thesis.
Liquidity Note: I note that volume is decreasing during this pullback, which I find encouraging for a potential reversal.
Verdict: The Infrastructure Anchor. ⚓🌾
I view GSSC as a low-beta, high-reliability hold.
I am watching for a close above the 271 main support to signal a safe entry.
If the correction deepens, I see the 249 level as a secondary "Value" entry point, provided it stays above the 200MA.
Do you think the current decrease in volume suggests that the "take profit" phase is reaching its end, or is there more room for a slide to 249? 🤔🔍📈
If I like my posts, I follow and boost 🙌✨
🎁 Get a $15 discount on my next subscription:
🔗 www.tradingview.com ✨💸  Long
Long