EGCH (KIMA) - EGX: Multi-Timeframe Technical OutlookEgyptian Chemical Industries (EGCH) EGX:EGCH is currently navigating a pullback within a broader upward-sloping channel framework. After hitting a recent peak near 15.40 EGP , the price corrected toward support and is now hovering around 13.08 EGP , retesting key internal trendlines.
Below is a detailed analysis based on the Daily and Weekly charts, along with critical technical levels and trading strategies.
1. Price Action & Structural Breakdown
Ascending Channel Dynamics: The stock continues to trade within a medium-to-long-term ascending channel structure bounded by upper resistance (solid blue line) and major trend support (solid red line, ranging from 11.80 – 11.90 EGP ).
Mid-Channel Support Retest: The current price at 13.08 EGP sits directly around the mid-channel median line (dashed orange line) and the immediate support layer at 12.90 EGP .
Recent Swing Highs: Overhead supply is evident from recent rejections at 14.30 EGP , 15.00 EGP , and the peak at 15.40 EGP .
2. Indicator Analysis across Timeframes
Daily Timeframe (1D):
RSI (14): Reads at 49.72 (near its 50.08 signal line), reflecting a balanced, neutral momentum state following the cool-off from overbought levels.
MACD (12, 26, 9): The histogram is showing positive green ticks above the zero line (0.015), indicating early stabilization after the corrective phase.
Volume Profile: Trading volume sits at 6.31M , reflecting steady market participation without panicky distribution.
Weekly Timeframe (1W):
RSI (14): Holds firmly in positive territory at 53.76 , keeping the macro bullish trend intact above the critical 50 threshold.
MACD (12, 26, 9): Positioned above zero (0.407 vs signal 0.495), undergoing a mild consolidation phase while retaining macro structural strength.
3. Key Technical Levels
Immediate Support: 12.90 EGP
Major Macro Support: 11.80 – 11.90 EGP (Lower Channel Boundary)
First Overhead Resistance: 14.30 EGP
Secondary Resistance / Targets: 15.00 EGP – 15.40 EGP
Macro Extension Target: 15.50 EGP+ (Upper Channel Resistance)
4. Actionable Trading Scenarios
Bullish Scenario (Bounce & Continuation):
A sustained hold above 12.90 EGP on increasing daily volume indicates that the mid-channel line is acting as a springboard.
Entry Zone: Accumulation between 12.90 – 13.10 EGP , or on a breakout above 13.50 EGP .
Target 1: 14.30 EGP
Target 2: 15.00 – 15.40 EGP
Stop Loss: A daily closing below 12.70 EGP (or 11.80 EGP for long-term swing traders).
Deep Retracement Scenario:
If 12.90 EGP fails to hold, expect a secondary dip toward the primary channel support line around 11.80 – 11.90 EGP , which would present a high-probability value entry zone for medium-term buyers.
Summary:
EGCH remains in a healthy uptrend within its channel bounds. As long as the stock maintains trades above 12.90 EGP , the bias favors a retest of 14.30 EGP and eventually the 15.00 – 15.40 EGP resistance zone. ACTF - EGX : Technical OutlookAct Financial (ACTF) EGX:ACTF is currently consolidating near a major technical inflection point on both the weekly and daily timeframes. The stock is exhibiting classic multi-month volatility compression (a broad descending wedge/triangle pattern), signaling that an explosive directional move is brewing.
Below is a detailed breakdown of the technical indicators, key support/resistance levels, and actionable trading scenarios.
1. Price Action & Pattern Breakdown
Symmetrical / Wedge Consolidation: The price is caught inside a macro converging structure. The upper resistance trendline (dashed grey) has capped rallies since late 2024, while the lower support line near 2.50 – 2.60 EGP has consistently cushioned sell-offs.
Key Horizontal Support: Strong horizontal support holds around 2.60 EGP (orange line), with psychological macro support at 2.50 EGP .
Immediate Resistance Zone: A secondary resistance trendline (solid blue line) is acting as immediate overhead supply near 2.90 – 2.95 EGP .
2. Technical Indicators Analysis
Relative Strength Index (RSI - 14):
Weekly RSI: Sits at 52.37 (above SMA 51.04), holding comfortably in neutral-bullish territory above the 50 level.
Daily RSI: Floating at 53.85 , indicating steady momentum without being overbought, leaving ample room for a breakout push.
MACD (12, 26, 9):
Weekly MACD: Printing positive green histogram bars with the MACD line (0.008) crossing above the signal line (0.004), confirming a potential structural trend shift upward.
Daily MACD: Floating around the zero line with slight positive momentum, waiting for a volume trigger to confirm acceleration.
Volume Profile: Volume spikes accompanied recent retests of lower support levels (spring action around 2.50–2.60 EGP), pointing toward accumulation by stronger hands.
3. Key Levels to Watch
Crucial Support: 2.60 EGP (Primary) / 2.50 EGP (Secondary / Macro Invalidation)
Immediate Resistance: 2.90 – 2.95 EGP
Primary Target (On Breakout): 3.20 EGP
Secondary Target: 3.45 – 3.60 EGP (Prev. Macro Highs)
4. Trading Plan & Execution Strategy
Bullish Scenario (Breakout Trigger):
A daily close above 2.95 EGP with rising volume confirms a breakout from both the inner descending trendline and the macro structure.
Entry: Aggressive on a daily close above 2.95 EGP, or conservative on a retest of 2.90 EGP.
Target 1: 3.20 EGP
Target 2: 3.50 EGP
Stop Loss: Below 2.70 EGP (or below 2.60 EGP for swing traders).
Bearish / Risk Scenario:
A loss of the 2.60 EGP support on a weekly closing basis invalidates the bullish accumulation structure, opening the door toward 2.50 EGP or lower.
Summary:
ACTF is showing a coiled spring setup. Buyers are defending lower highs while holding a strict floor at 2.60 EGP. Risk-to-reward highly favors buyers on dips toward support or upon a confirmed volume breakout above 2.95 EGP. Breakout Gains Momentum, But Key Resistance Still Stands 📊 SIPC: Breakout Gains Momentum, But Key Resistance Still Stands 🚀
🏛️ Fundamental Review:
📊 Business Quality:
SIPC is a small-cap pharmaceutical manufacturer focused on generic medicines, OTC products, veterinary drugs, and food supplements, benefiting from resilient domestic demand for essential healthcare products. 💊
📈 Growth:
The company continues to expand its product portfolio, but earnings growth remains inconsistent due to margin pressure and rising production costs. 📈
💰 Profitability:
Profitability remains weak, with very thin net margins and earnings that are still insufficient to justify the current valuation. ⚠️
🏦 Financial Health:
Financial leverage is manageable, but dependence on imported active pharmaceutical ingredients leaves the business exposed to foreign exchange fluctuations and cost inflation. 🏛️
💎 Valuation:
Despite the recent technical strength, the stock remains fundamentally expensive, trading at valuation multiples that require a significant improvement in earnings to be justified. 📐
☪️ Shariah Compliance:
Status: Likely Shariah-compliant. ✅
Reason: Based on publicly available financial information, leverage appears moderate and the company's core business is pharmaceutical manufacturing, which is generally considered a permissible activity. However, a definitive ruling requires a full AAOIFI financial screening using the latest audited statements. ⚖️
⚡ The Pulse:
SIPC recently delivered a strong technical breakout supported by significantly higher trading volume, indicating renewed buying interest. 🚀
Despite the bullish price action, the company's fundamentals remain relatively weak, making risk management especially important. ⚠️
I would prefer to wait for a confirmed breakout above the major resistance at 4.19 EGP before considering a new position. 📈
Ideally, the stock should close above 4.19 EGP and remain above that level for at least one full trading session to confirm buyer control. ✅
🧱 The Key Structural Boundaries
• Breakout Trigger:
A confirmed daily close above 4.19 EGP with sustained volume would validate the continuation of the bullish trend. 🚀
• First Target:
4.90 EGP, representing the current 52-week high and the first major technical objective. 🎯
• Second Target:
5.20 EGP, aligning with the estimated fair value and the next major upside objective. 💰
• Stop Loss:
Exit on a confirmed break below the main support level at 3.64 EGP. 🛑
📌 Verdict:
The technical picture has improved considerably following the high-volume breakout. 📈
However, weak profitability and stretched valuation make the stock more suitable for momentum traders than long-term investors. ⚠️
Waiting for confirmation above 4.19 EGP offers a better risk-to-reward entry than chasing the current move. 🎯
Strict adherence to the stop-loss level at 3.64 EGP is essential given the stock's high volatility. 🛡️
If you like my insights, follow and boost! 🙌💙🚀
🎁 $15 TradingView Discount:
www.tradingview.com
✨💸🤑
GBCO: Healthy Pullback Keeps the Bullish Trend Intact 📊 GBCO: Healthy Pullback Keeps the Bullish Trend Intact 🚀
🏛️ Fundamental Review:
📊 Business Quality:
GB Corp remains one of Egypt's highest-quality diversified growth companies, combining a dominant automotive business with a rapidly expanding non-banking financial services platform. 🚗
📈 Growth:
Revenue and earnings continue to grow at an impressive pace, supported by the strong expansion of GB Capital, local vehicle assembly, and rising consumer financing demand. 📊
💰 Profitability:
While higher interest rates have temporarily compressed net margins, the company continues to generate solid operating profits and strong cash flow. 💵
🏦 Financial Health:
The balance sheet remains healthy despite financing costs, supported by a diversified business model and disciplined capital allocation. 🏛️
💎 Valuation:
The stock trades around fair valuation compared to its historical multiples, offering attractive long-term upside as earnings continue to expand. 📐
☪️ Shariah Compliance:
Status: Not Shariah-compliant. ❌
Reason: GB Corp derives a significant portion of its earnings from conventional non-bank financial services (leasing, consumer finance, and lending through GB Capital), which involve interest-based financing that does not satisfy widely used AAOIFI Shariah screening standards. ⚖️
⚡ The Pulse:
Although the breakout faced several periods of consolidation, the overall bullish trend remains intact. 📈
The recent pullback occurred on declining volume, which is a healthy sign as it allows momentum indicators to cool without signaling aggressive distribution. 📉
The main technical concern is a daily close below 30.30 EGP, which would create a Change of Character (CHoCH). ⚠️
A second consecutive close below 30.30 EGP would strengthen that bearish signal and require closer monitoring. 👀
Despite that risk, I would remain invested unless the price breaks below the lower boundary of the rising trend channel or loses the Fibonacci 61.8% support around 28.50 EGP. 🛡️
🧱 The Key Structural Boundaries
• Breakout Trigger:
A sustained move higher from the current consolidation keeps the primary uptrend active and shifts focus back toward the yearly highs. 🚀
• First Target:
34.00 EGP, representing the current all-time high and the first major resistance. 🎯
• Second Target:
38.50 EGP, aligning with both the measured breakout objective and the estimated fair value. 💰
• Final Target:
43.00 EGP, corresponding to the next Fibonacci extension target if bullish momentum accelerates. 🌟
• Stop Loss:
Exit on a confirmed break below 28.50 EGP or a breakdown beneath the lower boundary of the long-term ascending channel. 🛑
📌 Verdict:
GBCO continues to be one of the strongest long-term growth stories on the EGX. ⭐
The current pullback appears constructive rather than bearish and is helping reset momentum indicators. 🔄
As long as the stock holds above its key structural support levels, the primary bullish trend remains valid. 📈
Risk management should focus on protecting positions only if the trend channel fails or the 28.50 EGP support is decisively broken. ⚖️
If you like my insights, follow and boost! 🙌💙🚀
🎁 $15 TradingView Discount:
www.tradingview.com
✨💸🤑
 Long
Long
ELKA: Healthy Pullback Offers a Better Entry Opportunity 📊 ELKA: Healthy Pullback Offers a Better Entry Opportunity 🚀
🏛️ Fundamental Review:
📊 Business Quality:
ELKA is an asset-rich real estate developer with one of the cheapest valuations on the EGX. Despite the recent parabolic rally, the stock continues to trade at attractive valuation multiples, supported by a strong land bank, low leverage, and backing from Pioneers Properties. 🏗️
💰 Financial Strength:
The company maintains a conservative balance sheet with low debt, strong asset backing, and healthy profitability, giving it the financial flexibility to navigate different market cycles. 💵
📈 Growth Catalysts:
Future value realization from its land portfolio, continued project deliveries, and potential NAV convergence remain the key long-term drivers. 🚀
⚠️ Key Risks:
Quarterly earnings can fluctuate due to revenue recognition timing, while higher construction costs and majority ownership may limit short-term market participation. ⚠️
☪️ Shariah Compliance:
Status: Likely Non-Compliant. ❌
Reason: Although ELKA has relatively low leverage, its business involves conventional real estate activities and there is insufficient publicly available evidence that it satisfies all AAOIFI financial screening requirements. Investors seeking Shariah-compliant investments should verify using their preferred screening methodology before investing.
📈 The Pulse:
After the recent parabolic rally, ELKA is undergoing a healthy correction while remaining fundamentally attractive. 📉
Even after the strong advance, the company's valuation ratios still suggest the stock is trading below its intrinsic value. 💎
The most attractive accumulation zone is around the 50% Fibonacci retracement and the Fair Value Gap near 1.71 EGP. 🎯
As long as the broader market remains supportive, this pullback should be viewed as an opportunity rather than a trend reversal. 📊
🧱 The Key Structural Boundaries
• Entry Zone: Watch for bullish price action around the 50% Fibonacci level and Fair Value Gap near 1.71 EGP. 🎯
• First Target: 2.10 EGP, where the next major resistance is expected. 🚀
• Second Target: Around 2.50 EGP, just below the all-time high and major order block. 📈
• Final Target: 3.30 EGP, corresponding to the Fibonacci extension target. 🎯
• Stop Loss: A confirmed break below the major support at 1.41 EGP invalidates the bullish setup. 🛑
If you like my insights, follow and boost! 🙌💙🚀
🎁 $15 TradingView Discount:
www.tradingview.com
✨💸🤑
 Long
Long
 Long
Long
 Long
Long
 Long
Long
 Long
Long
TANM: Breakout Confirmed, But Chasing the Rally Higher Risk📊 TANM: Breakout Confirmed, But Chasing the Rally Carries Higher Risk 🏗️
🏛️ Fundamental Review:
📊 Business Quality:
TANM (Tanmiya for Real Estate Investment) is a small-cap Egyptian real estate developer focused on land development, property investment, and project management. Its flexible business model allows it to capitalize on niche opportunities while benefiting from Egypt's long-term real estate demand.
💰 Financial Strength:
The company maintains a reasonable financial position with moderate profitability and manageable leverage. However, its valuation has become less attractive following the recent rally, leaving less room for valuation expansion compared to larger real estate peers.
📈 Growth Drivers:
Real estate remains one of the strongest long-term inflation hedges in Egypt. Continued land monetization, project deliveries, and improving market sentiment could support future earnings growth if demand remains healthy.
⚠️ Key Risks:
TANM remains exposed to higher construction costs, slower customer collections, and the higher volatility typically associated with small-cap real estate stocks. Following the recent advance, valuation risk has also increased.
☪️ Shariah Compliance:
Status: Likely Shariah-compliant.
Reason: The company's core business of real estate development is generally permissible. Based on publicly available information, no obvious prohibited business activities are evident. However, a definitive AAOIFI compliance assessment requires reviewing the latest financial statements for debt, cash, and non-compliant income ratios.
📈 The Pulse:
Today's candle confirmed the breakout above the major resistance at 6.00 EGP, completing an important technical milestone. 🚀
The stock has already delivered a strong parabolic rally since June, making the current valuation and technical structure increasingly stretched. 📈
The next key resistance stands at 6.44 EGP. Failure to establish trading above this level could trigger a healthy pullback toward the previous breakout area around 6.00 EGP. 🔄
A successful breakout above the Fibonacci resistance at 6.83 EGP would likely open the way toward the estimated fair value near 7.30 EGP. 🎯
At current levels, the risk-to-reward profile is no longer attractive enough for initiating new positions. ⚖️
🧱 The Key Structural Boundaries
Support Level:
The previous breakout zone around 6.00 EGP is now the most important support area and should attract buyers during any pullback. 🛡️
Breakout Trigger:
A confirmed close above 6.83 EGP would signal continuation toward the next upside objective. 📈
Target:
Fair value estimate around 7.30 EGP. 🎯
Risk Management:
A confirmed breakdown below the 5.65 EGP support level would invalidate the current bullish structure and trigger the stop-loss. ⛔
📊 Verdict:
TANM remains technically bullish after confirming the breakout above 6.00 EGP. ✅
However, the stock has become extended following its sharp advance since June, reducing the attractiveness of chasing momentum. 📉
The preferred strategy is to wait for either a healthy pullback toward 6.00 EGP or a confirmed breakout above 6.83 EGP before considering new entries. 🎯
Patience offers a better risk-to-reward opportunity than buying after an extended rally. 💡
━━━━━━━━━━━━━━━━━━━━━━
If you like my insights, follow and boost! 🙌💙🚀
🎁 $15 TradingView Discount:
www.tradingview.com
✨💸🤑
MICH: Bullish Channel Holds as Momentum Tests Higher Levels 📊 MICH: Bullish Channel Holds as Momentum Tests Higher Levels ⚗️
🏛️ Fundamental Review:
📊 Business Quality:
MICH (Misr Chemical Industries) is Egypt's leading state-owned chlor-alkali producer and a key supplier of essential industrial chemicals. Its dominant market position, diversified customer base, and defensive business model make it one of the strongest industrial names on the EGX.
💰 Financial Strength:
The company enjoys excellent financial health with strong cash generation, low leverage, attractive valuation multiples, and a long history of generous cash dividend distributions. These qualities make MICH a preferred defensive industrial investment.
📈 Growth Drivers:
Steady domestic demand from water treatment, infrastructure, detergents, and industrial manufacturing continues to support earnings. Higher utilization rates and stable pricing power also provide long-term growth potential despite capacity constraints.
⚠️ Key Risks:
Future earnings remain sensitive to electricity and natural gas prices, while plants operating near full capacity may limit organic production growth until expansion projects are completed.
☪️ Shariah Compliance:
Status: Not Shariah-compliant.
Reason: Although the company's core chemical manufacturing activities are permissible, its financial screening does not currently satisfy commonly used AAOIFI leverage and financial ratio requirements.
📈 The Pulse:
Since breaking the major resistance at 38.80 EGP, MICH has entered a strong parabolic advance supported by sustained buying momentum. 🚀
Price is now developing a well-defined rising channel and is approaching its upper boundary. 📈
Today's session showed noticeable selling pressure during the second half of trading, increasing the probability of a short-term reaction from the upper channel resistance. 👀
The middle line of the rising channel is expected to act as the first dynamic support if a healthy pullback develops. 🛡️
As long as the price remains inside the rising channel, the primary trend continues to favor the bulls. ✅
🧱 The Key Structural Boundaries
Support Level:
The main horizontal support remains at 37.95 EGP and should continue attracting buyers during pullbacks. 📊
Bullish Structure:
Holding above 37.95 EGP keeps the current uptrend intact. 📈
Risk Management:
A confirmed breakdown below the major support at 34.65 EGP would invalidate the current bullish structure and trigger the stop-loss. ⛔
📊 Verdict:
MICH combines strong fundamentals, excellent financial health, attractive valuation, and consistent dividend generation. ⚗️
The technical trend remains bullish despite the recent signs of profit-taking near the upper boundary of the rising channel. 📈
Short-term consolidation or a controlled pullback would be healthy before attempting another leg higher. 🔄
Investors can continue holding positions while the stock respects the rising channel and the 37.95 EGP support level. 💪
Capital protection remains the priority if price closes below the major support at 34.65 EGP. 🛡️
━━━━━━━━━━━━━━━━━━━━━━
If you like my insights, follow and boost! 🙌💙🚀
🎁 $15 TradingView Discount:
www.tradingview.com
✨💸🤑
 Long
Long
CSAG: Pullback Tests Trend Support Before the Next Breakout 📊 CSAG: Pullback Tests Trend Support Before the Next Breakout 🚢
🏛️ Fundamental Review:
📊 Business Quality:
CSAG (Canal Shipping Agencies) is one of Egypt's leading state-backed maritime logistics companies, benefiting from strategic investments in major container terminals while generating recurring income from shipping agency operations. Its exposure to foreign-currency-linked revenues and attractive dividend profile make it a defensive logistics play on the EGX.
💰 Financial Strength:
The company maintains excellent financial health, supported by strong cash generation, high return on equity, and consistent dividend distributions. Although daily liquidity is relatively low due to the limited free float, the state ownership structure helps stabilize long-term price behavior.
📈 Growth Drivers:
Long-term performance remains closely tied to the recovery of Suez Canal traffic, Red Sea shipping activity, and dividend contributions from its strategic stakes in Port Said and Damietta Container terminals. Any improvement in regional shipping volumes would provide an additional earnings catalyst.
⚠️ Key Risks:
Growth remains sensitive to geopolitical developments affecting the Red Sea and Suez Canal. The limited free float can also increase volatility during periods of heavy buying or selling pressure.
☪️ Shariah Compliance:
Status: Not Shariah-compliant.
Reason: Although the company's core business is permissible, its financial screening does not currently satisfy commonly used AAOIFI leverage and financial ratio requirements.
📈 The Pulse:
Price successfully broke out of the triangle pattern but failed to clear the major resistance at 34.17 EGP, triggering a healthy pullback. 📉
The decline has occurred on relatively low trading volume, suggesting selling pressure remains limited rather than aggressive. 👀
As long as price remains inside the rising trend channel, the primary bullish structure remains intact. 📊
The lower boundary of the uptrend channel is the area where buyers are expected to defend the trend. 🛡️
A breakout above the liquidity gap around 35.00 EGP would likely restore bullish momentum and increase the probability of challenging higher resistance levels. 🚀
🧱 The Key Structural Boundaries
Breakout Trigger:
A strong daily close above 35.00 EGP with expanding volume would confirm renewed buying momentum. 📈
First Target:
Retest the all-time high around 37.60 EGP. 🎯
Second Target:
Fair value estimate around 38.90 EGP. 🎯
Trend Invalidated:
A confirmed break below the lower boundary of the rising trend channel would invalidate the current bullish structure and act as the stop-loss signal. ⛔
📊 Verdict:
CSAG remains fundamentally attractive thanks to its strong financial position, recurring dividend income, and strategic maritime assets. ⚓
The recent pullback appears corrective rather than a reversal, as it has developed on declining volume. 📉
Holding the position remains reasonable while price continues to respect the rising trend channel. ✅
New buying opportunities become significantly stronger after a confirmed breakout above 35.00 EGP with higher-than-average trading volume. 🚀
Risk management remains essential, with a confirmed breakdown below the uptrend channel serving as the exit signal. 🛡️
━━━━━━━━━━━━━━━━━━━━━━
If you like my insights, follow and boost! 🙌💙🚀
🎁 $15 TradingView Discount:
www.tradingview.com
✨💸🤑
 Long
Long
UEGC: Retail Momentum Is Fading,Wait for the Pullback Before Buy📊 UEGC: Retail Momentum Is Fading, Wait for the Pullback Before Buying ⚠️
🏛️ Fundamental Review:
📊 Business Quality:
UEGC (El Saeed Contracting & Real Estate Investment Co.) is a long-established Egyptian construction and real estate company specializing in infrastructure, civil engineering, industrial projects, and property development. The company benefits from Egypt's long-term infrastructure expansion and owns valuable real estate and contracting assets. 🏗️
✅ Strengths & Catalysts:
The company maintains a sizeable backlog of infrastructure and construction projects that supports future revenue visibility. 📈
UEGC trades at a deep discount to its book value, with a P/B ratio around 0.84x, providing an attractive asset-backed valuation. 💎
Its diversified operations across contracting, real estate, and land development reduce dependence on a single business segment. 🏢
⚠️ Risks:
Working capital remains tied to long collection cycles, particularly on government and large infrastructure projects. ⚠️
Profit margins are vulnerable to inflation in steel, cement, fuel, and other construction materials. 🏗️
The recent parabolic rally has significantly outpaced the company's underlying fundamentals, increasing the probability of a corrective phase. 📉
🕌 Sharia Compliance:
🔴 UEGC is currently not considered Sharia compliant under common AAOIFI and EGX33 financial screening methodologies due to its financial leverage and interest-related financial structure, despite operating in a permissible construction business. ☪️
💰 Valuation:
Fundamentally, UEGC remains attractively valued, trading at approximately 5.2x earnings, 0.84x book value, and a PEG ratio near 0.38x.
However, the recent price appreciation has become disconnected from its current fundamental momentum. 📊
🔍 The Pulse:
UEGC is one of the stocks associated with prominent Egyptian businessman Walid Zaki, whose investment network continues to attract strong retail attention. 👥
Despite the attractive valuation metrics, the current parabolic advance is not fully supported by the company's underlying fundamentals. ⚠️
Trading volume has been declining since last week, signaling exhaustion in the recent retail-driven buying wave. 📉
This type of volume behavior often precedes a healthy correction before the next sustainable move higher. 🔄
Rather than chasing the current price, I would prefer waiting for a pullback toward the bullish Fair Value Gap around the Fibonacci 61.8% retracement near 1.80 EGP. 📍
That area offers a much more attractive risk-to-reward profile for swing traders. 💰
🧱 The Key Structural Boundaries
🚀 Preferred Entry, 1.80 EGP.
A pullback into the bullish Fair Value Gap near the Fibonacci 61.8% level offers the highest-probability setup.
🎯 First Target, 2.60 EGP.
A retest of the previous major high.
🎯 Second Target, 3.30 EGP.
This aligns with the Investing.com fair value estimate.
🎯 Final Target, 3.70 EGP.
The next Fibonacci extension target if momentum resumes.
🛑 Stop Loss, 1.30 EGP.
A confirmed break below the major structural support invalidates the bullish setup.
🎯 The Verdict:
UEGC remains fundamentally undervalued, but the recent rally appears driven more by retail momentum than improving business performance. 📊
Declining trading volume suggests buying power is beginning to weaken. ⚠️
Patience is likely to provide a significantly better entry near 1.80 EGP rather than chasing the current move. 🛡️
Treat this as a tactical trading opportunity rather than a long-term investment, and avoid allocating a large percentage of your portfolio to the position. 🚀
---
If you like my insights, follow and boost! 🙌💙🚀
🎁 $15 TradingView Discount:
www.tradingview.com ✨💸🤑
IDRE: Momentum, But Resistance May Trigger a Healthy Pullback📊 IDRE: Strong Momentum, But Resistance May Trigger a Healthy Pullback 🏗️
🏛️ Fundamental Review:
📊 Business Quality:
IDRE (Ismailia Development & Real Estate) is a small-cap Egyptian real estate developer operating in the local property market. While the sector continues to benefit from long-term demand, the company remains primarily a momentum-driven stock due to limited publicly available financial disclosures. 🏢
✅ Strengths & Catalysts:
The stock recently attracted strong buying interest, posting one of the strongest rallies on the EGX. 🚀
Egypt's real estate sector continues to benefit from favorable long-term macroeconomic and demographic trends. 🏗️
As a small-cap stock, IDRE can outperform during periods of strong retail participation and improving market sentiment. 📈
⚠️ Risks:
Limited financial transparency makes fundamental valuation less reliable than for larger EGX companies. ⚠️
The stock is highly volatile and frequently experiences sharp price swings. 📉
Its corporate restructuring history adds additional uncertainty for long-term investors. 🏢
🕌 Sharia Compliance:
🟡 IDRE operates in a Sharia-permissible real estate business. However, sufficient public financial information is currently unavailable to conclusively determine compliance with the latest EGX33 Sharia financial screening criteria. ☪️
💰 Valuation:
Current market action is being driven far more by technical momentum than by underlying fundamentals, making disciplined entries essential. 💎
🔍 The Pulse:
Although the fundamentals do not fully justify the recent rally, the stock has attracted above-average liquidity that pushed it toward the upper boundary of its long-term uptrend channel. 📊
Following such a strong advance, the probability of a healthy pullback during the coming sessions has increased. 🔄
A correction would be technically normal and could provide a better risk-to-reward entry before another attempt higher. 📉
The most important resistance ahead is the major order block around 60.00 EGP. 📍
This level is expected to attract significant selling pressure and will likely require exceptional buying volume to overcome. 🚧
🧱 The Key Structural Boundaries
🚀 Breakout Trigger, 60.00 EGP.
A confirmed close above the major order block would signal a continuation of the primary uptrend.
⚠️ Expected Scenario.
A short-term pullback remains the higher-probability outcome before another attempt to break higher.
🎯 Long-Term Outlook.
The bullish trend remains intact as long as the primary support structure continues to hold.
🛑 Stop Loss, 38.00 EGP.
A confirmed break below the main support level invalidates the current bullish structure.
🎯 The Verdict:
IDRE remains a momentum-driven trading opportunity rather than a fundamentally driven investment. 📈
The recent liquidity surge is encouraging, but the stock is approaching one of its strongest resistance zones. ⚠️
Patience may offer a better entry if the expected pullback develops before the next bullish leg. 🛡️
A decisive breakout above 60.00 EGP would significantly improve the long-term technical outlook. 🚀
---
If you like my insights, follow and boost! 🙌💙🚀
🎁 $15 TradingView Discount:
www.tradingview.com ✨💸🤑
FERC: Heavy Selling Keeps the Long-Term Trend Under Pressure📊 FERC: Heavy Selling Keeps the Long-Term Trend Under Pressure ⚠️
🏛️ Fundamental Review:
📊 Business Quality:
FERC (Ferchem Misr for Fertilizers and Chemicals) is an Egyptian fertilizers and chemicals producer serving the agricultural sector. The company operates in a strategically important industry with relatively stable long-term demand supported by food production and agricultural activity. 🌱
✅ Strengths & Catalysts:
The company continues to generate sufficient cash flow to distribute dividends, supporting its income investment profile. 💰
The fertilizers and chemicals sector benefits from structural demand and remains an important component of Egypt's agricultural economy. 🌾
Its relatively large market capitalization provides better institutional visibility than many smaller industrial stocks. 🏭
⚠️ Risks:
Public financial disclosure remains limited, making detailed valuation analysis more difficult. ⚠️
Profitability remains sensitive to fluctuations in energy prices, raw material costs, and fertilizer demand. ⛽
🕌 Sharia Compliance:
🟡 FERC operates in a Sharia-permissible business. However, sufficient public financial information is currently unavailable to conclusively verify compliance with the latest EGX33 Sharia financial screening criteria. ☪️
💰 Valuation:
The available public information suggests a fairly valued industrial company, but limited financial transparency reduces confidence in a precise intrinsic valuation. 💎
🔍 The Pulse:
Although FERC experienced strong trading liquidity last week, most of that activity reflected selling pressure rather than accumulation. 📉
Since recording its all-time high last November, the stock has continued to trade inside a broad sideways-to-downtrend channel. 📊
The overall technical structure remains bearish despite occasional short-term rallies. ⚠️
The key level to monitor is the major resistance at 83.70 EGP. 📍
As long as the stock remains below this resistance, I continue to view the technical outlook as negative. 🚫
A confirmed breakout above 83.70 EGP would be the first meaningful signal that buyers are regaining control. 🚀
🧱 The Key Structural Boundaries
🚀 Breakout Trigger, 83.70 EGP.
A confirmed close above this major resistance would improve the technical outlook.
⚠️ Current Structure.
The stock remains inside a sideways-to-downtrend channel until proven otherwise.
📍 Trend Monitoring.
Watch price behavior around the middle channel support, as it represents the first sign of technical weakness.
🛑 Stop Loss.
If the price breaks below the middle channel and remains below it for two consecutive trading sessions, consider exiting the position.
🎯 The Verdict:
FERC remains fundamentally supported by a defensive industry and dividend-paying profile. 🌱
However, the technical picture has yet to confirm a new bullish trend. 📉
Wait for a decisive breakout above 83.70 EGP before becoming more optimistic. 🚀
Until then, capital preservation should remain the priority, with disciplined risk management if the middle channel support fails. 🛡️
---
If you like my insights, follow and boost! 🙌💙🚀
🎁 $15 TradingView Discount:
www.tradingview.com ✨💸🤑
INEG: Breakout But Major Resistance May lead a Healthy Pullback📊 INEG: Breakout Confirmed, But Major Resistance May Trigger a Healthy Pullback ⚙️
🏛️ Fundamental Review:
📊 Business Quality:
INEG (Integrated Engineering Group) is a small-cap industrial and engineering company specializing in steel fabrication, industrial construction, maintenance, and turnkey engineering projects. The company remains a speculative turnaround story driven by execution and future expansion rather than established earnings. 🏗️
✅ Strengths & Catalysts:
The company has returned to profitability, demonstrating positive earnings despite its relatively small operating scale. 📈
A planned capital increase could strengthen the balance sheet and support future business expansion if deployed efficiently. 💰
Recent trading activity has attracted strong speculative interest, supported by improving liquidity and positive technical momentum. 🚀
⚠️ Risks:
The planned capital increase introduces meaningful dilution risk for existing shareholders. ⚠️
The company operates in a cyclical industrial sector where project execution and working capital management remain critical. 🏭
Current profitability remains modest, leaving earnings vulnerable to project delays and rising operating costs. 📉
🕌 Sharia Compliance:
🟡 INEG operates in a Sharia-permissible industrial business. However, sufficient public financial information is currently unavailable to conclusively verify compliance with the latest EGX33 Sharia financial screening criteria. ☪️
💰 Valuation:
The stock should be viewed primarily as a speculative technical opportunity rather than a fundamentally driven value investment until profitability becomes more consistent. 💎
🔍 The Pulse:
INEG has traded inside a well-defined downtrend channel since the beginning of the year. 📉
Last week, the stock delivered a confirmed breakout from that channel supported by strong trading volume. 🚀
The breakout is encouraging, but the price has now reached one of its strongest technical resistance zones. ⚠️
This area combines the Fibonacci 61.8% retracement around 0.534 EGP with a major historical order block, making it a difficult resistance to overcome on the first attempt. 📍
I expect either a period of sideways consolidation or a healthy pullback before the next breakout attempt. 🔄
A normal correction could retest the Fibonacci 50% level, while a deeper pullback may revisit the 200-day moving average before buyers return. 📊
If the stock successfully clears the current order block with strong volume, the medium-term bullish trend would be confirmed. 💪
🧱 The Key Structural Boundaries
🚀 Breakout Trigger, 0.534 EGP.
A confirmed close above the Fibonacci 61.8% level and the major order block signals the next bullish leg.
🎯 First Target, 0.635 EGP.
This aligns with the 52-week high resistance area.
🎯 Second Target, 0.713 EGP.
A successful breakout opens the path toward the previous all-time high.
🎯 Final Target, 0.820 EGP.
This represents the Investing.com fair value estimate and the long-term technical objective.
⚠️ Healthy Pullback Zones.
A retracement toward the Fibonacci 50% level or the 200-day moving average would remain technically healthy.
🛑 Stop Loss, 0.436 EGP.
A confirmed break below this major support invalidates the current bullish setup.
🎯 The Verdict:
INEG has delivered its first meaningful technical breakout after months of trading inside a downtrend channel. 📈
The current resistance zone is exceptionally important, and patience is warranted before chasing higher prices. ⚠️
A confirmed breakout above 0.534 EGP would significantly strengthen the bullish outlook and open the door toward higher targets. 🚀
Until then, expect consolidation or a healthy pullback before the next major move. 🛡️
---
If you like my insights, follow and boost! 🙌💙🚀
🎁 $15 TradingView Discount:
www.tradingview.com ✨💸🤑
ADPC: Distribution Phase Signals Patience Over Aggressive Buying📊 ADPC: Distribution Phase Signals Patience Over Aggressive Buying ⚠️
🏛️ Fundamental Review:
📊 Business Quality:
ADPC (Arab Dairy Products – Panda) is one of Egypt's best-known dairy and cheese producers, owning established consumer brands with broad nationwide distribution. The company operates in the defensive FMCG sector, where demand remains relatively stable throughout economic cycles. 🧀
✅ Strengths & Catalysts:
ADPC benefits from strong brand recognition and a well-established distribution network across Egypt. 📈
Annual revenue continues to grow, exceeding 3.0B EGP, supported by pricing adjustments and resilient consumer demand. 🏪
Expansion into regional export markets provides an additional source of hard-currency revenues. 🌍
⚠️ Risks:
The company continues to suffer from weak profitability due to high imported raw material costs and financing expenses. ⚠️
Its highly leveraged balance sheet remains one of the biggest concerns, with debt levels significantly above comfortable ranges. 📉
Margins remain highly sensitive to foreign exchange movements and global dairy commodity prices. 💱
🕌 Sharia Compliance:
🔴 ADPC is not considered Sharia compliant based on publicly available financial information. Although its core business is permissible, its financial structure appears to exceed commonly accepted Sharia leverage thresholds. ☪️
💰 Valuation:
While the stock appears inexpensive after a prolonged consolidation, the weak financial health and ongoing profitability challenges reduce its investment appeal. 💎
🔍 The Pulse:
ADPC has spent nearly the entire year trading inside a broad sideways range. 📊
The prolonged consolidation increasingly resembles a distribution phase rather than healthy accumulation. ⚠️
Despite operating in a defensive sector, the stock has failed to generate meaningful bullish momentum. 📉
The current technical structure does not justify committing fresh capital while stronger opportunities exist elsewhere in the market. 🚫
Rather than trying to predict a breakout, preserving capital should remain the priority until a confirmed trend reversal develops. 🛡️
🧱 The Key Structural Boundaries
⚠️ Current Structure.
The stock remains trapped inside a long-term sideways distribution channel.
📍 Preferred Strategy.
Avoid new positions until a confirmed bullish breakout supported by strong volume.
🚀 Bullish Confirmation.
A sustained breakout above the long-term consolidation range would be required before reassessing the outlook.
🛑 Risk Management.
Continue respecting the major support near 3.00 EGP as the structural invalidation level.
🎯 The Verdict:
ADPC is fundamentally challenged by weak profitability and elevated leverage despite owning valuable consumer brands. 📉
The current technical picture favors patience rather than accumulation. ⏳
Protect your capital and avoid becoming liquidity for stronger hands during this prolonged distribution phase. 🛡️
Wait for a confirmed breakout before considering any medium-term investment. 📈
---
If you like my insights, follow and boost! 🙌💙🚀
🎁 $15 TradingView Discount:
www.tradingview.com ✨💸🤑
 Short
Short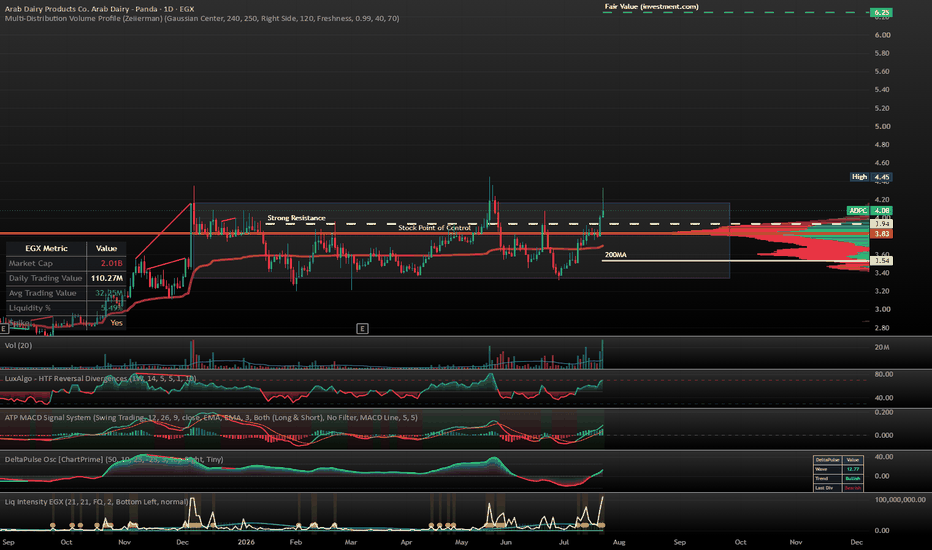
AMES: Strong Rally Needs Deeper Pullback Before the Next Bullis📊 AMES: Strong Rally Needs Deeper Pullback Before the Next Bullish Wave ⚕️
🏛️ Fundamental Review:
📊 Business Quality:
AMES is a leading private healthcare provider on the Egyptian Exchange, operating integrated hospital, surgical, and diagnostic facilities in Alexandria. The company benefits from the defensive nature of the healthcare sector and is backed by strong institutional shareholders. 🏥
✅ Strengths & Catalysts:
The company continues to improve its operating performance, delivering double-digit revenue growth and recovering profit margins. 📈
Healthcare remains one of the most defensive sectors, allowing AMES to maintain resilient demand regardless of economic cycles. 🛡️
Institutional ownership exceeding 96% provides long-term financial stability and supports future expansion plans. 🏆
⚠️ Risks:
The extremely low free float limits liquidity and can result in sharp price movements during periods of low trading activity. ⚠️
Operations remain exposed to imported medical equipment and foreign exchange fluctuations. 💱
The stock currently trades at premium valuation multiples, leaving less room for earnings disappointments. 📉
🕌 Sharia Compliance:
🟡 AMES operates in a Sharia-permissible healthcare business. However, sufficient public financial data is currently unavailable to conclusively verify compliance with the latest EGX33 Sharia financial screening criteria. ☪️
💰 Valuation:
Although the company's business quality remains attractive, the recent rally has pushed the stock above its historical valuation range, making technical entry timing increasingly important. 💎
🔍 The Pulse:
AMES experienced exceptional liquidity over the past month, driving the stock into a parabolic advance that reached a new all-time high near 144.94 EGP. 🚀
Following that rally, the stock entered a healthy correction and retraced toward the Fibonacci 38.2% level around 107.00 EGP. 📉
Last week confirmed that the correction is still underway. 📊
Despite the current pullback, I remain bullish over the medium term because the exceptional institutional and retail liquidity suggests the long-term trend remains intact. 💪
My long-term technical target remains around 245.00 EGP if the broader bullish structure continues. 🎯
However, momentum and volume indicators remain significantly overbought, suggesting the correction has not yet fully matured. ⚠️
I would prefer to wait for a deeper retracement toward the Fibonacci 61.8% level around 83.50 EGP before considering new entries. 📍
That area offers a much more attractive risk-to-reward opportunity for medium-term investors. ✅
🧱 The Key Structural Boundaries
📍 Preferred Entry Zone, 83.50 EGP.
The Fibonacci 61.8% retracement represents the preferred accumulation area.
⚠️ Current Outlook.
The correction appears incomplete while momentum indicators remain overheated.
🎯 Long-Term Target, 245.00 EGP.
The primary medium-term objective if the long-term bullish trend resumes.
🛑 Stop Loss, 66.00 EGP.
A confirmed close below this level invalidates the current bullish structure.
🎯 The Verdict:
AMES remains one of the stronger healthcare names on the EGX with improving operational performance and strong institutional backing. 🏥
The recent correction should be viewed as a healthy reset following a parabolic rally rather than a deterioration in fundamentals. 📈
Patience is warranted, as waiting for the Fibonacci 61.8% retracement around 83.50 EGP provides a significantly more attractive entry than chasing the current price. 🎯
Maintain disciplined risk management with a stop loss below 66.00 EGP. 🛡️
---
If you like my insights, follow and boost! 🙌💙🚀
🎁 $15 TradingView Discount:
www.tradingview.com ✨💸🤑
MOED: Strong Selling Pressure Keeps the Downtrend in Control📊 MOED: Strong Selling Pressure Keeps the Downtrend in Control ⚠️
🏛️ Fundamental Review:
📊 Business Quality:
MOED is a private K-12 education provider operating the Third Millennium Language Schools in Egypt. The company benefits from the defensive nature of the education sector but remains a small-cap, high-beta stock driven primarily by retail participation. 🏫
✅ Strengths & Catalysts:
The company has returned to profitability after reporting positive operating earnings during recent reporting periods. 📈
Demand for private education remains resilient due to stable student enrollment and annual tuition growth. 🎓
MOED continues to attract active retail trading, making it suitable for momentum-oriented traders. 💹
⚠️ Risks:
The company has a highly diluted capital structure with more than one billion outstanding shares, limiting earnings per share growth. ⚠️
Margins remain vulnerable to inflation, higher staff costs, and maintenance expenses. 📉
Government regulations continue to limit tuition fee increases, restricting pricing flexibility. 🚧
🕌 Sharia Compliance:
🟡 MOED operates a Sharia-permissible business within the education sector. However, sufficient public financial data is currently unavailable to conclusively verify compliance with the latest EGX33 Sharia financial screening criteria. ☪️
💰 Valuation:
The stock trades as a speculative penny stock where technical momentum currently has a greater influence than fundamental valuation. 💎
🔍 The Pulse:
Last week's heavy selling pressure confirmed the continuation of the existing downtrend. 📉
The technical structure remains weak, and I do not currently see any meaningful bullish signals. ⚠️
Investors already holding the stock should closely monitor the major support level at 0.728 EGP. 📍
A confirmed break below 0.728 EGP should be treated as an exit signal for the entire position. 🛑
If the stock experiences any temporary rebound before that happens, I would use the strength to reduce exposure rather than increase positions. 📊
The technical outlook will only improve after a confirmed breakout above the major order block around 0.835 EGP. 🚀
Until that level is reclaimed, the downtrend remains in control. 📉
🧱 The Key Structural Boundaries
⚠️ Main Support, 0.728 EGP.
A confirmed break below this level confirms further downside.
📍 Partial Exit Zone.
Use any technical rebound to reduce exposure while the stock remains below resistance.
🚀 Breakout Trigger, 0.835 EGP.
A confirmed close above the major order block would be the first meaningful bullish signal.
🎯 Trend Confirmation.
Only a sustained move above 0.835 EGP would shift the outlook from bearish to neutral or bullish.
🛑 Stop Loss, 0.728 EGP.
A confirmed close below this support level should trigger a full exit.
🎯 The Verdict:
MOED remains under technical pressure despite operating in a defensive sector. ⚠️
The current chart favors capital preservation rather than aggressive buying. 🛡️
Wait for a confirmed breakout above 0.835 EGP before considering new positions. 🚀
Until then, any rallies should be viewed as opportunities to reduce exposure rather than chase momentum. 📉
---
If you like my insights, follow and boost! 🙌💙🚀
🎁 $15 TradingView Discount:
www.tradingview.com ✨💸🤑
 Short
Short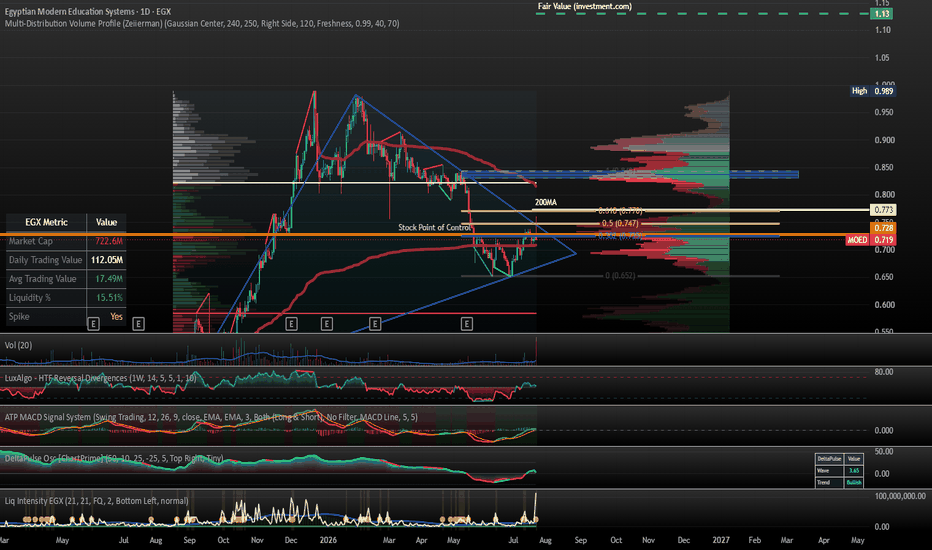
 Long
Long
EMFD: Descending Flag Signals Potential Breakout Toward New High📊 EMFD: Descending Flag Could Fuel the Next Breakout Toward New Highs 🚀
🏛️ Fundamental Review:
📊 Business Quality:
EMFD is one of Egypt's premier real estate developers and a subsidiary of Emaar Properties PJSC. The company develops landmark residential, hospitality, and mixed-use projects including Marassi, Mivida, Uptown Cairo, and Cairo Gate, making it one of the highest-quality real estate companies on the EGX. 🏗️
✅ Strengths & Catalysts:
EMFD delivered exceptional Q1 2026 results, with revenue increasing to 6.76B EGP while net profit surged 134% year-over-year to 7.77B EGP. 📈
The company maintains a cash-rich balance sheet that generated more than 6B EGP in finance and investment income during the quarter. 💰
Strong backing from Emaar Properties provides financial strength, execution capability, and one of the strongest brands in the regional real estate sector. 🏆
⚠️ Risks:
Operating margins remain sensitive to construction cost inflation and delivery expenses. ⚠️
The company focuses on premium real estate, making sales activity more dependent on luxury demand and Gulf investors. 🏘️
Management continues to prioritize reinvestment over cash dividend distributions. 📉
🕌 Sharia Compliance:
🟢 EMFD is a constituent of the EGX33 Shariah Index, indicating that it satisfies the EGX33 Sharia Supervisory Committee's business activity and financial screening requirements. ☪️
💰 Valuation:
EMFD continues to trade at an attractive valuation considering its earnings growth, asset quality, and dominant market position within Egypt's premium real estate sector. 💎
🔍 The Pulse:
EMFD is currently developing a descending flag pattern, which is typically considered a continuation pattern within an existing uptrend. 📊
The stock is waiting for a confirmed breakout before starting the next bullish leg toward new highs. 🚀
The main bearish scenario would be a confirmed break below the lower boundary of the flag. ⚠️
If that happens, the stock could retrace toward the unfilled Fair Value Gap around 10.50 EGP before buyers regain control. 📉
My preferred scenario remains a breakout above the upper side of the flag supported by strong trading volume. 💪
Such a move would provide the momentum needed to challenge and break the previous all-time high. 📈
🧱 The Key Structural Boundaries
🚀 Breakout Trigger.
A confirmed breakout above the upper boundary of the descending flag with strong volume signals the continuation of the primary uptrend.
⚠️ Bearish Trigger.
A confirmed break below the lower boundary of the flag increases the probability of filling the Fair Value Gap around 10.50 EGP.
📍 Fair Value Gap, 10.50 EGP.
A potential retracement zone where buyers could re-enter the market.
🎯 First Major Objective.
A successful breakout targets a new all-time high.
🎯 Long-Term Target, 15.75 EGP.
The primary technical objective for this year if the bullish trend continues.
🛑 Stop Loss, 9.75 EGP.
A confirmed close below the main support level invalidates the current bullish outlook.
🎯 The Verdict:
EMFD remains one of the strongest long-term investment opportunities in the Egyptian real estate sector. 🏆
Its outstanding fundamentals continue to support a bullish long-term outlook despite the current consolidation phase. 📈
The descending flag should be monitored closely, as a breakout accompanied by strong volume could trigger the next major advance toward new highs. 🚀
Until then, patience remains the best strategy while respecting the stop loss below 9.75 EGP. 🛡️
---
If you like my insights, follow and boost! 🙌💙🚀
🎁 $15 TradingView Discount:
www.tradingview.com ✨💸🤑
 Long
Long
ETEL: Blue-Chip Strength Remains Intact While 110 EGP Is the Key📊 ETEL: Long-Term Leader, But Wait for 110 EGP to Confirm the Next Rally 🚀
🏛️ Fundamental Review:
📊 Business Quality:
ETEL is Egypt's national telecommunications operator and the country's digital infrastructure backbone, providing fixed-line, mobile, internet, cloud, and international subsea cable services. It also owns a strategic stake in Vodafone Egypt, making it one of the highest-quality blue-chip companies on the EGX. 🌐
✅ Strengths & Catalysts:
The company continues to deliver outstanding revenue and earnings growth, supported by expanding data consumption, international USD-denominated cable revenues, and recurring income from Vodafone Egypt. 📈
Its dominant market position, government backing, and exceptional competitive moat make ETEL one of the strongest long-term growth investments on the Egyptian Exchange. 🏆
⚠️ Risks:
Short-term price volatility is usually driven by institutional profit-taking rather than deterioration in the underlying business. 📉
🕌 Sharia Compliance:
🟢 ETEL is a constituent of the EGX33 Shariah Index, indicating that it satisfies the EGX33 Sharia Supervisory Committee's business activity and financial screening requirements. ☪️
🔍 The Pulse:
ETEL should always be considered a core holding in a long-term investment portfolio. 🏛️
Its combination of strong fundamentals, government backing, and structural growth makes every healthy pullback a potential accumulation opportunity rather than a reason to panic. 🤝
Today's session printed a potentially dangerous candle, mainly driven by exceptionally strong trading volume resulting from an institutional block transaction around 104 EGP. 📊
As long as any pullback remains above 99.66 EGP, the overall bullish structure remains healthy. 💪
A confirmed close below 99.66 EGP would likely return the stock to the sideways trading range that dominated the previous weeks. ⚠️
If the bullish momentum continues next week, I would wait for a confirmed breakout and close above 110.00 EGP before adding new positions. 🚀
A successful breakout above 110.00 EGP would open the way toward the next major technical target near 130.00 EGP. 🎯
🧱 The Key Structural Boundaries
📍 Healthy Pullback, 99.66 EGP.
Holding above this level keeps the current bullish structure intact.
🚀 Breakout Trigger, 110.00 EGP.
A confirmed close above this level signals the beginning of the next bullish leg.
🎯 Final Target, 130.00 EGP.
The next major long-term technical objective.
⚠️ First Warning, 99.66 EGP.
A confirmed close below this level returns the stock to its previous consolidation range.
🛑 Stop Loss, 93.33 EGP.
A confirmed close below this level for two consecutive trading sessions invalidates the current bullish setup.
🛡️ Risk Note.
The stop loss is intentionally placed well above the 200-day Moving Average, currently around 77.30 EGP, to avoid unnecessary exits during sharp retail-driven panic selloffs.
🎯 The Verdict:
ETEL remains one of the highest-quality investment opportunities on the EGX and deserves a place in long-term portfolios. 🏆
Any controlled pullback should be viewed as an opportunity to accumulate rather than a change in the long-term trend. 📈
A confirmed breakout above 110.00 EGP would provide the strongest technical signal for the next advance toward 130.00 EGP. 🚀
Risk remains well managed with a disciplined stop below 93.33 EGP confirmed over two consecutive trading sessions. 🛡️
---
If you like my insights, follow and boost! 🙌💙🚀
🎁 $15 TradingView Discount:
www.tradingview.com ✨💸🤑
 Long
Long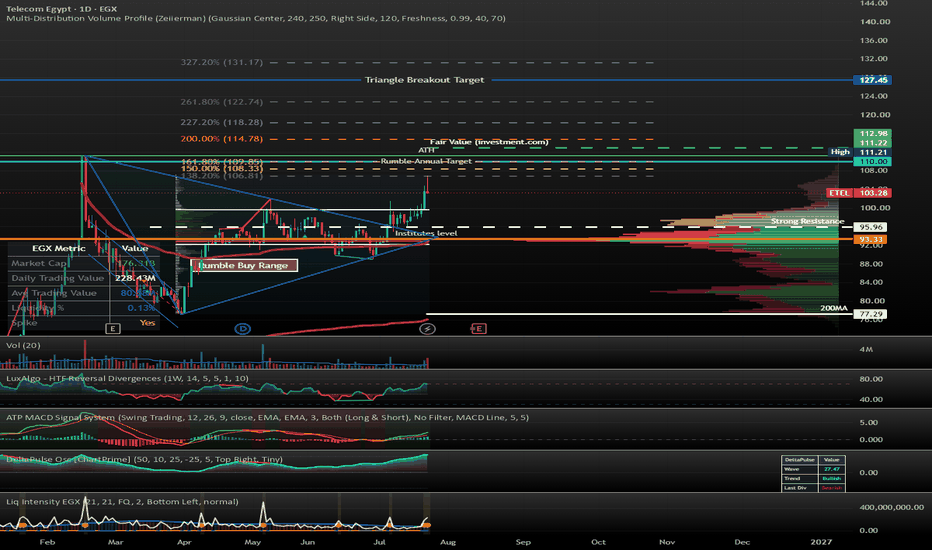
ATQA: Strong Liquidity Breakout, But Key Resistance Still Ahead 📊 ATQA: Strong Liquidity Breakout, But Key Resistance Still Ahead ⚠️
🏛️ Fundamental Review:
📊 Business Quality:
ATQA is a leading Egyptian steel producer specializing in steel rebar and wire rods, benefiting from long-term infrastructure and construction demand. 🏗️
✅ Strengths & Catalysts:
The company returned to profitability in Q1 2026 while maintaining a conservative balance sheet with a low debt-to-equity ratio. 📈
Its dominant institutional ownership provides financial stability and supports the long-term investment case. 💪
⚠️ Risks:
Steel margins remain highly sensitive to billet, scrap metal, and energy prices. ⚠️
The stock also has a relatively limited free float, which can increase volatility during periods of heavy trading. 📉
🔍 The Pulse:
After several weeks of consolidation around the major support at 9.57 EGP and the 200-day Moving Average, ATQA finally delivered a bullish breakout. 🚀
Today's breakout was supported by approximately 90M EGP in trading value, almost three times the average daily liquidity, making this an encouraging first signal. 📊
However, I still believe the stock must overcome several major resistance levels before confirming a sustainable uptrend. ⚠️
During the coming week, I want to see continued strong liquidity to support further upside. 💪
The first major confirmation will be a close above the 61.8% Fibonacci resistance at 10.26 EGP. ✅
A breakout above this level could justify an initial position with a stop loss at 9.80 EGP. 📍
The second confirmation will be a breakout above the long-term descending trend line, where additional exposure can be considered after confirmation. 📈
The next major obstacle is the strong resistance around 11.15 EGP, followed immediately by a bearish Fair Value Gap. 🚧
Clearing these resistance levels would open the way toward a retest of the all-time high near 12.38 EGP. 🎯
🧱 The Key Structural Boundaries
📍 Initial Entry, 10.26 EGP.
A confirmed close above the 61.8% Fibonacci level provides the first buying opportunity.
🚀 Second Confirmation.
A confirmed breakout above the long-term descending trend line strengthens the bullish case and supports increasing the position.
⚠️ Major Resistance, 11.15 EGP.
A key supply zone before the bearish Fair Value Gap.
🚧 Bearish Fair Value Gap.
The final technical barrier before the stock can challenge its previous highs.
🎯 Final Target, 12.38 EGP.
A retest of the all-time high.
🛑 Stop Loss, 9.80 EGP.
A confirmed close below this level invalidates the current bullish setup.
🎯 The Verdict:
ATQA has delivered its first meaningful bullish signal after a prolonged consolidation phase. 🏆
The strong increase in trading liquidity is encouraging, but additional confirmation is still required before becoming aggressively bullish. 📈
Following a staged entry strategy by increasing exposure only after each confirmed breakout offers a more disciplined approach. 🤝
Protect capital with a firm stop below 9.80 EGP while monitoring liquidity closely throughout the coming sessions. 🛡️
---
If you like my insights, follow and boost! 🙌💙🚀
🎁 $15 TradingView Discount:
www.tradingview.com ✨💸🤑


