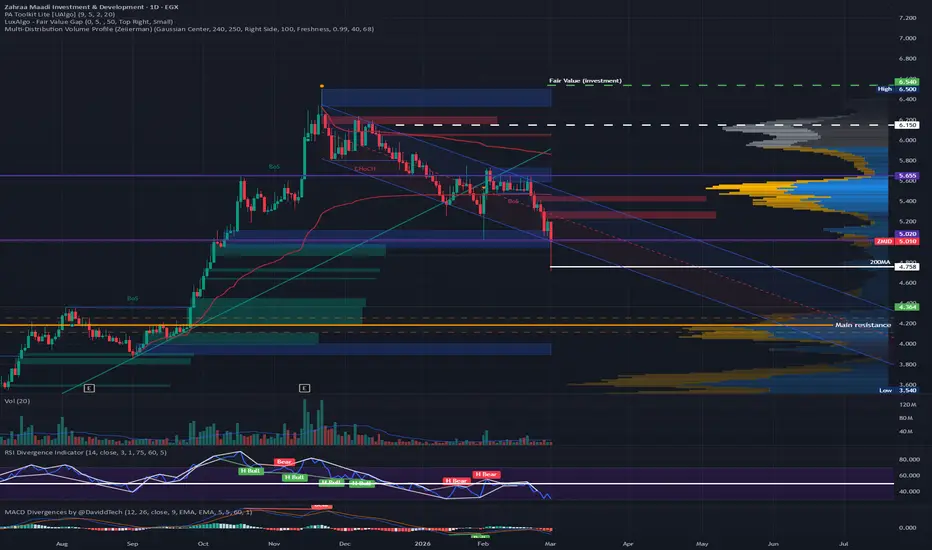
FTNS Reaching a Potential Historic Bottom — Opportunity with StrSure, here’s the translation for you:
Fitness Prime (FTNS) Stock Analysis
Currently, the stock seems to have reached its historical bottom, and it’s expected not to revisit this level for at least the next two years. This could be a good opportunity to adjust your average cost.
However, it’s important to keep risk management in mind, especially given the presence of negative news that may impact the stock’s performance.
Important Note: This is not financial advice; it is purely a technical analysis.
ATQA— Breakout & Go Trigger: 1H/Day close ≥ 10.40
• Stop-loss: 10.05 (tight) or 9.84 (conservative under shelf)
• Targets: T1 10.70 · T2 10.95 – Extended -11.80
• Confluences (3):
• Clear break of the recent range/flag top near 10.35–10.40.
• Reclaim and ride of daily upper Bollinger with EMAs stacked.
• Rising volume on the breakout (look for ≥2× 20-day average).
Long EPCOHigh probability setup in here.
The definite thing is the long setup. The short setup iam 60% sure it will play out as identified.
So put alert on the green box if you are only interested in the long setup, mean while you can take the short position if its interesting enough for you.
Good luck everyone !!
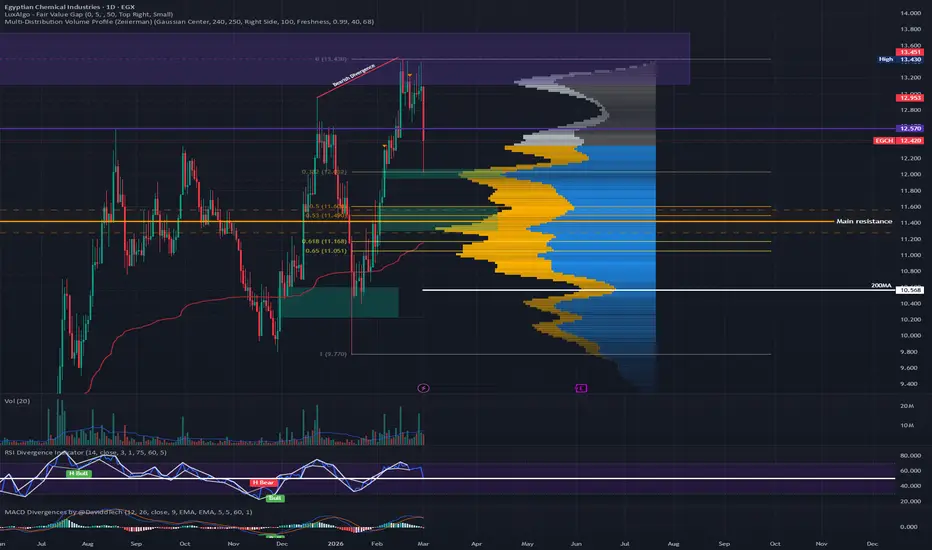
EGCH - is that a game ?! - its stocks market .EGX:EGCH - 1-week timeframe
Multiple patterns and indicators show conflicting results.
Prices often closed daily above 12.00 but failed to do so weekly.
My recommendation from two months ago:
Sell around 11.00 and rebuy if prices close weekly above 12.00.
So far, prices haven't closed weekly above 12.00.
However, this approach may reduce readability for investors.
ODIN to target 3.4 after crossing 2.3Weekly chart,
for long term investment under the condition the stock closed above 2.30 for 2 weeks.
MACD is positive,
while RSI is showing over-bought - so, a minor correction is probable before the stock overcomes the resistance zone at 2.25 - 2.30
After crossing 2.30, the next resistance levels will be 2.60 - 2.65 , then 3.00 and 3.40
A new buy is after crossing, or at present value around 2.18 - 2.24 with near Stop Loss (2.16)
NOTE:
--- Be cautious with this stock, protect your profit as the price goes up.
Long EHDRAs identified areas to long from. This is a breakout long position which should be awesome in terms of RR. However, i identified two buy areas as accurate as possible and this should be good.
What stresses me out is that mwe might wick through the stoploss, so i have my indvalidation level identified but since my invalidation is way too far from my entry, and if stoploss is stretched to that invalidation level then the RR turns to 1:1.85 which is not worth it.
Maybe re-evaluate taking another entry if the first stoploss got hit?
Anyways, we re-evaluate if it happens, which is little chance tbh of it happening, i think.
Good luck everyone !!
AMOC - Conditional 9.9 and 13.3 with cautiousWeekly chart,
I can see a descending triangle pattern. The technical indicators: RSI is neutral, MACD is under 0 line. So, new entry should be after closing above 7.25 with high volume for 2 weeks.
The medium and long term targets will be 9.9 then 13.3 passing through some resistance levels including 11.9 and 12.5
Stop loss is 6.70, and raise the profit protection level as the price goes up.
Emaar Misr (EMFD): Bullish Continuation Within Ascending ChannelTechnical Outlook: The stock is moving perfectly inside a rising parallel channel. We recently saw a strong bounce from the channel support at 8.60, triggering a Supertrend BUY signal. The price is now challenging the 9.90 level with strong momentum.
Key Indicators:
Supertrend: Bullish support at 8.90.
MACD: Showing a bullish crossover and increasing momentum.
Stoch RSI: High, indicating strong buying power, though we watch for divergence.
Strategy: I am looking for a continuation of this move towards the upper channel boundary.
Target 1: 10.50 (Previous High)
Target 2: 11.20 (Channel Top)
Invalidation: A daily close below 8.85 would invalidate this bullish thesis.
Disclaimer: This is for educational purposes only and not financial advice. Trade at your own risk.
CORRECTION ENDED AND BULLS ARE IN CONTROL Hello Traders,
as we could dee the huge down trend after reaching the 90 level and retested again to 109 and kept going down for the correction for the 2nd wave from 50 to almost doubled now w e are at the last wave which would be 100 of wave 1 my targets are 3 levels and im getting slowly 70%at the first target then 20 then 10 at last my stop loss is 62 and let it run baby
INVERTED HEAD AND SHOULDER PATTER CONFIRMED Hello Traders,
this is my second view for this stock ,i really don't like it and i don't like the way it moves lately however recently we saw a clear sign for ending the bearish moves and start to see some bullish moves for me i wouldn't convinced tell it moves above the 3 pounds with close and good volume to enter for you is optional now stop loss 2.6 take profit at 3.6 good luck
EFG Holding (HRHO) – Weekly Long Setup: Breakout PotentialEFG Holding (HRHO) – Weekly Analysis
Price is currently moving inside a long-term ascending channel, respecting both trendline support and Ichimoku cloud structure. After the recent correction from the 28.90 zone, the price is stabilizing above the trendline and inside the cloud — a typical consolidation before a potential continuation move.
📌 Entry Zone
Entry #1: Around 26.40 (current market price)
Entry #2 (Aggressive): 24
🎯 Take-Profit Targets
TP1: 29.90
TP2: 31.91
TP3: 34.93
Targets match major resistance levels + previous swing highs on the weekly chart.
🛡️ Stop-Loss
Below 23.20 (trendline + Ichimoku cloud support)
🔍 Technical Signals
Price holding the Weekly Kumo (Ichimoku) → bullish structure maintained
Supertrend still positive on weekly timeframe
MACD showing early signs of momentum recovery
StochRSI in oversold reversal zone → possible upside push
📈 Bias
Bullish as long as price remains above the ascending trendline and weekly cloud.
This setup becomes stronger if we get a weekly close above 29.00, confirming continuation toward TP2 & TP3.
⚠️ Disclaimer
This is not financial advice. Purely educational technical analysis based on chart structure.
Back to the Bottom of the ChannelHello Traders,
the market this days is going alot and its uncertain as well the contortion for the rising is slowing and its time for the correction some of the stocks use this correction for growing especially the under valued ones like this stock its almost 50% discount and its at the bottom for the rising channel great opportunity to buy now if you like the risk i will jump in small portion and see my targets is the top part of the channel.
my entry will be 25% now at 20.7 and another 25% at .20 and 50% at 18.1 my stop loss is at 15.8
and my take profit 50% at 24.5 and we update from here
good luck
Long and short Ok.
This is a good long with my confidence level is about 85% in this trade.
Havent done much analysis for the short position, but based on the market analysis, it should play this way.
for the long position though, start tracking the price once the price reaches the first gray box, confirm on the 1h tf for entries.
AIH AnalysisOk, as predicted before long ago, i gave you a good entry at 0.46, but i think there still good chance to make some money in here. Iam very much looking to take this trade, that's why i did some fundamental analysis on this stock which turned out to be a low cap stock.
Ok, lets run quickly through some facts:
1- Economy is doing great in Egypt in general, and its expected a rate cut by Q4 2025.
2- The company previous FY of 2024 ended with a total loss of almost 24 million. Q1 2025 was at loss of almost 1 million
3- There will be Q2 statement and if the company in profit it will be a plus (which is actually very hard to expect, but if its in red with 1 or 2 million EGP i still think it will not be a problem), which might offer an entry point.
To sum it up: 2024 in total loss of 24 million, now Q1 is only 1 million in loss, with expectations that the economy as a whole will do better, so this company also is expected to be in profit later down the road, which explains the surge in price.
Technically,
- This chart took more than 2 hours to understand what is going on and how we should proceed from here.
So there are two case scenarios in here, as iam technically expecting this surge to continue until at least 0.96 to 1 Egp. But of course on the technical level it will never be a straight line to 1 EGP.
So from where the price is at right now.
- Broke a huge down trendline (bullish)
- We are above weekly upper VAH (bullish)
- VWAP is reversing upwards (bullish)
- Recent liquidity has been taken (bullish)
!! Worrying, there are some huge liquidity areas under the trendline, but if whales crashing the stock to reach those areas, i would be amazed.
Now to go deep into details,
we will assume that the price closed above A1 (orange line, on the Daily and Weekly, early sign will be daily), also didn't stretch much or even beyond that zone 1, or the yellow box and will start correcting, there are three areas of interest
1- The black area, this area is not very important as the price could always ignore it (even though its Value area high VAH) and heads to an area which is more liquid and have much higher volume, however, it cant be ignored, so i would put very small amount of money into this zone.
2- The Orange area, now that's an important area as it is the 0.5-0.618 Fib level, break out of a micro trendline and this area has the potential to become a Resistance turned into Support, Additionally iam anticipating VWAP to reach that Orange area by the time price reaches this area. Further, This area has some volume, but not major.
(entry will be discussed later but if you want use the VWAP on the weekly TF as a guide along with volume, then volume spikes and increasing in volume in this area on lower tf once the price touches the VWAP on the weekly have very good hit rate)
3- The Blue area, now thats an interesting area because thats the High Volume Node on the Weekly timeframe, which means bears will face a fierce resistance to break it to the downside also 0.78 Fib level.
Now we assume that the price closed above the A1 on the weekly, and preferably above the yellow area.
then we shift our thinking into longing from this yellow zone and we will have our stoploss under the Orange area. And if you want to snipe the entry, there is a purple line in the middle of the yellow box, now confirm on lower tf once price touch this line, and look for a stoploss below this black box.
Iam very confident that the bears will take some control in the red box marked above and we will have some reaction here, but iam not sure if i should be selling everything in this level, maybe we can take some profit and rotate back during correction, will update when the time comes.
Side way Breaks to new all time high Hello Traders,
i can see big volume compared to the monthly trading at the ending of side way markets which will lead for a continuation for the bullish trend targets is already mentioned and it depends what you are investing for short intermediate long if we break the discount area we well go for big correction advice to sell with the retest however if we breaks the discount area huge profits coming. if you like the idea kindly show your support for more ideas to come good day.
Inverted Head And 2 Shoulders BULLISHHello Traders,
i know it is something outside the box however we all looking now for the fresh winnings as you all know w e have reached all our targets and we closing all the positions now locking the profits in our group however i found this paper very interesting if you are looking in to it you will see the pattern and the increasing of buying pressure the only thing missing is the volume up once i get this its a green indication forthe price reaching all time high again
good luck boys