Long
Long
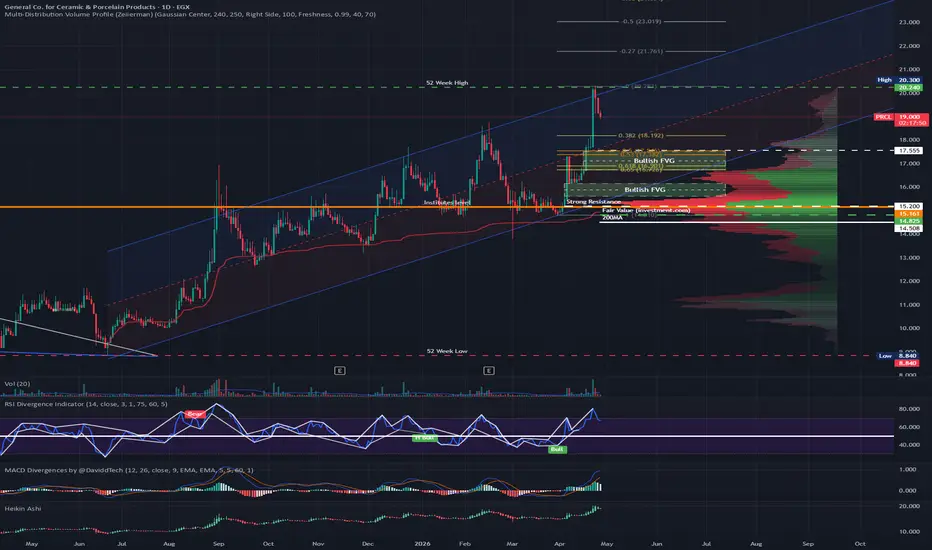
ISMA – Overbought & Testing the 52-Week High ISMA – Overbought & Testing the 52-Week High 📉🐔
The Reality: I see a "Technical Trend Play" that is currently flying high but carrying heavy fundamental baggage. 🎈
While consolidated profits for FY 2025 surged 21.5% to EGP 45.64 million, the operational reality remains a struggle against high input costs.
I note that feed (Yellow Corn & Soy) accounts for a staggering 60% to 70% of production costs, making margins hypersensitive to CBOT futures and USD/EGP stability. 📉🌽
The Euphoria Risk: I observe that the stock is currently trading ATH, having gained over 150% in the past year.
However, with an RSI of 80s, all technical indicators are screaming "Overbought."
This move looks increasingly like euphoria, especially as it has reached annual fair value targets. 🚩💨
The Debt Hurdle: I find the balance sheet to be a major risk factor.
With a debt-to-equity ratio around 62%,
ISMA is heavily leveraged to fund its capital-intensive expansion and feed imports.
This high leverage is particularly dangerous in Egypt's 2026 high-interest-rate environment. ⚓💸
Sharia Status: ❌ Non-Compliant. I confirm that ISMA is excluded from Sharia indices. ☪️🚫
Technical Analysis:
The Overbought Signal: I've identified an RSI of 84.8, which is deep into the danger zone.
In my experience, moves this steep without consolidation often end in a "Strong Bearish Wave" rather than a gentle pullback. 📉⛈️
The Entry Zone: I am targeting the 16.45 support level for a potential entry. 🎯🗝️
This aligns with historical price action and would allow the overbought indicators to reset to a healthier range. ⚓🧗
The Safety Floor: I see 17.80 as the first minor support, but I don't believe it will hold if the profit-taking begins. 🧱🩹
The Liquidity Factor: I note that volume has been high (around 2.19M), but as liquidity starts to dry up at these peaks, the exit door gets very small. 🚪🏃♂️
Verdict: I classify ISMA as a "Technical Pass." 🏗️🏎️
I will not be tempted by the bullish momentum at these levels.
I am keeping my eyes on 16.45 and waiting for the "Euphoria" to fade before putting any capital at risk. 🛡️🔝
If I like my posts, I follow and boost 🙌✨
🎁 Get a $15 discount on my next subscription:
🔗 www.tradingview.com ✨💸  Short
Short
 Long
Long
 Long
Long
 Long
Long
 Long
Long
 Long
Long
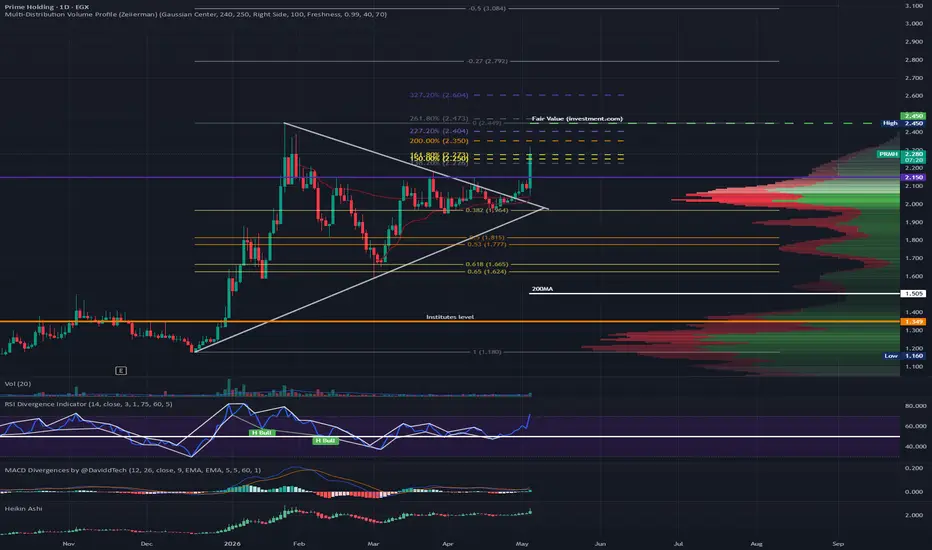
TAQA – Breakout Above 13.70 Resistance TAQA – Breakout Above 13.70 Resistance 📉⚡
The Reality: I see a "Fundamental Anchor" leading Egypt’s energy distribution across gas, electricity, and refined products.
I note that TAQA is currently benefiting from the national gas grid expansion and the privatization of the electricity market, while shifting focus toward EV charging infrastructure and green hydrogen in 2026.
The Utility Engine: I recognize that while high CapEx for grid expansion keeps immediate margins stable, the utility-based nature of the business ensures efficient conversion of operating profit into cash.
I find the earnings highly reliable as they are almost entirely driven by core energy distribution with no reliance on "non-recurring" fluff.
The Debt Sensitivity: I observe that TAQA carries a notable debt load to fund its multi-sector expansion.
In the high-interest-rate environment of 2026, this makes the company sensitive to financing costs, though I find the recurring cash flows from projects like Taqa Water and Taqa Power provide a solid safety net.
The Valuation: I find the 18.50 EGP Final Target reflects a "First-Mover" premium.
By applying an 18.5x P/E multiple to a forward EPS of 0.97 EGP, I am pricing in its dominant role in private power and its aggressive pivot toward renewables.
Technical Analysis:
Resistance Shattered I am riding the momentum wave.
The Breakout: I noticed the price finally cleared the 13.70 resistance with conviction today.
The Fibonacci Hurdles: I am looking for a solid close above 13.90 (50% Fib) to confirm the next leg.
Once cleared, I’ve identified 14.50 as the primary intermediate target before checking the 52-week high.
The Growth Engine: I find the pivot to green energy and EV charging to be a significant technical catalyst that could re-rate the stock's multiple toward my 18.5x estimate.
The Safety Floor: I now view 13.70 as the new support level.
As long as we stay above this, I believe the bullish momentum remains intact.
Sharia Status: ✅ Confirmed Compliant.
I confirm that TAQA Arabia is a verified member of the EGX33 Shariah Index.
Verdict: I classify TAQA as a "Fundamental and Technical Buy." I am moving my focus toward the 14.50 level and eventually the 18.50 fair value. I see this as a high-quality breakout supported by a real-world infrastructure pivot.
If I like my posts, I follow and boost 🙌
🎁 Get a $15 discount on your next subscription:
🔗 www.tradingview.com ✨💸
 Long
Long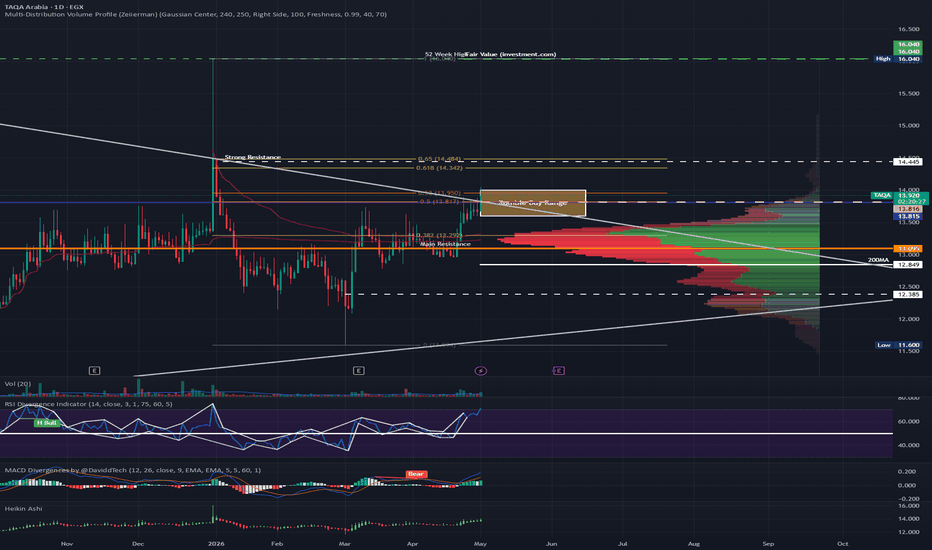
 Long
Long
 Long
Long
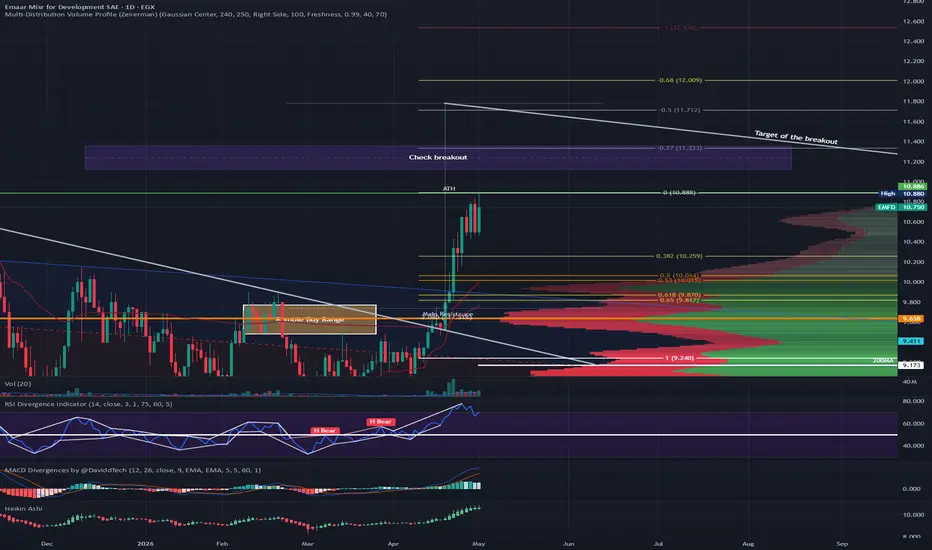
SKPC – Fundamental Strength vs. The 2.5-Year Downtrend SKPC – Fundamental Strength vs. The 2.5-Year Downtrend 📉🧪
The Reality: I see a "Vital Industrial Anchor" that is navigating a complex recovery phase.
While 2025 saw a painful 55.38% decrease in net profit (down to EGP 1.133 billion), the outlook for 2026 is much brighter. I note that export expansion into 57 countries, including success in South American markets, is the primary engine for the projected 1.45 EGP EPS recovery.
The Fundamental Fortress: I recognize SKPC as a high-quality entity, recently named one of Forbes' "50 Strongest Companies in Egypt 2026".
I find its balance sheet exceptionally resilient; it maintains low debt and high operational efficiency, converting profit into cash effectively within a high-demand domestic market.
Technical Analysis:
Fighting the Gravity of the Channel, I am waiting for the breakout.
The Downtrend: I've identified that the stock has been trapped in a bearish channel for 30 months.
While recent volume spikes are positive, they have not yet shifted the structural trend.
The Confirmation Levels: I believe the trend only shifts above 19.20. I am looking for a high-volume break of 20.00 to signal that the long-term "Correction" is over and the new bullish cycle has begun.
The Safety Floor: I see 17.60 as the immediate line in the sand.
If the stock falls below the main support at 16.85, I believe the bearish trend will accelerate.
The Liquidity Factor: I note that daily liquidity is fair at ~0.5% of market cap, but I am wary of "Greed Traps" in the current market environment.
The Strategy: I am staying on the sidelines for now.
I need to see the stock trade above 19.20 and ideally break the 20.00 mark to confirm a "Change of Character" (ChoCh) and a definitive break of the long-term downtrend.
I view 17.60 as short-term support, with the "Must-Hold" level at 16.85.
Sharia Status: ✅ Confirmed Compliant.
I confirm that SKPC is an active member of the EGX33 Shariah Index.
It successfully passes all screens: its core business is permissible, its interest-bearing debt is below the 33% threshold, and its interest income stays under the 5% limit.
Verdict: I classify SKPC as a "Fundamental Buy" but a "Technical Pass".
I will not enter at these levels.
I am waiting for a definitive Change of Character above 20.00 to target the 21.50 fair value with a much higher probability of success.
If I like my posts, I follow and boost 🙌
🎁 Get a $15 discount on your next subscription:
🔗 www.tradingview.com ✨💸  Short
Short
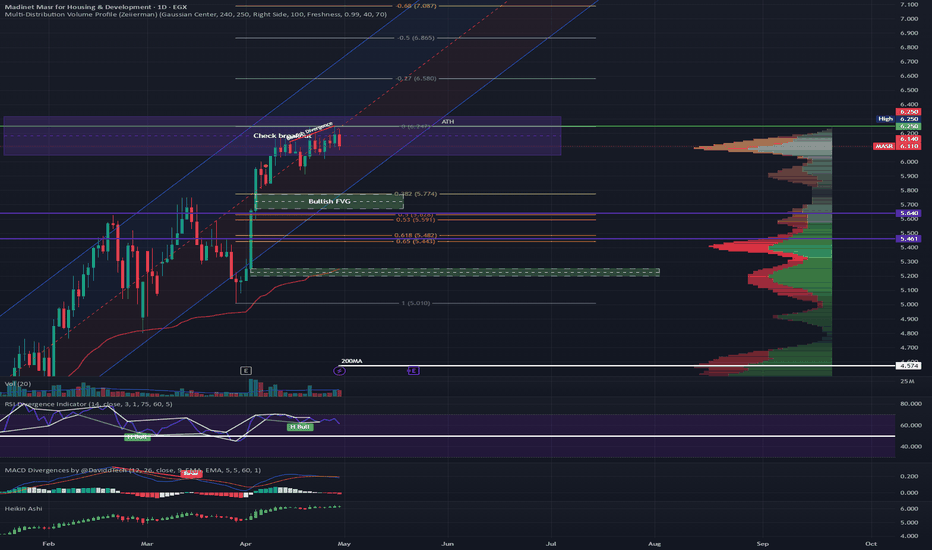
MASR – ATH Resistance vs. Bearish Divergence MASR – ATH Resistance vs. Bearish Divergence 📉🏙️
The Reality: I see a "Real Estate Cornerstone" thriving in East Cairo, particularly with the Taj City and Sarai projects.
While the stock has surged to 6.11, I note that cash flow is heavily committed to accelerated project deliveries, meaning profits are currently more "accounting-based" (Percentage of Completion) than liquid cash.
The Fundamental Moat: I recognize MASR as a "Safe Haven" for local liquidity. Its massive land bank acts as an inflation-protected store of value against EGP volatility.
The core business is exceptionally robust, driven purely by residential sales rather than financial engineering.
The Margin Pressure: I observe that MASR is sensitive to global Steel and Cement prices, which are influenced by international energy costs.
Additionally, rising receivables from extended payment plans and high debt used for expansion make it sensitive to Egypt's 2026 high-interest-rate environment.
Sharia Status: ✅ Confirmed Compliant. I confirm that MASR is a consistent and liquid member of the EGX33 Shariah Index (May 2026).
Its business model and financial ratios align with Islamic investment standards.
Technical Analysis:
Uptrend Exhaustion, I am looking for the "Golden Entry."
The Divergence: I’ve spotted a classic bearish divergence on both the RSI and MACD while the price is at an ATH.
This usually precedes a healthy cooling-off period.
The Liquidity Trap: I find it concerning that price is increasing while daily liquidity is decreasing.
This suggests the current move lacks the institutional "fuel" to sustain a breakout.
The Target Entries: I see a good entry point at 5.46.
If the market sees a deeper pullback, I find 5.20 to be an exceptional level to build a position in this fundamental powerhouse.
The Trend: I note the stock remains in its uptrend channel, trading exactly in the middle. I expect a test of the lower boundary before the next major bullish leg.
Sharia Confirmation: ✅ Compliant. I confirm its status as a core member of the EGX33 Shariah Index.
Verdict: I classify MASR as a "Fundamental Buy" but a "Technical Wait."
I am not entering at 6.11.
I will wait for a pullback to 5.46 or 5.20 to capitalize on the 60% fair value potential with a much safer risk profile.
If I like my posts, I follow and boost 🙌
🎁 Get a $15 discount on your next subscription:
🔗 www.tradingview.com ✨💸
 Long
Long