ORAS: Bullish Setup Building Below the Upper Band 📊 ORAS: Bullish Setup Building Below the Upper Band 🚀
🏛️ The Fundamentals:
ORAS remains one of the most attractive large-cap infrastructure plays on the EGX, with strong hard-currency exposure, a massive backlog and attractive valuation multiples relative to the Egyptian sector. 💰
Even after the recent parabolic wave, the stock still appears relatively cheap compared with sector valuations, although the technical rally means patience is important. 📊
📈 The Pulse:
After the parabolic wave, ORAS pulled back from the ATH and reacted from the first Fibonacci support around 680 EGP without breaking it, which is a very positive sign. 📐
At the same time, price has not yet broken the first Fibonacci level of the current pullback around 730 EGP, keeping the stock in a sideways consolidation phase. 📊
Price is now entering a squeeze pattern while trading just below the upper Bollinger Band, which could set up the next expansion move. 🔥
For me, the key signal will be a breakout from this consolidation supported by strong trading volume. 🚀
A confirmed high-volume breakout would provide the entry signal and could restart the broader bullish wave. 📈
For medium-term investors, the current consolidation zone is also a reasonable area to consider building a position, provided the risk level is clearly defined. 🎯
🧱 The Key Structural Boundaries:
Breakout Trigger: High-volume breakout above the current squeeze and the 730 EGP area 🚀
First Target: 812 EGP, the ATH, Investing.com fair value and Faisal Bank annual target 🎯
Second Target: 850 EGP, my calculated fair value 💰
Final Target: 890 EGP, Rumble annual target 🚀
🛡️ Risk Management:
My stop-loss is a confirmed break below the strong 680 EGP support level. 🛑
As long as ORAS holds above 680 EGP, the broader bullish structure remains intact. 📈
🎯 Verdict:
ORAS remains one of my preferred large-cap infrastructure plays because the fundamentals and valuation continue to support the long-term bullish thesis. 💰
Technically, the 680 EGP level has been strongly defended, while the 730 EGP level remains the key resistance that needs to be cleared. 📊
I want to see the breakout confirmed by strong volume before treating the move as the next major bullish wave. 🚀
For medium-term investors, this setup is attractive as long as the 680 EGP structural support remains intact. 🛡️
The roadmap is 812 EGP, then 850 EGP, followed by 890 EGP if momentum remains strong. 🎯
If you like my insights, follow and boost! 🙌💙🚀 🎁 $15 TradingView Discount: www.tradingview.com ✨💸🤑
 Long
Long
 Long
Long
OLFI: Textbook Pullback Sets Up the Next Bullish Wave📊 OLFI: Textbook Pullback Sets Up the Next Bullish Wave 🚀
🏛️ The Fundamentals:
OLFI remains a strong defensive FMCG name, supported by its market position, resilient consumer demand and attractive dividend profile. 🧀
At current levels, the valuation remains reasonable on earnings, although the elevated P/B ratio means the stock is not a classic deep-value play. 💰
📈 The Pulse:
The good news is that today's liquidity reached around EGP 90M, roughly double the recent average, confirming strong market participation. 💰
Technically, the pullback has been textbook, with price reacting positively from the 61.8% Fibonacci retracement level. 📐
This reaction keeps the broader bullish structure intact and suggests that buyers are still defending the uptrend. 📈
As long as the stock holds its major support and 200MA, I remain positive on the setup. 🔥
🧱 The Key Structural Boundaries:
Breakout / Continuation: Sustained bullish momentum above the recent reaction zone 🚀
First Target: 26.50 EGP, the ATH and Investing.com fair-value area 🎯
Second Target: 28.00 EGP, my calculated fair value 💰
Final Target: 30.00 EGP, the Fibonacci extension target 🚀
🛡️ Risk Management:
My stop-loss is a confirmed break below the 200MA and the main support around 22.80 EGP. 🛑
As long as price remains above this level, I consider the current pullback healthy and the bullish structure valid. 📊
🎯 Verdict:
OLFI is showing exactly the type of pullback I want to see after a strong bullish move. 📈
The reaction from the 61.8% Fibonacci level combined with today's strong liquidity makes the setup technically attractive. 🔥
The first major objective is the 26.50 EGP ATH, followed by my 28 EGP fair value and the 30 EGP Fibonacci extension target. 🎯
For me, the trade remains valid while OLFI holds above 22.80 EGP and the 200MA. 🛡️
If you like my insights, follow and boost! 🙌💙🚀 🎁 $15 TradingView Discount: www.tradingview.com ✨💸🤑
 Long
Long
SAUD: Final Resistance Could Trigger a Major Breakout 📊 SAUD: Final Resistance Could Trigger a Major Breakout 🚀
🏛️ The Fundamentals:
SAUD remains one of the strongest fundamentally positioned banking stocks on the EGX, with attractive valuation multiples relative to the banking sector and strong profitability. 💰
The main weakness is liquidity, as the limited free float of around 25% restricts trading activity and can make entries and exits less flexible. ⚠️
📈 The Pulse:
SAUD has been showing positive momentum over the last couple of weeks, supported by improving market sentiment and renewed buying interest. 📈
At around 23 EGP, the stock is approaching the strong resistance zone at 23.36 EGP, which I consider the last major barrier before a much more bullish continuation. 🚀
A confirmed breakout above 23.36 EGP would significantly strengthen the bullish structure and could open the way toward new all-time highs. 🔥
For a better risk-to-reward entry, I would prefer a pullback toward 23 EGP rather than chasing the breakout. 🎯
If the resistance breaks with strong momentum, the technical setup becomes considerably more attractive. 💥
🧱 The Key Structural Boundaries:
Breakout Trigger: 23.36 EGP 🚀
First Target: 25.50 EGP, the ATH 🎯
Second Target: 27.00 EGP, my calculated fair value 💰
Final Target: 28.00–28.50 EGP, Investing.com / fundamental fair-value area 🎯
🛡️ Risk Management:
My stop-loss is a confirmed break below the main support around 21.93 EGP. 🛑
As long as SAUD holds above this support, the bullish structure remains intact. 📈
☪️ Sharia Compliance:
STATUS: COMPLIANT
Al Baraka Bank Egypt operates according to Islamic Sharia principles and has a dedicated Sharia Supervisory Board that reviews the bank's operations and products.
🎯 Verdict:
SAUD combines strong fundamentals, attractive banking-sector valuation and improving technical momentum. 💎
The limited free float and relatively low liquidity are the main concerns, so I would prefer buying a pullback toward 23 EGP rather than chasing the price. 🎯
A confirmed breakout above 23.36 EGP would make the setup significantly more bullish, with 25.50 EGP as the first major target. 🚀
Above the ATH, 27 EGP becomes the next valuation target, followed by the 28.00–28.50 EGP fair-value zone. 💰
For existing shareholders, I would remain invested while the stock holds above 21.93 EGP. 📊
If you like my insights, follow and boost! 🙌💙🚀 🎁 $15 TradingView Discount: www.tradingview.com ✨💸🤑
 Long
Long
 Long
Long
 Short
Short
JUFO: Double Top at the Channel High, Key 25.80 EGP Level Ahead 📊 JUFO: Double Top at the Channel High, Key 25.80 EGP Level Ahead ⚠️
⚡ The Pulse:
I don't need to explain how strong JUFO is fundamentally, as the company's quality and defensive position are already well established. 💎
Technically, the stock is currently trading near the upper band of its uptrend channel, where price action is becoming more sensitive to profit-taking. 📈
A potential double-top pattern has formed, and a confirmed break below 25.80 EGP would validate the pattern and increase the probability of a deeper correction. ⚠️
If 25.80 EGP holds, the stock may instead continue moving sideways, which would be healthy because it allows the indicators to cool down after the previous bullish wave. 🧊
This consolidation is particularly important because JUFO's valuation ratios are becoming relatively expensive compared with the broader sector. 💰
For existing holders, I would not sell simply because of the current weakness. 📊
My stop-loss remains a confirmed break below the strong 24.00 EGP support level. 🛑
For a new position, I would look to catch the stock between 25.80 and 26.51 EGP rather than chase it near the upper channel band. 🎯
I would treat this entry as a medium-term investment rather than a short-term trade because the fundamental quality of JUFO supports a longer holding horizon. 💎
🧱 The Key Structural Boundaries
• Breakout / Confirmation:
A confirmed break below 25.80 EGP would validate the double-top pattern and increase downside risk. ⚠️
• Entry Zone:
25.80–26.51 EGP is the zone I would watch for a controlled entry if the stock stabilizes. 🎯
• First Target:
28.75 EGP, around the previous ATH / major resistance area. 🚀
• Second Target:
31.50 EGP, my calculated fair-value target. 🎯
• Trend Exit:
Alternatively, the position can be maintained as long as JUFO remains above the middle band of the uptrend channel marked in red. 📈
• Stop Loss:
A confirmed break below the 24.00 EGP strong support level would invalidate the current setup. 🛑
📌 Verdict:
JUFO remains a medium-term investment candidate, but I would not chase the stock at the upper band of the uptrend channel. 📊
The current double-top structure makes 25.80 EGP the key level to watch. 👀
A confirmed break below 25.80 EGP would favor further consolidation, while holding above it could allow the stock to cool its indicators through sideways movement. 🧊
For existing holders, I would stay invested while the stock respects the 24.00 EGP support or the red middle band of the uptrend channel. 🛡️
For new investors, 25.80–26.51 EGP is the area I would monitor for a medium-term entry. 🎯
The upside targets remain 28.75 EGP first and 31.50 EGP as my calculated fair-value target. 🚀
If you like my insights, follow and boost! 🙌💙🚀 🎁 $15 TradingView Discount: www.tradingview.com ✨💸🤑
 Long
Long
OCPH: ATH 342 Reached, But Valuation Is Getting Extreme 📊 OCPH: ATH 342 Reached, But Valuation Is Getting Extreme 🚀
🧱 Fundamentals:
OCPH, like many pharmaceutical stocks in the EGX medical sector, has become extremely expensive after the massive rally. ⚠️
The current valuation leaves very little margin of safety for new investors at these levels. 📉
From a fundamental perspective, my fair value entry is around 233 EGP, while the more conservative entry zone is around 180 EGP. 🎯
I believe sooner or later the price will retest these valuation levels and create a much healthier risk/reward opportunity. 📊
📊 The Pulse:
OCPH has already reached the previous target around 322 EGP and pushed further to a new ATH at 342 EGP. 🚀
The momentum remains extremely strong, and there is currently no technical reason to call the uptrend finished. 📈
As long as both major trend lines remain intact, the stock remains inside its bullish wave. 🔥
However, the distance between the current price and fundamental fair value is becoming increasingly large. ⚠️
This makes chasing the stock at current levels increasingly risky, even while the technical structure remains bullish. 📉
A future pullback toward 233 EGP would bring the valuation closer to a reasonable entry level, while 180 EGP would represent a much more conservative opportunity. 🎯
🧱 The Key Structural Boundaries:
Breakout Trigger: Holding both major uptrend lines keeps the bullish wave active. 🚀
First Target: ATH at 342 EGP. 🎯
Second Target: Further upside will depend on continuation of the current momentum wave. 📈
Final Target: New targets will be updated if the stock establishes a confirmed breakout above the current ATH. 🚀
⚠️ Risk Management:
The main risk is not the current technical trend, but the extremely stretched valuation. ⚠️
A break below the major trend lines would be the first serious warning that the bullish wave is losing momentum. 📉
I would avoid chasing the stock and instead wait for a meaningful correction toward the fundamental valuation zones. 🎯
☪️ Sharia Compliance:
Status: Eligible according to the provided screening information. ✅
The latest financial statements should continue to be checked against the applicable EGX Shariah Index Supervisory Committee criteria before making a final compliance decision. 📋
🎯 Verdict:
OCPH remains technically bullish after reaching 322 EGP and printing a new ATH at 342 EGP. 🚀
But fundamentally, the stock has become extremely expensive and the risk/reward for fresh entries is no longer attractive. ⚠️
My preferred fair value entry is around 233 EGP, while the conservative level is around 180 EGP. 🎯
Until a meaningful pullback happens, I would rather watch the bullish trend than chase the price at extreme valuations. 📊
If you like my insights, follow and boost! 🙌💙🚀 🎁 $15 TradingView Discount: www.tradingview.com ✨💸🤑
 Long
Long
ATQA: Breakout Confirmed, 15.20 EGP in Focus📊 ATQA: Breakout Confirmed, 15.20 EGP in Focus 🚀
🧱 Fundamentals:
ATQA is not cheap from a financial valuation perspective, with elevated P/E, P/B, and P/S ratios relative to its sector peers. ⚠️
However, the latest news and improving technical structure have put the stock back on my radar. 📈
This is therefore a technical momentum setup rather than a fundamentally driven value trade. 🎯
📊 The Pulse:
The first positive signal came from the breakout of the triangle pattern. 🚀
Today we received further confirmation of the breakout, but the stock is currently testing an important resistance level. ⚠️
I would consider entering if ATQA closes above 11.15 EGP, with an even stronger confirmation above 11.44 EGP. 🔑
A confirmed close above this zone would strengthen the probability of a continuation toward the previous ATH at 12.38 EGP. 🚀
If the ATH is broken with strong buying power, the next target is around 14.00 EGP. 🎯
The final target is around 15.20 EGP based on the broader technical expansion. 🚀
🧱 The Key Structural Boundaries:
Breakout Trigger: Daily close above 11.15 EGP, preferably above 11.44 EGP. 🔑
First Target: ATH at 12.38 EGP. 🎯
Second Target: 14.00 EGP. 🚀
Final Target: 15.20 EGP. 🎯
⚠️ Risk Management:
The key support level to protect the setup is around 10.20 EGP. 🛡️
A break below 10.20 EGP would invalidate the current bullish structure and trigger my stop-loss. ⚠️
Because ATQA remains fundamentally expensive, I would not ignore this level or average down blindly if the breakout fails. 📉
☪️ Sharia Compliance:
Status: Not provided in the supplied analysis. ⚠️
I would not label ATQA as Sharia-compliant without verifying the latest EGX Shariah Index Supervisory Committee screening and the company's current financial ratios. 📋
🎯 Verdict:
ATQA is expensive fundamentally, but the technical setup has improved significantly following the triangle breakout. 🚀
I will consider the trade only after a close above 11.15 EGP, with 11.44 EGP providing stronger confirmation. 🔑
Above that level, the targets are 12.38, 14.00, and 15.20 EGP. 🎯
The bullish setup remains valid as long as the stock respects the 10.20 EGP support. 🛡️
If you like my insights, follow and boost! 🙌💙🚀 🎁 $15 TradingView Discount: www.tradingview.com ✨💸🤑
 Long
Long
ATQA: Breakout Confirmed, 15.20 EGP in Focus 📊 ATQA: Breakout Confirmed, 15.20 EGP in Focus 🚀
🧱 Fundamentals:
ATQA is not cheap from a financial valuation perspective, with elevated P/E, P/B, and P/S ratios relative to its sector peers. ⚠️
However, the latest news and improving technical structure have put the stock back on my radar. 📈
This is therefore a technical momentum setup rather than a fundamentally driven value trade. 🎯
📊 The Pulse:
The first positive signal came from the breakout of the triangle pattern. 🚀
Today we received further confirmation of the breakout, but the stock is currently testing an important resistance level. ⚠️
I would consider entering if ATQA closes above 11.15 EGP, with an even stronger confirmation above 11.44 EGP. 🔑
A confirmed close above this zone would strengthen the probability of a continuation toward the previous ATH at 12.38 EGP. 🚀
If the ATH is broken with strong buying power, the next target is around 14.00 EGP. 🎯
The final target is around 15.20 EGP based on the broader technical expansion. 🚀
🧱 The Key Structural Boundaries:
Breakout Trigger: Daily close above 11.15 EGP, preferably above 11.44 EGP. 🔑
First Target: ATH at 12.38 EGP. 🎯
Second Target: 14.00 EGP. 🚀
Final Target: 15.20 EGP. 🎯
⚠️ Risk Management:
The key support level to protect the setup is around 10.20 EGP. 🛡️
A break below 10.20 EGP would invalidate the current bullish structure and trigger my stop-loss. ⚠️
Because ATQA remains fundamentally expensive, I would not ignore this level or average down blindly if the breakout fails. 📉
☪️ Sharia Compliance:
Status: Not provided in the supplied analysis. ⚠️
I would not label ATQA as Sharia-compliant without verifying the latest EGX Shariah Index Supervisory Committee screening and the company's current financial ratios. 📋
🎯 Verdict:
ATQA is expensive fundamentally, but the technical setup has improved significantly following the triangle breakout. 🚀
I will consider the trade only after a close above 11.15 EGP, with 11.44 EGP providing stronger confirmation. 🔑
Above that level, the targets are 12.38, 14.00, and 15.20 EGP. 🎯
The bullish setup remains valid as long as the stock respects the 10.20 EGP support. 🛡️
If you like my insights, follow and boost! 🙌💙🚀 🎁 $15 TradingView Discount: www.tradingview.com ✨💸🤑
Long 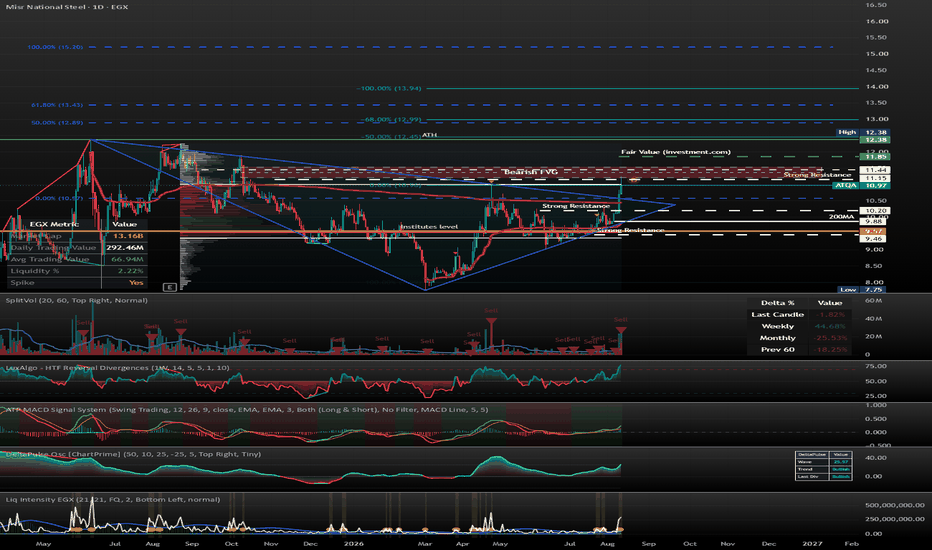
 Short
Short
NCCW: Cup & Handle Setup Despite Expensive Valuation📊 NCCW: Cup & Handle Setup Despite Expensive Valuation ⚠️
🧱 Fundamentals
NCCW remains fundamentally weak, with financial ratios expensive. 📉
However, the recent positive news is keeping the stock attractive to retail momentum traders. 🚀
📊 The Pulse
Technically, the stock appears to be forming a Cup & Handle pattern. ☕
The key support is around 5.64, which I consider the main entry zone. 🎯
A close below 5.40 would invalidate the setup and is my stop-loss level. 🛑
The first target is 6.72. 🎯
The second target is the ATH around 7.28, with Investing.com fair value around 7.40. 🚀
The third target is my fair value around 8.10. 🎯
🧱 The Key Structural Boundaries
Breakdown: 5.40 🛑
Entry / Support: 5.64 🎯
First Target: 6.72 🎯
Second Target: 7.28–7.40 🚀
Final Target: 8.10 🚀
☪️ Sharia Compliance
Status: Not independently verified from the information provided.
The supplied analysis does not include the latest EGX 33 Shariah Index screening or AAOIFI-based financial ratios, so I cannot confirm compliance. ⚠️
🎯 Verdict
NCCW is expensive fundamentally, but the technical setup and positive news could keep retail momentum alive. 🚀
I would consider 5.64 the key level to watch, with 5.40 as the risk-control level. 🛑
If the Cup & Handle confirms, 6.72, 7.28–7.40 and 8.10 become the main targets. 🎯
If you like my insights, follow and boost! 🙌💙🚀 🎁 $15 TradingView Discount: www.tradingview.com ✨💸🤑
MPCO: Retail Momentum, Weak Fundamentals 📊 MPCO: Retail Momentum, Weak Fundamentals ⚠️
🧱 Fundamentals
MPCO remains fundamentally weak, with elevated valuation ratios and limited earnings strength. 📉
The current move appears to be driven mainly by retail momentum rather than strong fundamental improvement. ⚠️
📊 The Pulse
The stock is trading just below the fair value around 2.20, making this the first important target. 🎯
A break below 1.90 would be the first major sign of weakness, and I would not wait if this support breaks. 🛑
If momentum continues, the Fibonacci extension target around 2.50 becomes the next target. 🚀
This remains a speculative momentum trade rather than a fundamentally strong investment. ⚠️
🧱 The Key Structural Boundaries
Breakdown: 1.90 🛑
First Target: 2.20 🎯
Second Target: 2.50 🚀
☪️ Sharia Compliance
Status: Not independently verified from the information provided.
The supplied analysis does not include the latest EGX 33 Shariah Index screening or AAOIFI-based financial ratios, so I cannot confirm compliance. ⚠️
🎯 Verdict
MPCO is a retail-driven momentum play with weak fundamentals. ⚠️
If you enter, respect 1.90 as the key risk level and do not hold through a confirmed breakdown. 🛑
The upside targets are 2.20 first, followed by 2.50 if momentum continues. 🎯
If you like my insights, follow and boost! 🙌💙🚀 🎁 $15 TradingView Discount: www.tradingview.com ✨💸🤑
rmdaTechnical Analysis — El-Nile Co. for Pharmaceuticals & Chemical Industries — Weekly Chart
The stock is in a very strong bullish trend. Price has moved from a long accumulation phase below EGP 40 into a sharp parabolic rally, now trading around EGP 310, with the current weekly candle showing a strong gain of about +38%.
Trend Status
The major trend is clearly bullish, supported by a sequence of strong breakout candles and expanding momentum. The move from the 90–110 area to above 300 was very aggressive, suggesting strong demand and possible speculative momentum.
PRZ / Target Zone
The highlighted green area around EGP 310–350 acts as a Potential Reversal Zone (PRZ). Price has already entered this zone, so the stock is now in a sensitive area.
This does not automatically mean sell, but it means the risk of short-term exhaustion is increasing, especially after such a vertical move.
Key Resistance Levels
The main resistance zone is:
310 – 350 EGP
A weekly close above 350 would confirm continuation strength and may open the way toward:
370 – 400 EGP
Key Support Levels
Important support areas are:
300 – 310: immediate support / current breakout area
240 – 250: first strong pullback support
200 – 220: secondary support
160: major trend support
100 – 110: previous consolidation base
Momentum Reading
The move is extremely powerful, but also overextended. Vertical rallies often continue longer than expected, but they also carry a higher risk of sharp corrections once momentum slows.
A warning signal would appear if the stock forms:
a long upper wick inside the PRZ,
a bearish engulfing candle,
a weekly close below 300,
or strong volume with failure to continue above 350.
Trading View
For holders, the chart supports profit protection or partial profit-taking inside the 310–350 zone.
For new buyers, the risk is high at the current level. A safer entry would usually come either after a breakout above 350 with confirmation, or after a pullback toward support.
Summary
The chart is strongly bullish, but price is now inside a potential exhaustion / reversal zone. The best technical approach is to treat 310–350 as a decision area: continuation above 350 is bullish, while failure below 300 may trigger a correction toward 240–250.
Today 5:32 AM
Technical Analysis — Tenth of Ramadan Pharmaceutical Industries & Diagnostic-Rameda — Weekly Chart
The stock is in a strong bullish trend after breaking out from a long accumulation/consolidation phase. Price is currently trading around EGP 6.35, near the upper end of the marked target zone.
Trend Structure
The chart shows three clear phases:
Long accumulation phase between roughly EGP 0.90 – 1.60.
First bullish expansion toward the EGP 3.00 – 3.40 area.
Bullish continuation breakout from a flag/triangle structure around EGP 3.00 – 3.30, followed by a sharp rally toward EGP 6.35 – 6.50.
The breakout above EGP 3.30 – 3.50 was very important, and the stock has already delivered a strong measured move from that breakout.
Key Resistance
The immediate resistance is around:
EGP 6.50 – 6.70
This is the current upper resistance zone. Price is very close to it, and the black horizontal line on the chart suggests that this area may act as a short-term profit-taking zone.
A strong weekly close above EGP 6.70 could open the way toward:
EGP 7.20 – 7.50
and possibly EGP 8.00 if momentum remains strong.
Key Supports
Important support levels are:
EGP 5.00 – 5.10
This is the first important support and the recent breakout/consolidation area.
EGP 4.35 – 4.50
This area aligns with the 20-week moving average, making it a dynamic support.
EGP 3.20 – 3.30
This is the major breakout base. Losing this level would weaken the bullish structure.
RSI
RSI is around 82, which means the stock is strong but overbought.
This does not mean the stock must fall immediately, but it does mean the risk of a short-term correction or sideways consolidation is increasing.
MACD
MACD remains bullish. The MACD line is above the signal line, and momentum is expanding again. This supports continuation, but the move is already stretched.
Trading View
For holders, the trend remains positive as long as price stays above EGP 5.00. Partial profit-taking near 6.50 – 6.70 may be reasonable because the stock is extended.
For new buyers, the current level is risky because price is near resistance and RSI is overbought. A safer setup would be either:
A pullback toward 5.00 – 5.10, then bullish reaction,
or a confirmed weekly breakout above 6.70.
Summary
The chart is bullish, but price is now near a short-term resistance and overbought zone. The main decision area is EGP 6.50 – 6.70. A breakout above it confirms continuation, while failure there may trigger a pullback toward EGP 5.00 – 5.10.  Short
Short
 Long
Long
DAPH: Triangle Breakout Has Targets, But Weak Liquidity Risky📊 DAPH: Triangle Breakout Has Targets, But Weak Liquidity Raises Risk ⚠️
🏛️ Fundamental Review:
📊 Business Quality:
DAPH has a long operating history in Egyptian real estate and engineering, with exposure to property development, contracting, and consultancy activities. 🏗️
💰 Financial Strength:
The current financial profile is not strong enough for me to justify chasing the stock after its recent technical move. ⚠️
📊 Valuation:
The stock has already reached the Investing.com fair-value area, reducing the fundamental margin of safety at current levels. 💰
💧 Liquidity:
The relatively narrow free float and below-average trading liquidity make DAPH less attractive compared with more liquid EGX alternatives. ⚠️
☪️ Sharia Compliance:
Status: Requires current financial screening. ⚖️
Reason: The core real estate and engineering activities are generally permissible, but definitive compliance requires reviewing the latest financial statements and applying the relevant AAOIFI financial-ratio screens. 🔎
⚡ The Pulse:
Technically, DAPH has confirmed a breakout from a triangle pattern, creating a positive structure with meaningful upside targets. 📈
However, the technical setup alone is not enough for me to justify an aggressive entry because the fundamentals are not particularly strong. ⚠️
The stock has also already reached the Investing.com fair-value area, which reduces the immediate valuation appeal. 💰
Liquidity remains another concern, especially when compared with stronger and more actively traded EGX alternatives. 💧
I can see the stock making one more push toward my fair-value target around 124 EGP if the broader bullish market momentum continues. 🚀
If the market momentum weakens, I would rather pass on the trade than chase the stock at elevated levels. 🛑
🧱 The Key Structural Boundaries
• Momentum Target:
A move toward 124 EGP depends heavily on the continuation of bullish momentum across the broader EGX. 📊
• Stop Loss:
A confirmed break below 87.60 EGP would invalidate the current bullish setup and should be treated as the stop-loss level. 🛑
📌 Verdict:
DAPH has a technically attractive triangle breakout, but the fundamental picture and liquidity profile make it less appealing than several alternative EGX opportunities. ⚠️
The stock has already reached the Investing.com fair-value area, reducing the risk-reward for a fresh entry at current levels. 💰
I can still see one more bullish push toward 124 EGP if market momentum remains strong. 🚀
For me, this is a HOLD/WAIT setup rather than an aggressive BUY. 📊
If you are already positioned, the bullish structure remains valid while the stock holds above the strong 87.60 EGP support. 🛡️
For a new position, I would prefer either a meaningful pullback toward support or a much stronger fundamental/liquidity setup elsewhere on the EGX. 🎯
If you like my insights, follow and boost! 🙌💙🚀 🎁 $15 TradingView Discount: www.tradingview.com ✨💸🤑
MTIE: Bollinger Squeeze Breakout Signals Another Bullish Wave📊 MTIE: Bollinger Squeeze Breakout Signals Another Bullish Wave 🚀
🏛️ Fundamental Review:
📊 Business Quality:
MTIE combines consumer distribution, automotive, industrial equipment, and fintech exposure, giving it diversified participation in Egypt's consumption and digital-payment growth. 📈
💰 Financial Strength:
The company continues to show solid profitability and a strong return profile, while its current valuation does not appear excessively stretched based on the ratios provided. 💎
🚀 Growth Catalysts:
Its exposure to Bee and Aman provides additional upside from Egypt's expanding digital-payment and financial-services ecosystem. 📲
📊 Valuation:
Despite the strong price appreciation, the financial ratios remain relatively reasonable, supporting the continuation of the bullish thesis if earnings momentum is maintained. 💰
☪️ Sharia Compliance:
Status: Requires current financial screening. ⚖️
Reason: MTIE's operating businesses are generally permissible, but its exposure to financial-services and fintech subsidiaries requires reviewing the latest consolidated financial statements and applying the relevant AAOIFI financial-ratio screens before confirming compliance. 🔎
⚡ The Pulse:
MTIE finally confirmed the breakout from its Bollinger Band squeeze, providing a strong technical signal after the previous consolidation phase. 🚀
The bullish wave remains strong, and I am not seeing enough selling pressure yet to suggest that the current trend has been exhausted. 📈
Most of the major indicators are also not excessively overheated, which gives the stock room to continue its momentum before a deeper correction becomes necessary. 🔥
🧱 The Key Structural Boundaries
• Breakout Trigger:
The Bollinger squeeze breakout is already confirmed, and maintaining the breakout structure keeps the bullish setup active. 🚀
• First Target:
12.00 EGP, around the Investing.com fair-value area. 🎯
• Second Target:
13.50 EGP, my calculated fair-value target and the next major upside objective. 🎯
• Momentum Support:
10.30 EGP is an important fair-value/support area where a successful retest could attract buyers and restart the bullish momentum. 📈
• Stop Loss:
Exit if the uptrend line is decisively broken or if the 61.8% Fibonacci level around 10.00 EGP is lost. 🛑
📌 Verdict:
MTIE remains bullish after the confirmed Bollinger Band squeeze breakout. 🚀
The absence of strong selling pressure, relatively moderate indicator readings, and reasonable financial ratios continue to support the bullish setup. 📈
I would remain invested as long as the stock respects the uptrend structure and the 61.8% Fibonacci level around 10 EGP. 🛡️
A healthy pullback toward 10.30 EGP could provide another opportunity to build exposure rather than automatically treating the correction as a trend reversal. 🎯
The main upside levels I am watching are 12 EGP first and 13.50 EGP second. 🚀
If the bullish wave remains intact, MTIE has room to continue toward these targets before the setup needs a major reassessment. 📊
If you like my insights, follow and boost! 🙌💙🚀 🎁 $15 TradingView Discount: www.tradingview.com ✨💸🤑
 Long
Long
PHAR: Strong Fundamentals, Healthy Pullback & ATH Breakout Setup📊 PHAR: Strong Fundamentals, Healthy Pullback & ATH Breakout Setup 🚀
🏛️ Fundamental Review:
📊 Business Quality:
PHAR is one of Egypt's strongest pharmaceutical companies, with a broad product portfolio, major export exposure, and defensive demand from essential medicines. 💊
🌍 Growth:
Its export business provides valuable hard-currency revenue, while EIPICO 3 and the expansion into biosimilars create additional long-term growth potential. 🚀
💰 Financial Strength:
PHAR combines strong fundamentals with a relatively reasonable valuation compared with the quality and growth potential of the business. 💎
📈 Valuation:
Despite the strong bullish wave, the stock does not look excessively expensive based on the financial ratios provided, especially considering its earnings quality and strategic position in the pharmaceutical sector. 💰
📉 Technical Structure:
PHAR significantly lagged several pharmaceutical-sector names before finally entering a strong parabolic advance over the past couple of weeks. 📈
⚠️ Profit Taking:
The stock reached the estimated fair value around 156 EGP, where strong profit-taking appeared and triggered the current pullback. 📉
📊 Key Technical Level:
The technical structure remains positive as long as PHAR continues closing above the 38.2% Fibonacci level around 129.10 EGP. 🟢
☪️ Sharia Compliance:
Status: Likely Sharia-compliant. ✅
Reason: PHAR's core business is pharmaceutical manufacturing, which is generally permissible, but a definitive classification requires screening the latest financial statements under the applicable AAOIFI financial-ratio criteria. ⚖️
⚡ The Pulse:
The recent parabolic wave finally brought PHAR back into focus after a prolonged period of underperformance versus parts of the pharmaceutical sector. 🚀
The rejection from 156 EGP is healthy after such a strong advance and currently looks more like profit-taking than a confirmed trend reversal. 📉
Because PHAR has a relatively large market capitalization, another immediate parabolic move would be less sustainable and a period of consolidation or controlled pullback would be healthier. 🧊
The key level to watch is 129.10 EGP, representing the 38.2% Fibonacci retracement. 👀
As long as the price continues to hold above this level on a closing basis, the medium-term bullish structure remains intact. 📈
If the stock regains momentum and breaks its ATH around 156 EGP, the next major objective becomes my long-term target around 175 EGP. 🎯
🧱 The Key Structural Boundaries
• Breakout Trigger:
A confirmed breakout above the ATH around 156 EGP would signal continuation of the bullish wave. 🚀
• First Target:
156 EGP, the previous ATH and immediate breakout level. 🎯
• Second Target:
175 EGP, my longer-term upside target based on the current bullish structure and fundamental strength. 🚀
• Final Target:
Further upside remains possible if PHAR establishes a new ATH and maintains strong momentum, but 175 EGP is currently my main long-term target. 📈
• Stop Loss:
A confirmed break below the 61.8% Fibonacci level around 110 EGP would invalidate the current bullish structure and trigger the stop-loss. 🛑
📌 Verdict:
PHAR remains one of my preferred long-term pharmaceutical holdings on the EGX because of its strong fundamentals, defensive business model, export exposure, and future growth catalysts. 💎
I consider the current move a buy-the-dip setup rather than a reason to abandon the stock. 📈
The key condition is maintaining the bullish structure above the important Fibonacci levels, particularly 129.10 EGP in the near term and 110 EGP as the major risk-control level. 🛡️
If PHAR breaks the ATH around 156 EGP with strong momentum, the next major target is around 175 EGP. 🚀
If you like my insights, follow and boost! 🙌💙🚀 🎁 $15 TradingView Discount: www.tradingview.com ✨💸🤑
 Long
Long
EFIC: Expensive Valuation Meets Strong Selling Pressure Risk📊 EFIC: Expensive Valuation Meets Strong Selling Pressure, Risk Rising ⚠️
🏛️ Fundamental Review:
📊 Business Quality:
EFIC is a strategically important Egyptian fertilizer and industrial chemicals producer with established phosphate fertilizer production and export capabilities. 🌾
📈 Growth:
The agricultural and fertilizer sector provides structural demand, but recent earnings pressure makes the current valuation difficult to justify. 📉
💰 Profitability:
Profitability has been affected by fertilizer pricing cycles and higher production costs, while the current earnings base does not support the stock's elevated multiples. ⚠️
💎 Valuation:
The financial ratios make EFIC look expensive, particularly its elevated P/E and P/B compared with sector benchmarks. 💰
🏦 Ownership & Liquidity:
Institutional ownership above 75% significantly restricts the effective free float, making the stock less attractive for retail investors despite the recent improvement in liquidity. 🏦
☪️ Shariah Compliance:
Status: Likely Shariah-compliant. ✅
Reason: EFIC's core business is fertilizer and industrial chemical manufacturing, which is generally permissible. A definitive status requires screening the latest financial statements under the applicable AAOIFI financial ratios. ⚖️
⚡ The Pulse:
EFIC attracted noticeably stronger liquidity during the last couple of weeks, largely benefiting from the broader bullish momentum across the Egyptian market. 📈
However, the stock reached the estimated fair value around 224.80 EGP and strong selling pressure appeared immediately afterward. ⚠️
The selling pressure pushed the price below the 200MA, which is a negative technical development and weakens the short-term bullish structure. 📉
From my perspective, the combination of stretched valuation, high institutional ownership, and the recent rejection makes EFIC unattractive for a fresh entry at current levels. 🚫
If you are already holding the stock, the key risk-control level is 202 EGP. 🛑
🧱 The Key Structural Boundaries
• Breakout Trigger:
A daily close back above 216 EGP would be the first positive technical signal and could indicate that buyers are regaining control. 📈
• First Target:
224.80 EGP, the previous fair-value area where strong selling pressure emerged. 🎯
• Second Target:
The previous ATH around 239.80 EGP, representing the next major resistance and upside objective. 🚀
• Stop Loss:
A confirmed break below 202 EGP invalidates the current recovery setup and should trigger an exit. 🛑
📌 Verdict:
I would not recommend opening a new position in EFIC at this stage because the valuation remains stretched. ⚠️
The recent liquidity increase is positive, but the rejection from 224.80 EGP and close below the 200MA are stronger near-term warning signals. 📉
Existing holders can remain in the trade while 202 EGP holds, but a break below this level changes the risk profile significantly. 🛡️
The first sign of renewed strength would be a confirmed close above 216 EGP. 📈
If the bullish momentum returns, 224.80 EGP is the first target, followed by the ATH around 239.80 EGP. 🎯
If you like my insights, follow and boost! 🙌💙🚀 🎁 $15 TradingView Discount: www.tradingview.com ✨💸🤑
El-Nile Co. for Pharmaceuticals & Chemical Industries — Weekly CTechnical Analysis — El-Nile Co. for Pharmaceuticals & Chemical Industries — Weekly Chart
The stock is in a very strong bullish trend. Price has moved from a long accumulation phase below EGP 40 into a sharp parabolic rally, now trading around EGP 310, with the current weekly candle showing a strong gain of about +38%.
Trend Status
The major trend is clearly bullish, supported by a sequence of strong breakout candles and expanding momentum. The move from the 90–110 area to above 300 was very aggressive, suggesting strong demand and possible speculative momentum.
PRZ / Target Zone
The highlighted green area around EGP 310–350 acts as a Potential Reversal Zone (PRZ). Price has already entered this zone, so the stock is now in a sensitive area.
This does not automatically mean sell, but it means the risk of short-term exhaustion is increasing, especially after such a vertical move.
Key Resistance Levels
The main resistance zone is:
310 – 350 EGP
A weekly close above 350 would confirm continuation strength and may open the way toward:
370 – 400 EGP
Key Support Levels
Important support areas are:
300 – 310: immediate support / current breakout area
240 – 250: first strong pullback support
200 – 220: secondary support
160: major trend support
100 – 110: previous consolidation base
Momentum Reading
The move is extremely powerful, but also overextended. Vertical rallies often continue longer than expected, but they also carry a higher risk of sharp corrections once momentum slows.
A warning signal would appear if the stock forms:
a long upper wick inside the PRZ,
a bearish engulfing candle,
a weekly close below 300,
or strong volume with failure to continue above 350.
Trading View
For holders, the chart supports profit protection or partial profit-taking inside the 310–350 zone.
For new buyers, the risk is high at the current level. A safer entry would usually come either after a breakout above 350 with confirmation, or after a pullback toward support.
Summary
The chart is strongly bullish, but price is now inside a potential exhaustion / reversal zone. The best technical approach is to treat 310–350 as a decision area: continuation above 350 is bullish, while failure below 300 may trigger a correction toward 240–250.  Short
Short