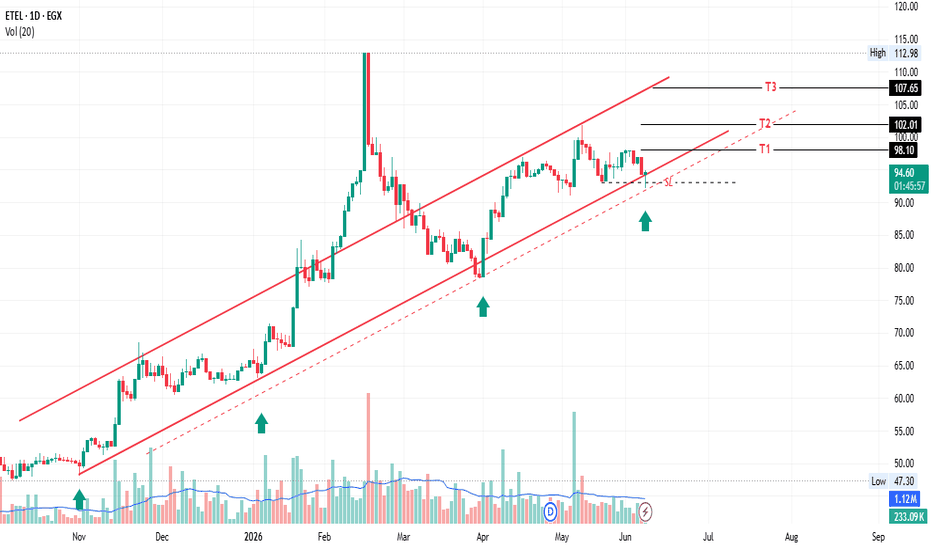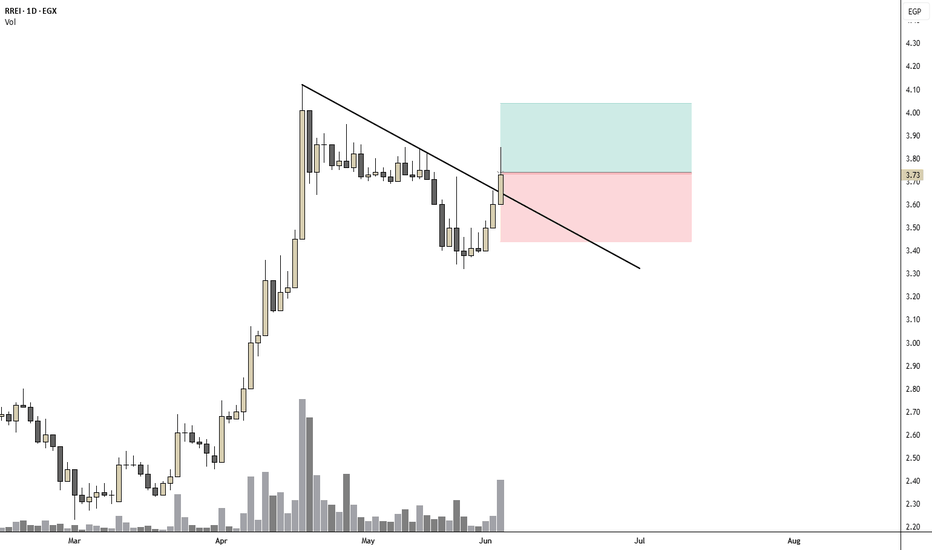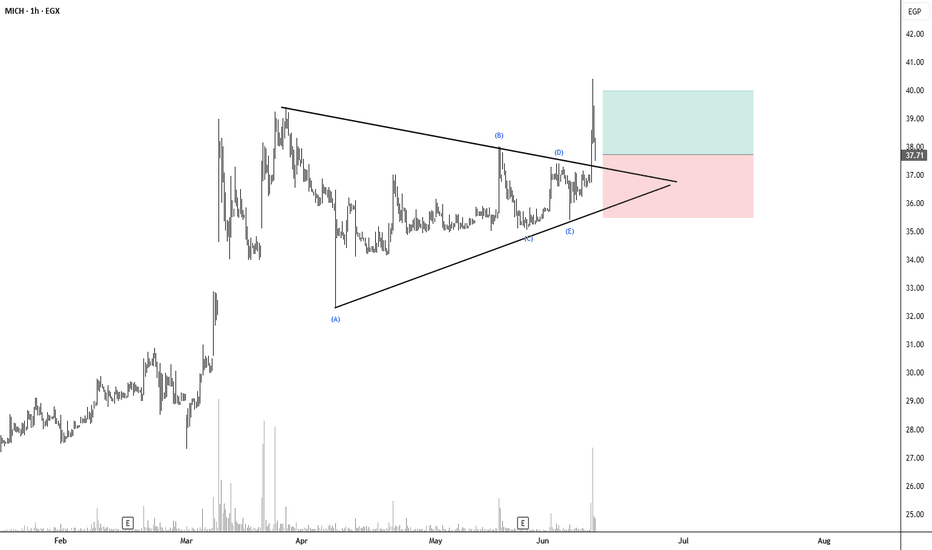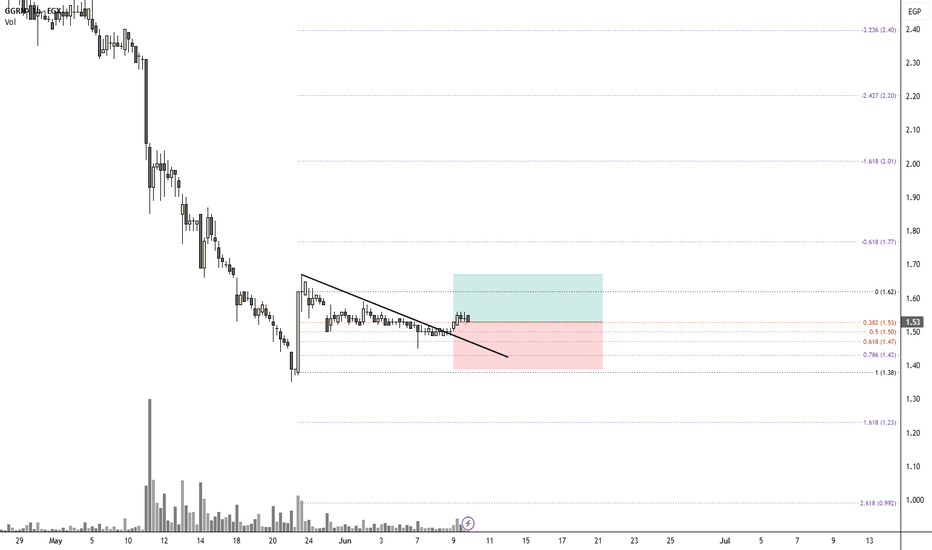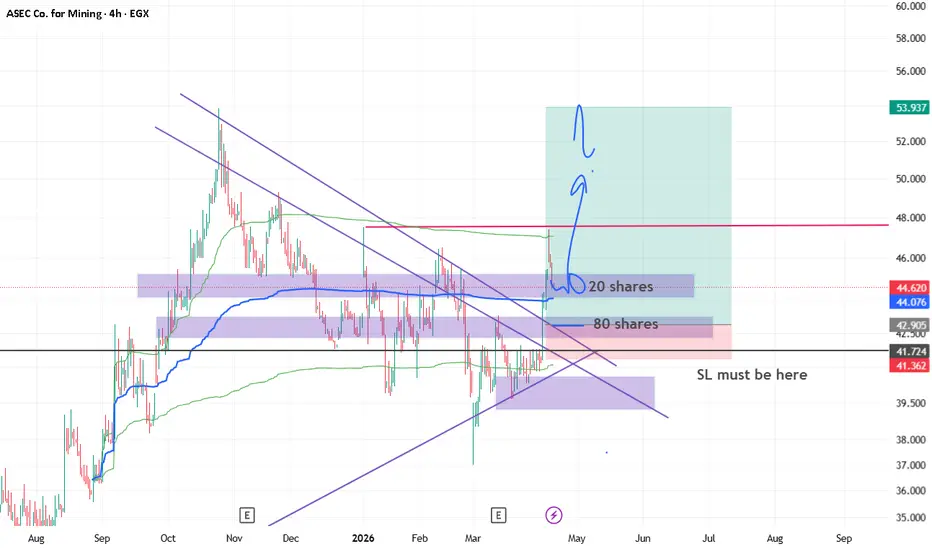
TMGH: Mass Distribution Detected! 5.6M Shares Dumped in Last HouAnalysis Snapshot:After a deep dive using the "Microscope" on TMGH (Talaat Moustafa Group), the technical indicators are screaming "Distribution" despite the price holding near the peak.Key Technical Observations:Massive Outflow: A staggering 5.62 million shares were liquidated during the last hour of Thursday's session (April 30, 2026). This is a clear "Whale footprint" of institutional exiting.CMF Alert: The Chaikin Money Flow (CMF) has plunged to -0.55. This significant negative value confirms that smart money is leaving the stock while retail investors are being lured at the top.Price Stagnation: The price is struggling at the 94.11 resistance zone, showing signs of exhaustion.Targets & Support Levels:Immediate Support: 86.91Secondary Target: 81.08Correction Zone: If the 88.80 level breaks, we expect a rapid drop to fill the gaps down to the 73.00 - 75.00 areas.Conclusion:Don't be the liquidity the Whales use to exit. The "Whale footprint" is visible for those who know where to look.
MASR โ ATH Resistance vs. Bearish Divergence MASR โ ATH Resistance vs. Bearish Divergence ๐๐๏ธ
The Reality: I see a "Real Estate Cornerstone" thriving in East Cairo, particularly with the Taj City and Sarai projects.
While the stock has surged to 6.11, I note that cash flow is heavily committed to accelerated project deliveries, meaning profits are currently more "accounting-based" (Percentage of Completion) than liquid cash.
The Fundamental Moat: I recognize MASR as a "Safe Haven" for local liquidity. Its massive land bank acts as an inflation-protected store of value against EGP volatility.
The core business is exceptionally robust, driven purely by residential sales rather than financial engineering.
The Margin Pressure: I observe that MASR is sensitive to global Steel and Cement prices, which are influenced by international energy costs.
Additionally, rising receivables from extended payment plans and high debt used for expansion make it sensitive to Egypt's 2026 high-interest-rate environment.
Sharia Status: โ
Confirmed Compliant. I confirm that MASR is a consistent and liquid member of the EGX33 Shariah Index (May 2026).
Its business model and financial ratios align with Islamic investment standards.
Technical Analysis:
Uptrend Exhaustion, I am looking for the "Golden Entry."
The Divergence: Iโve spotted a classic bearish divergence on both the RSI and MACD while the price is at an ATH.
This usually precedes a healthy cooling-off period.
The Liquidity Trap: I find it concerning that price is increasing while daily liquidity is decreasing.
This suggests the current move lacks the institutional "fuel" to sustain a breakout.
The Target Entries: I see a good entry point at 5.46.
If the market sees a deeper pullback, I find 5.20 to be an exceptional level to build a position in this fundamental powerhouse.
The Trend: I note the stock remains in its uptrend channel, trading exactly in the middle. I expect a test of the lower boundary before the next major bullish leg.
Sharia Confirmation: โ
Compliant. I confirm its status as a core member of the EGX33 Shariah Index.
Verdict: I classify MASR as a "Fundamental Buy" but a "Technical Wait."
I am not entering at 6.11.
I will wait for a pullback to 5.46 or 5.20 to capitalize on the 60% fair value potential with a much safer risk profile.
If I like my posts, I follow and boost ๐
๐ Get a $15 discount on your next subscription:
๐ www.tradingview.com โจ๐ธ
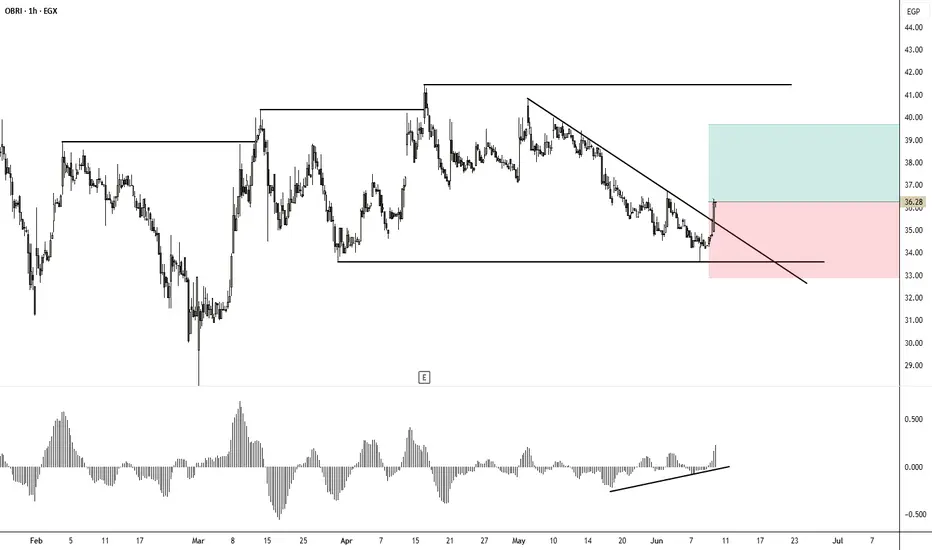
OBRI โ Resistance Rejection & Declining Volume OBRI โ Resistance Rejection & Declining Volume ๐๐๏ธ
The Reality: I see a "Speculative Hold" navigating a high-demand but high-cost environment.
While the company thrives on its strategic land bank in Qalyubia and East Cairo, it is being squeezed by the 2026 reality of expensive construction materials and high interest rates.
The Cash Trap: I note that while the stock price has shown life, operating cash flow remains tight.
Because earnings are largely tied to "Percentage of Completion" accounting, the profits I see on paper haven't fully translated into liquid cash yet.
The Debt Burden: I observe that OBRI carries significant debt to fund land acquisitions and construction.
This makes it hypersensitive to the current interest rate environment.
To keep sales moving, they rely on extended installment plans, which further inflates accruals and delays cash recovery.
Technical Analysis:
The Failed Breakout โ I see the momentum fading.
The Resistance Wall: I've identified 40.48 as the major barrier.
The price attempted to clear this level following the triangle exit but was met with selling pressure.
The Volume Warning: I am particularly concerned by the decreasing volume.
A breakout without volume follow-through is often a "Bull Trap." ๐๐ฉน
The Fibonacci Context: I note the price is currently trading within the Golden Level.
The lack of buying power suggests the stock may consolidate or drop to retest lower support. ๐โจ
The Entry: I am not entering here.
Since my fair value is nearly identical to the current resistance, the risk-to-reward ratio is unattractive.
I need to see a high-volume close above 40.48 before I change my mind. โ๐งฑ
Sharia Confirmation: โ Non-Compliant. Excluded from Sharia indices due to Interest Income and Debt Ratios. โช๏ธ๐
Verdict: I classify OBRI as a "Technical Pass."
I believe the "Speculative Hold" label is appropriate for current bag-holders, but for new capital, I see better opportunities where the fair value provides a wider margin of safety. ๐ก๏ธ๐
If I like my posts, I follow and boost ๐
๐ Get a $15 discount on your next subscription:
๐ www.tradingview.com โจ๐ธ
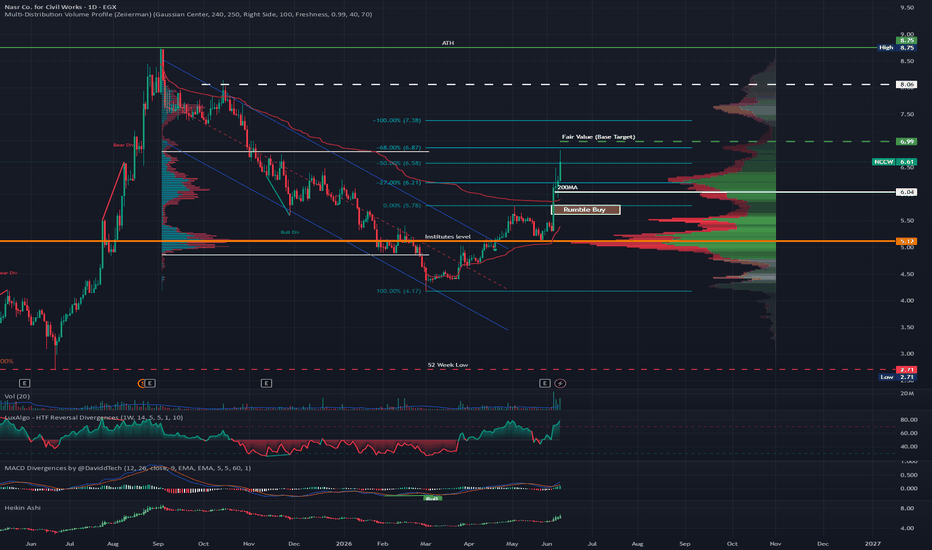
NCCW โ Project Backlog vs. Margin CompressionNCCW โ Project Backlog vs. Margin Compression ๐๐๏ธ
The Reality: I see a "Mid-Cap Contractor" currently stuck in a cooling cycle. ๐ฌ๏ธ
While 2024 was stellar, the FY 2025 results show an 11.4% decline in net profit to EGP 60.35 million.
The story here is a "Margin Pinch" revenue was stable at EGP 348.7M, but domestic rising costs for materials and overhead are eating the bottom line. ๐ฉน๐๏ธ
The Regional Pivot: I note the company is looking outside for growth, recently signing a EUR 46M agreement in Uganda. ๐
This expansion is vital because domestic margins are suffering.
However, I find the EPS of 0.29 EGP (down from 0.32 EGP) reflects the current struggle to maintain efficiency at home.
The Cash Flow Hurdle: I observe that cash conversion is tight.
NCCW is carrying significant "Work in Progress" on the balance sheet, a typical lag in civil works where milestones haven't yet turned into liquid cash.
While I appreciate that the earnings are 100% operational with no "one-off" fluff, the reliance on short-term credit to fund the project backlog is putting pressure on the debt-to-equity profile. โ๐ธ
The Valuation: I find the 6.10 EGP Final Target leaves no meat on the bone.
By applying a premium 19.0x P/E to account for their historical "Zero-Debt" reputation and adding an asset strength premium for their EGP 951M book value, the target is technically sound but offers no upside from current interest levels. ๐ฏโ๏ธ
Sharia Status: โ Non-Compliant.
I confirm that NCCW fails the quantitative screens for the EGX33 Shariah Index (April 2026).
The primary hurdles are the Interest Income, which frequently breaches the 5% purification threshold. โช๏ธ๐ซ
Technical Analysis:
The Waiting Game โ I see no immediate trigger. ๐ข๐ง
The Resistance: I've identified 6.14 as the critical level.
Since my fair value is 6.10, the price needs to break above this threshold to signal a new bullish trend that is actually worth trading. ๐น๐งฑ
Verdict: I classify NCCW as a "Technical Pass." ๐๏ธ๐๏ธ
The fair value is too close to the current market price to justify the risk of high accruals and a declining bottom line.
I will wait for a structural change in earnings before looking at this stock again. ๐ก๏ธ๐
If I like my posts, I follow and boost ๐
๐ Get a $15 discount on your next subscription:
๐ www.tradingview.com โจ๐ธ
EGAS โ Ascending Triangle Breakout on 10X VolumeEGAS โ Ascending Triangle Breakout on 10X Volume ๐๐ฅ
The Reality: I see a critical "Infrastructure Engine" powering Egyptโs energy transition.
Revenue grew 20% to reach EGP 9 billion in FY 2025, with a solid 25% jump in net profit for the first nine months.
As the primary executor of the national natural gas delivery project, its growth is directly tied to national development.
The Cash Cycle: I note that despite the high revenue, immediate cash margins remain tight. This is a capital-intensive business; cash conversion is heavily dependent on milestone payments from government contracts.
However, I find the 2025 profit growth highly reliable because it is almost entirely operational. ๐ก๏ธโก
The Valuation: I find the 49.30 EGP is the fair value.
By applying an adjusted P/E of 21x to the 2.18 EGP EPS, and adding a premium for the 72%+ profit growth trend, I see a target that anticipates continued aggressive expansion. ๐๐ฏ
The Technical Breakout: I observe that the stock was recently in an ascending triangle pattern. Today, it broke out with massive volume nearly 10x the average.
I consider this a very strong signal of a bullish wave aimed at the 52-week high and my fair value target.
Sharia Status: โ
Confirmed Compliant. I confirm that EGAS passes Sharia screening, making it an accessible core pick for ethical portfolios. โช๏ธ๐
Technical Analysis:
Strong Breakout but I am looking for the retest. ๐ข๐ง
The Triangle Break: I noticed the stock finally cleared the ascending triangle today.
The fact that volume was 10x the average confirms that this isn't just retail noise; it's institutional conviction. ๐โจ
The Support Levels: I see 44.50 as the primary support for a retest.
If the price holds here, it confirms the breakout's validity.
My ultimate safety net is the 200MA at 43.60. โ๐งฑ
The Target: I believe the stock is following technical rules perfectly.
Once the retest is complete (if it happened), I expect a rally toward the 52-week high and eventually my 49.30 fundamental target. ๐ฐ๏ธ๐
The Entry: I am not chasing the spike.
I would like to see a retest to 44.50 to enter or increase my position, ensuring a better risk-to-reward ratio. ๐๐๏ธ
Verdict: I classify EGAS as a "Fundamental and Technical Buy."
I am looking at a stock that is finally seeing its price catch up to its infrastructure importance.
I see the path to 49.30 as increasingly likely following today's volume surge. ๐ก๏ธ๐
If I like my posts, I follow and boost ๐
๐ Get a $15 discount on your next subscription:
๐ www.tradingview.com โจ๐ธ
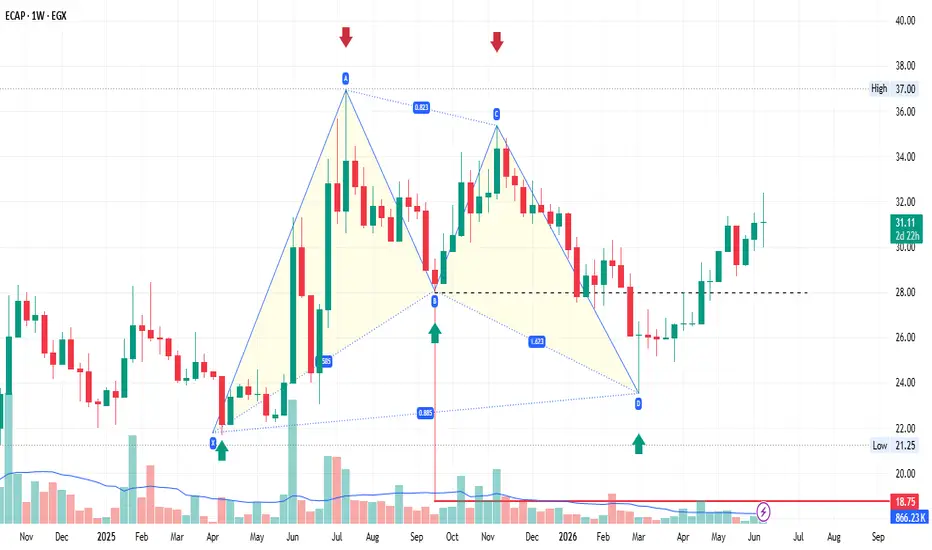
(CRST) Crest Mark For Contracting And Real Estate Development:
๐ Market Structure & Trend
The stock is currently range-bound after a prior upward move.
Price action shows consolidation between ~0.54 and ~0.65 EGP, forming a horizontal trading range.
The recent bounce suggests buyers are defending the lower support zone, but momentum is still not strong enough for a confirmed breakout.
๐ Key Levels
๐ข Support
0.575 โ 0.59 EGP โ Primary demand / entry zone
0.539 EGP โ Strong support & invalidation level (Stop Loss)
๐ด Resistance
0.646 โ 0.652 EGP โ Immediate resistance (Target 1 zone)
0.762 EGP โ Major resistance (Target 2)
๐ฏ Trade Setup (Bullish Scenario)
Entry Zone: 0.575 โ 0.59 EGP
Stop Loss: 0.539 EGP
Target 1: 0.646 โ 0.652 EGP
Target 2: 0.762 EGP
๐ก Rationale:
Entry aligns with support + previous consolidation base
Risk/Reward is favorable (~1:2 to 1:4 depending on exit)
Break above 0.652 EGP would confirm bullish continuation
โ ๏ธ Bearish Scenario
A daily close below 0.539 EGP would:
Break structure
Signal trend weakness
Open downside toward ~0.50 EGP or lower
๐ Volume Insight
Volume appears declining during consolidation, which is typical before a breakout.
A volume spike near resistance (0.65) is critical to confirm continuation.
๐ง Professional View
The stock is in a decision zone.
Best strategy:
Buy near support, not in the middle of the range
Or wait for breakout confirmation above 0.652 EGP
(PRDC) Pioneers Properties for Urban Development ๐ Market Structure & Pattern
The stock is forming a symmetrical triangle (compression pattern) after a prolonged consolidation.
Price is near the apex, which means a strong breakout is ูุฑูุจ.
The internal structure (AโBโCโD swings) suggests accumulation phase rather than distribution.
๐ Key Levels
๐ข Demand Zones (Support)
4.12 โ 4.04 EGP โ Primary demand (current holding area)
3.85 โ 3.80 EGP โ Stronger support (last ุฏูุงุน zone)
๐ด Supply Zone (Resistance)
4.32 โ 4.42 EGP โ Key breakout barrier
๐ฏ Targets
Target 1: ~4.75 EGP
Target 2: 5.38 โ 5.40 EGP
๐ฏ Trade Setup (Bullish Scenario)
Entry: Around 4.05 โ 4.12 EGP
Confirmation Entry: Break above 4.42 EGP
Targets:
T1: 4.75 EGP
T2: 5.40 EGP
๐ก Rationale:
Price holding above demand zone
Compression โ usually leads to expansion (strong move)
Higher lows forming โ buyers gaining control
Favorable risk/reward setup
๐ Breakout Strategy
Aggressive: Buy near demand (current price zone)
Conservative: Wait for daily close above 4.42 EGP
This confirms triangle breakout
Likely triggers momentum move upward
๐ Bearish Scenario
If price breaks below 4.00 EGP:
Pattern fails โ
Price likely drops to 3.80 EGP
A deeper break below 3.80 โ shifts trend to bearish
๐ Volume Insight
Volume is contracting โ typical before breakout
Watch for volume spike on breakout 4.42 to confirm strength
๐ง Professional View
Bias: Bullish (with confirmation)
Market is in accumulation phase
Best approach:
Position early near support
Or enter on confirmed breakout
โ
Conclusion
This is a high-potential breakout setup
Key trigger: 4.42 EGP
Upside move could be fast and sharp once breakout happens
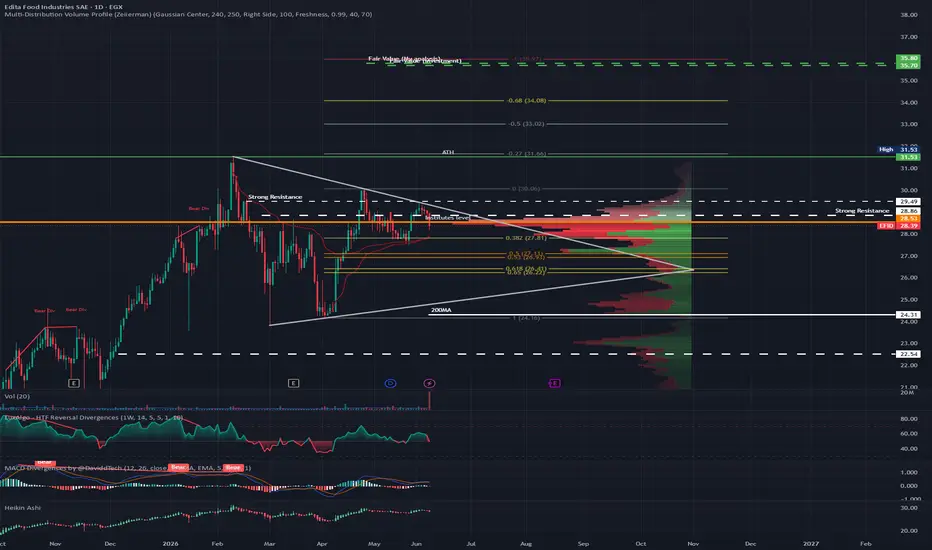
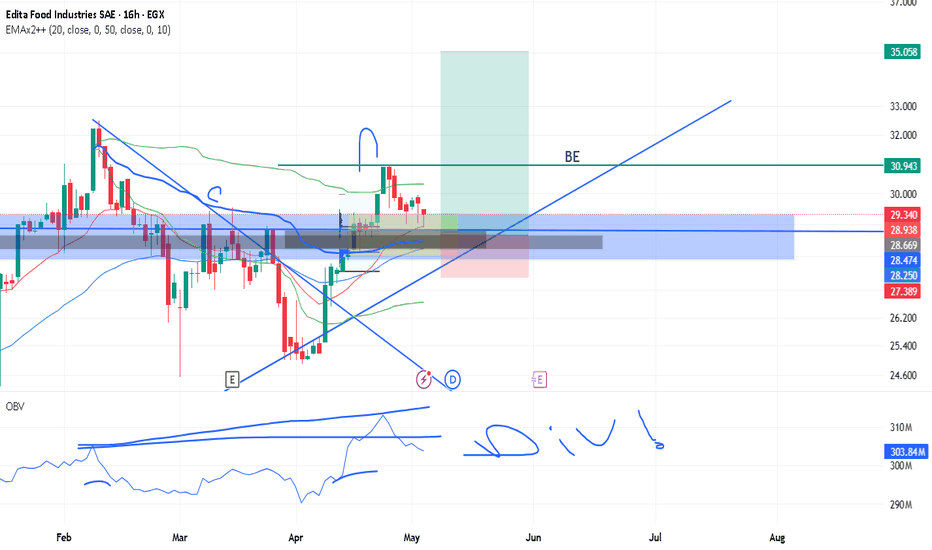
EFID โ Testing Support Before the ATH Run EFID โ Testing Support Before the ATH Run ๐๐ฐ
The Reality: A "Blue-Chip Powerhouse" in its prime! ๐๏ธ
Editaโs FY 2025 results were nothing short of staggering, with net profit surging 72.6% to EGP 2.4B.
This isn't just "inflation pricing" it's a massive regional expansion into Morocco and Iraq combined with a dominant 50% share of the local cake market.
The Cash Machine: Edita is a master of "Cash-and-Carry." ๐ธ
Nearly 100% of its operating profit is captured as actual liquid cash, meaning its EGP 20.9B revenue is high-quality and reliable.
While they are executing a massive EGP 4B investment plan for 2026, their high turnover and rapid collection cycles allow them to self-fund this growth without straining the balance sheet. ๐ก๏ธโก
The Valuation: I find the 35.80 EGP Fair Value well-supported.
By applying a 15.5x P/E multiple to an EPS of 2.18 EGP, and adding a premium for export success, the math points toward significant upside. ๐๐ฏ
Technical Analysis:
Breakout Retest โ Patience at the Pivot. ๐ข๐ง
The FVG Barrier: The 31.00 level acted as a "Fair Value Gap" magnet, attracting sellers and halting the initial bullish surge. ๐งฑ๐น
The Support Test: The current retest of 29.75 is healthy.
The Dream Entry: If the support snaps, a dip to 28.00 (aligning with the 50% Fibonacci level and previous liquidity zones) would be the ideal spot to build a heavy position. ๐๐
The Target: Once the consolidation ends, the target remains the ATH, followed by the 35.80 fundamental fair value. ๐ฐ๏ธ๐
Sharia Status: โ
Confirmed Compliant. Edita is a staple of the EGX33 Shariah Index (April 2026). Its industrial nature and low debt-to-equity ratio make it a favorite for institutional Sharia-compliant funds. โช๏ธ๐
Verdict: EFID is a "Quality Buy." ๐๏ธ๐๏ธ
Don't chase the 31.00 high; wait for the current retest to resolve.
If you get a chance to grab it near 28.00, you are buying a regional giant at a significant discount to its 2026 potential. ๐ก๏ธ๐
If you like my posts, please follow and boost ๐
๐ Get a $15 discount on your next subscription:
๐ www.tradingview.com โจ๐ธ
BTFH โ Negative Cash Flow vs. The Fintech Pivot BTFH โ Negative Cash Flow vs. The Fintech Pivot ๐๐ฆ
The Reality: A massive financial turnaround with a "Cash Flow" catch. ๐ญ
Beltone has transformed from a loss-making entity into a profit powerhouse, with FY 2025 net income reaching EGP 1.35 billion.
However, the negative Operating Cash Flow (CFO) is the "elephant in the room."
The company is aggressively funneling its EGP 6.96B revenue into building a massive EGP 30B+ lending portfolio, meaning profits are currently on paper (accruals) rather than in the bank. ๐โ
The Survival Kit: Beltone is currently a "Liquidity King" thanks to its shareholders.
With EGP 8.85B in cash reserves, it has the runway to sustain its EGP 15.94B debt while scaling its mortgage, leasing, and microfinance arms.
Core operating income is significantly higher than net income, proving that the underlying "Fintech Engine" is firing on all cylinders despite high interest expenses. ๐ก๏ธโก
Technical Analysis: Trapped in the Channel โ Avoid the "Noise." ๐ข๐ง
The Downward Channel: The stock remains below its major moving averages.
Any small bounces from the 2.82 support are currently just relief rallies within a broader bearish trend. ๐โจ
The Resistance: The 3.39 level is the critical decider.
A breakout above this on high volume would signal that the market is finally pricing in the 2026 growth story. ๐๐๏ธ
The Risk: The combination of negative CFO and high accruals makes Beltone a "high-beta" stock.
If the broader EGX30 corrects from its current ATH, BTFH could easily retest the 2.80 zone. ๐ช๐ฏ๏ธ
The Entry: Conservative entry only starts above 3.39.
Anything below that is catching a falling knife. โ๐งฑ
Sharia Status: โ Non-Compliant. Beltone is a definitive "Fail" for Sharia portfolios.
As a provider of conventional non-bank financial services (NBFS), its revenue from interest-based lending, margin trading, and its massive treasury interest income (from EGP 8.8B in deposits) far exceeds the permissible 5% and 33% thresholds. โช๏ธ๐ซ
Verdict: The Patient Observer.
Beltone is a fundamental transformation story, but the technicals are not ready to support a safe entry.
Don't chase the "turnaround" until the price clears 3.39. ๐ก๏ธโ๏ธ
If you like my posts, please follow and boost ๐
๐ Get a $15 discount on your next subscription:
๐ www.tradingview.com โจ๐ธ
MOC โ Golden Zone Rebound vs. Market Fatigue AMOC โ Golden Zone Rebound vs. Market Fatigue ๐๐ข๏ธ
The Reality: A "Lean & Mean" energy machine! ๐๏ธ
AMOC is showing impressive resilience with revenue hitting EGP 20.74B (+14% YoY).
Unlike many peers, it has a "clean" profit profile over 90% of income comes from core refining, with almost no reliance on "paper gains" from currency fluctuations. ๐๐ธ
The Fortress Balance Sheet: In a sector usually weighed down by debt, AMOC is a rare breed it holds more cash than debt. ๐ฆ๐ก๏ธ
Working capital has stabilized thanks to faster collections from the state, and operating cash flow has recovered to the point of neutralizing previous deficits.
It is essentially a "Zero-Debt" play on Egyptian energy. โโจ
Technical Analysis:
The "Symmetry" of the correction is nearly perfect. ๐ข๐ง
The Golden Zone: The price hit the 61.8% Fibonacci retracement and held.
This confirms that the long-term uptrend is still technically intact. ๐โจ
The Breakout: Closing above the 38.2% Fib with good volume is a strong signal that the correction phase is ending and the accumulation phase has begun. ๐๐๏ธ
The Final Trigger: Your "Line in the Sand" at 8.525 is the key.
A decisive break above this level opens the door to a move toward a new ATH. ๐๐ฏ
The Market Risk: Since the broader EGX is at an ATH, a market-wide "Profit Taking" event could drag AMOC back down to the Fib 50% or 61.8% levels.
This is the main reason to wait for the 8.525 confirmation. ๐ช๐ฏ๏ธ
Sharia Status: โ
Confirmed Compliant.
Its low debt and industrial focus make it a top-tier pick for compliant portfolios. โช๏ธ๐
Verdict: AMOC is a "Strong Fundamental Buy" but a "Technical Wait." ๐๏ธ๐๏ธ
The setup is ready, but the market's overheated state suggests you shouldn't rush.
Wait for the 8.525 break to confirm the bulls are back in control and that the stock won't fall back into another year of sideways "boredom." ๐ก๏ธ๐
If you like my posts, please follow and boost ๐
๐ Get a $15 discount on your next subscription:
๐ www.tradingview.com โจ๐ธ
The Situation with Elsewedy Electric (SWDY)The Situation with Elsewedy Electric (SWDY)
While Elsewedy Electric remains a fundamentally strong powerhouse in the industrial sector, the recent buyout has fundamentally changed its trading dynamics.
Here is a breakdown of why itโs currently a "dead zone" for retail investors:
1. The Liquidity Trap
The stock is currently suffering from extremely low liquidity.
When a major entity buys out the majority of shares, the "free float" (the shares actually available for public trading) shrinks to almost nothing.
Market Cap: ~175B EGP
Daily Turnover: ~24M EGP
Liquidity Ratio: <0.01%
2. Retail Power vs. Price Action
With liquidity this low, the stock becomes "heavy." In a normal market, retail buying and selling can influence price trends.
Here, however, the volume is so negligible compared to the total valuation that retail movement will not move the needle.
The price is essentially locked in place by the lack of active participants.
3. Opportunity Cost
Investing is not just about whether a company is "good"
it's about whether your capital is working for you.
Bottom Line: Don't bother locking your capital in this stock right now.
Your money will likely sit stagnant while other liquid opportunities in the market pass you by.
GGCC โ Breakout Digesting the Capital Hike GGCC โ Breakout Digesting the Capital Hike ๐๐๏ธ
The Reality: A "Penny Stock" powerhouse with high-volume dynamics. ๐
GGCC manages a massive EGP 1.13 billion revenue stream, yet operates on razor-thin margins. While it boasts a solid 95% core contracting income, the real pressure comes from a 0.9x interest coverage ratio.
In a high-interest environment, this leaves almost no room for operational errors or payment delays. ๐โ
The Capital Shift: The stock is currently digesting a major supply shock. ๐
The 1.5:1 capital hike (stock dividend) in April 2026 has significantly increased the share count. While this move strengthened the balance sheet, it often creates a "valuation lag" as the market absorbs the new liquidity. ๐๐
Technical Analysis:
The "Ceiling" has finally cracked. ๐ข๐ง
The Breakout: The stock has officially snapped the downtrend that started at its 52-week high. ๐โจ
Breaking the main resistance today with strong liquidity (relative to its cap) confirms that the "Smart Money" is absorbing the new shares from the capital hike.
The Levels: 0.394 is the new "Line in the Sand" (Support). โ๐งฑ
As long as the price stays above this, the bullish bias remains.
The Obstacle: Watch for a heavy battle at 0.423.
This is the final gatekeeper before the 0.445 Fair Value. ๐งฑ๐น
The Volume: Liquidity is key here.
Because of the share count increase, we need sustained high volume to prevent the price from "drifting" back into consolidation. ๐๐
Sharia Status: ๐ข Compliant (Individual) / โ Excluded (Index).
A nuanced case GGCC passes standard AAOIFI financial screens for individual investors. However, it is excluded from the EGX33 Shariah Index because it fails the "best-in-class" liquidity and financial health filters required for index constituents. โช๏ธโ๏ธ
Verdict: GGCC is a "Technical Buy" with a fundamental warning label. ๐๏ธ๐๏ธ
The move past the downtrend and 200MA is a classic entry signal.
Enter with a stop-loss just below 0.394, but be prepared for volatility as the market continues to price in the new share structure. ๐ก๏ธ๐
If you like my posts, please follow and boost ๐
๐ Get a $15 discount on your next subscription:
๐ tradingview.com/pricing/?share_your_love=mnmabroukw36ix โจ๐ธ
RMDA โ Golden Zone Consolidation & Pricing Power RMDA โ Golden Zone Consolidation & Pricing Power ๐๐
The Reality: A true fundamental "Engine" disguised by debt! โ๏ธ
RMDA's revenue growth is massive (+48%), and the core business is far more profitable than the bottom line looks.
While net income is EGP 268M, the operating income is nearly EGP 942M.
The "gap" is simply the cost of debt used to fuel their high-margin expansion into chronic-care medicine. ๐ฅ๐
The Cash Power: RMDA is a cash-flow monster, generating EGP 1.22B from operations annually. ๐ฐ
Physical cash conversion is high, and the company has successfully pushed through price increases across its portfolio a move that will fully impact the 2026 bottom line.
Despite EGP 3.1B in liabilities, the growth in cash flow is keeping the debt manageable. ๐ก๏ธโก
Technical Analysis:
The "Correction" is meeting the "Golden Ratio." ๐ข๐ง
The Golden Zone: The stock has corrected 50% of its previous wave and is now finding support in the "Golden Zone" (61.8% Fib) of the last dip.
The RSI Warning: We have a bearish RSI divergence from the last high.
This means while the price is stabilizing, the momentum isn't "explosive" yet.
Expect more consolidation before a breakout. ๐๐ฉน
The Trigger: The immediate hurdle is 4.73.
A daily close above this level invalidates the bearish divergence and opens the door for a retest of the 5.12 ATH. ๐๐๏ธ
The Safety Net: If the current level fails, the next major support is at 4.40.
For conservative investors, this is the "Add" zone to increase your share count. โ๐งฑ
Sharia Status: โ
Confirmed Compliant. Rameda is a high-liquidity member of the EGX33 Shariah Index (April 2026).
Its balance sheet and core pharmaceutical activities pass all quantitative screens. โช๏ธ๐
Verdict: RMDA is a "High-Quality Buy" on dips. ๐๏ธ๐๏ธ
The fundamental strength of the core business provides a massive safety margin even if technical momentum is currently lagging.
Watch for the 4.73 break to signal the start of the run toward 5.35. ๐ก๏ธ๐
If you like my posts, please follow and boost ๐
๐ Get a $15 discount on your next subscription:
๐ www.tradingview.com โจ๐ธ
ATQA โ The 10.36 Breakout vs. The Billet SqueezeATQA โ The 10.36 Breakout vs. The Billet Squeeze ๐โ๏ธ
The Reality: A "Rolling Mill" caught in a brutal margin squeeze. ๐๐
ATQA reported a staggering 94.7% drop in 2025 net profit (down to EGP 30.7M from EGP 577.7M in 2024), despite revenue actually growing to EGP 6.33B.
Because they aren't an integrated producer (like Ezz Steel), they are at the mercy of rising global billet prices and energy costs, leaving them with a razor-thin 0.5% net margin. ๐๏ธ๐ฅ
The Valuation Gap: The financials are in a "Danger Zone." โ ๏ธ With EPS at a tiny 0.026 EGP, the P/E ratio is mathematically distorted at over 400x.
However, the company holds a secret weapon: a "Flawless Balance Sheet" where they actually hold more cash than debt a massive tactical advantage in Egypt's high-interest 2026 climate. ๐ก๏ธ๐ฐ
The Technical Break: The chart is waking up! ๐โจ
The stock officially exited its downtrend, trading above the 200MA and breaking the 10.36 main resistance with strong volume.
But caution is key: the upside might be capped by a bearish Fair Value Gap (FVG) near my 11.25 target. ๐ข๐งฑ
Sharia Status: โ Non-Compliant. ATQA remains excluded from the EGX33 Shariah Index.
While it has a net cash position, the interest income generated from its massive deposits exceeds the 5% purification threshold, and its credit facilities for raw material imports breach debt ratio limits. โช๏ธ๐ซ
Verdict: A Quality Wait-and-See.
The technical breakout is real, but the fundamental "Margin Squeeze" makes this a low-conviction trade.
Wait for consolidation above the 10.36 support and a recovery in earnings before committing long-term capital. ๐ก๏ธโ๏ธ๐๏ธ
If you like my posts, please follow and boost ๐๐
Get a $15 discount on your next subscription:๐ www.tradingview.com โจ๐ธ
IEEC โ Technical Breakout vs. Accrual BloatIEEC โ Technical Breakout vs. Accrual Bloat ๐๐๏ธ
The Reality: (IEEC) is currently a "Speculative Small-Cap" that is struggling to turn projects into profits. ๐
Revenue growth is visible, but the 87% collapse in net income is a massive red flag. ๐ฉ
The company is suffering from "Slow Collection Syndrome," common in the construction sector, where receivables age significantly before turning into cash.
At a Debt-to-Market Cap ratio that is increasingly strained, the company is one missed milestone away from a liquidity crisis. ๐๏ธ๐ฅ
The Valuation: Despite an 87% drop in TTM net income, my "Asset Recovery" model targets 0.380 EGP. ๐งฑโ๏ธ
This uses an adjusted EPS of 0.019 EGP and a P/E of 18.5x, plus a premium because the stock is trading significantly below its 0.63 EGP Book Value.
While the math suggests it's at "scrap value," the operational risks remain massive. ๐๏ธ๐ฅ
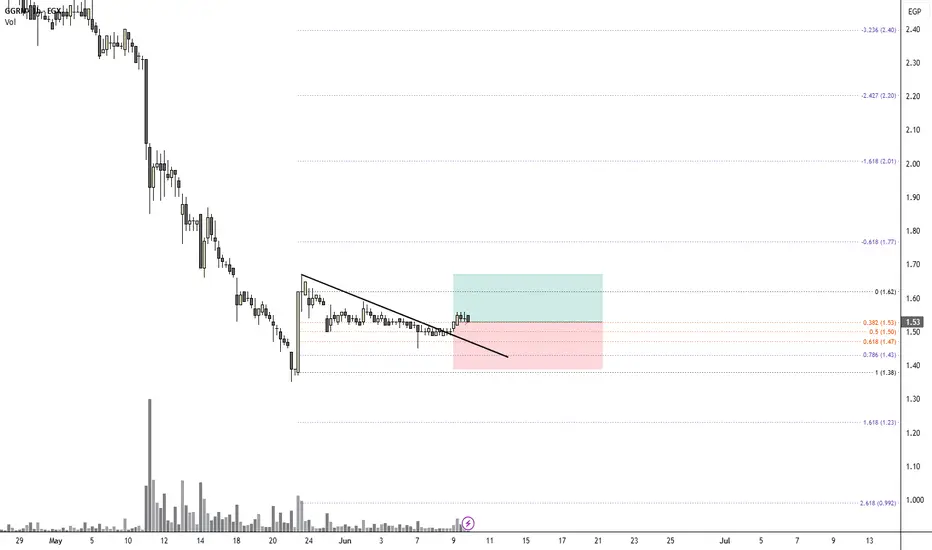
The Strategy: Technically, the stock cleared an important resistance and Fib level at 0.435, but this looks like a momentum play without a foundation.
I am passing on this until earnings show actual improvement. ๐ก๏ธโ๏ธ
Sharia Status: โ Non-Compliant. IEEC fails the quantitative screens for the EGX33 Shariah Index (April 2026). The primary hurdle is the Debt Ratio, which far exceeds the permissible 30% threshold for interest-bearing liabilities. โช๏ธ๐ซ
Verdict: A Momentum Mirage.
The technical breakout at 0.435 is enticing, but the fundamental decay and debt load make this a high-risk gamble.
I'm staying on the sidelines until the cash conversion improves. ๐ก๏ธ๐
If you like my posts, please follow and boost ๐
๐ Get a $15 discount on your next subscription:
๐ www.tradingview.com โจ๐ธ
UNIP โ Scrap Value vs. Financial Reality UNIP โ Scrap Value vs. Financial Reality ๐๐ฆ
The Reality: A classic "Value Trap" in the penny stock realm. ๐ธ๏ธ
While revenue sits at EGP 1.37 billion, net income has collapsed by 87% to a mere EGP 13.05 million.
With a razor-thin net profit margin of 0.95%, the company is effectively dancing on the edge of a loss. โธ๏ธ๐ด
The Cash Squeeze: The balance sheet is under heavy fire. ๐
Less than 40% of operating profit is turning into cash, as liquidity remains trapped in slow-moving inventory.
With a staggering 111.7% Debt-to-Equity ratio, UNIP is gasping for air in this high-interest environment.
Itโs currently "dead money" unless a miracle restructuring or merger occurs. ๐ฉน๐ฆ
The Valuation: On paper, it looks like a bargain, trading at EGP 0.28 less than half its Book Value of 0.63 EGP. ๐
While my mathematical Fair Value estimate of 0.380 EGP (using a recovery P/E of 18.5x) suggests upside, the market is currently pricing it at "scrap" value for a reason. ๐งฑโ๏ธ
Sharia Status: โ Non-Compliant. UNIP fails the quantitative screens for the EGX33 Shariah Index (April 2026).
The heavy debt used to finance production and non-permissible interest income from its cash management break both the 30% and 5% thresholds. โช๏ธ๐ซ
Verdict: A Cyclical Gamble.
UNIP is at a "Cyclical Bottom," but without a catalyst, itโs just a falling knife.
I don't even need to technical analysis this stock; enter at your own risk, but at least wait until it is over 0.30. ๐ก๏ธ๐
If you like my posts, please follow and boost ๐
๐ Get a $15 discount on your next subscription:
๐ www.tradingview.com โจ๐ธ
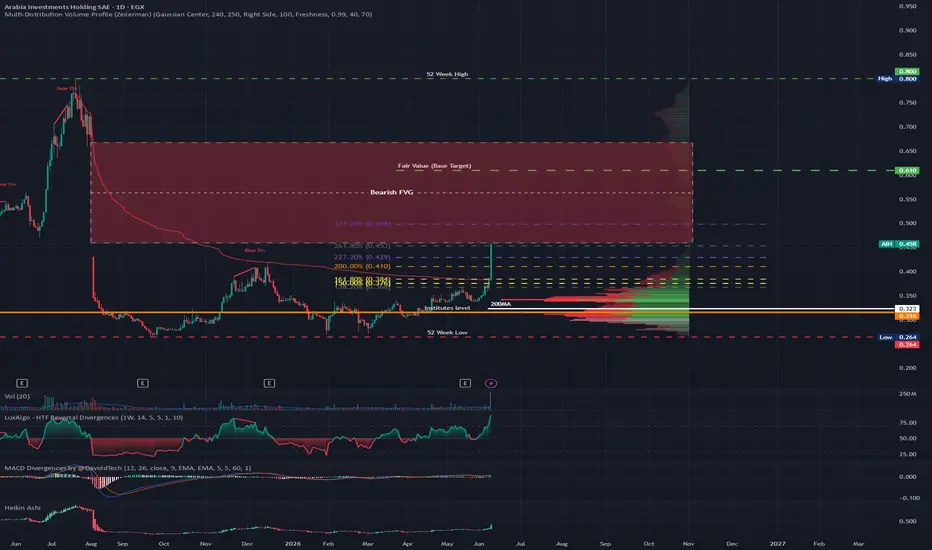
CCAP โ The ERC Breakout vs. The Overbought WallCCAP โ The ERC Breakout vs. The Overbought Wall ๐๐ฆ
The Reality: The headline news is massive: the Egyptian Refining Company (ERC)โQalaaโs crown jewel reported a $120M net profit for the first four months of 2026. ๐๐ฐ
More importantly, ERC repaid its last $63M senior debt in March 2026.
This is the "Golden Key" that finally unlocks ERCโs ability to distribute dividends back to Qalaa, ending a decade-long liquidity drought. ๐๏ธ๐
The Debt Weight: Don't let the profit fool you the baggage is still heavy. ๐งณ
Consolidated revenue is a monster at ~EGP 150B, but even after a EGP 39B debt reduction in late 2025, debt servicing and settlements remain the primary drain on cash. ๐โ
While energy (TAQA) and cement (ASEC) are cash-efficient, Qalaa is still a story of "Managing the Mountain." ๐๏ธ๐ ๏ธ
The Strategy: Technically, the stock is "on fire," but itโs a dangerous heat. ๐ฅ
It just cleared the 3.95 resistance with massive liquidity, breaking all sweeps since December.
However, RSI is deep in overbought territory, and the price is hugging its 52-week high of 4.44. ๐ข๐
The "Smart Money" knows CCAPโs history of trapping retail investors for months.
This is a classic "Bull Trap" risk. ๐๐
Sharia Status: โ Non-Compliant. CCAP remains disqualified from the EGX33 Shariah Index. Despite the restructuring, its Debt-to-Asset ratio is still a "Red Alert," and its diverse financial and industrial holdings generate interest income far above the permissible 5% threshold. โช๏ธ๐ซ
Verdict: A "Pass" with a Warning. The news is the best itโs been in years, but the technical setup is overextended and the debt remains systemic.
Don't let the recent "Liquidity Surge" blind you to the historical "CCAP Trap." ๐ก๏ธ๐
If you like my posts, please follow and boost ๐
๐ Get a $15 discount on your next subscription:
๐ www.tradingview.com โจ๐ธ
SCFM โ The Squeeze Breakout vs. Valuation Gravity SCFM โ The Squeeze Breakout vs. Valuation Gravity ๐๐
The Reality: A spectacular "Turnaround Tale" in progress! ๐ญ
After years of struggle, SCFM has flipped the script, reporting a 60.5 Million EGP profit for the last 9 months compared to a loss in the prior period.
Revenue is up nearly 55%, proving that better distribution efficiency is finally paying off. ๐๐
The Valuation Trap: The market is "paying for the future" today. ๐ธ
At a P/B of 41.8x and a P/E of 23.3x (vs. the industry average of 15.9x), the stock is significantly more expensive than its peers.
While the operational recovery is real, the Investing Pro Fair Value of 129.36 EGP suggests the current price of 221.49 EGP is fueled by speculation. ๐ข๐
Technical Analysis:
The "Squeeze" has popped, but the ceiling is holding firm. ๐ข๐ง
The Squeeze: Throughout March, the Bollinger Bands tightened into a 5% channel width, signaling an imminent move. ๐๐ฉน
The Breakout: The price broke the BB with average volume, but the momentum stalled at the 252 main resistance. ๐งฑ๐น
Failing to clear this for two days suggests the bulls are running out of breath.
The Risk: Because the stock is fundamentally Overbought (P/E 23.3x), a failure to break 252 could lead to a sharp pullback back inside the old downtrend channel. ๐ช๐ฏ๏ธ
The Support: Immediate support sits at the 210.00 breakout point.
If this fails, the next logical magnet is the fair value floor. โ๐งฑ
Sharia Status: โ Non-Compliant. SCFM fails the quantitative screens for the EGX33 Shariah Index (April 2026).
The primary issue is non-permissible interest income from its high liquidity reserves, which exceeds the 5% threshold. โช๏ธ๐ซ
Verdict: SCFM is a "Fundamental King" but a "Technical Overachiever." ๐๏ธ๐๏ธ
Chasing the stock here is risky given how far it has moved from its mathematical fair value.
I am keeping this in my Watchlist for the next earnings cycle.
I want to see if the "Potential" becomes "Permanent" before committing capital at these multiples. ๐ก๏ธ๐
If you like my posts, please follow and boost ๐
๐ Get a $15 discount on your next subscription:
๐ www.tradingview.com โจ๐ธ
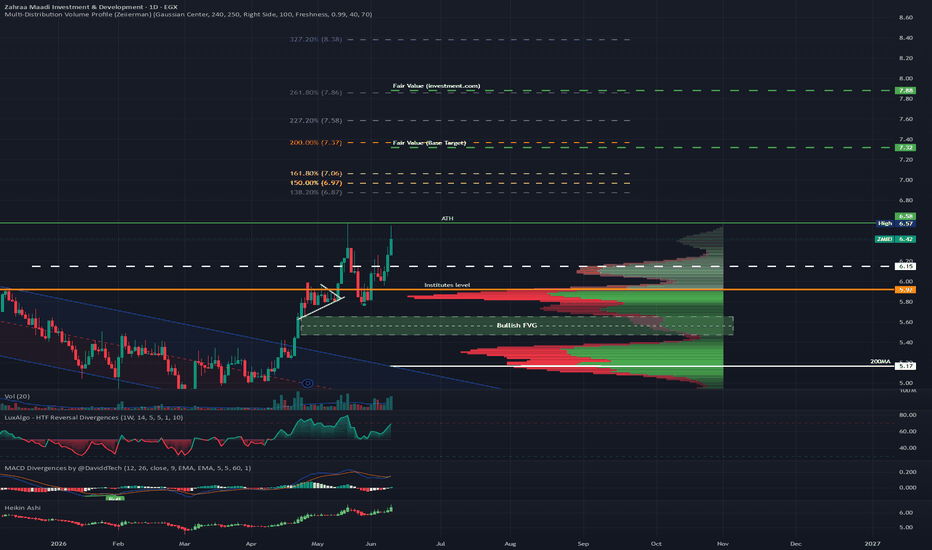
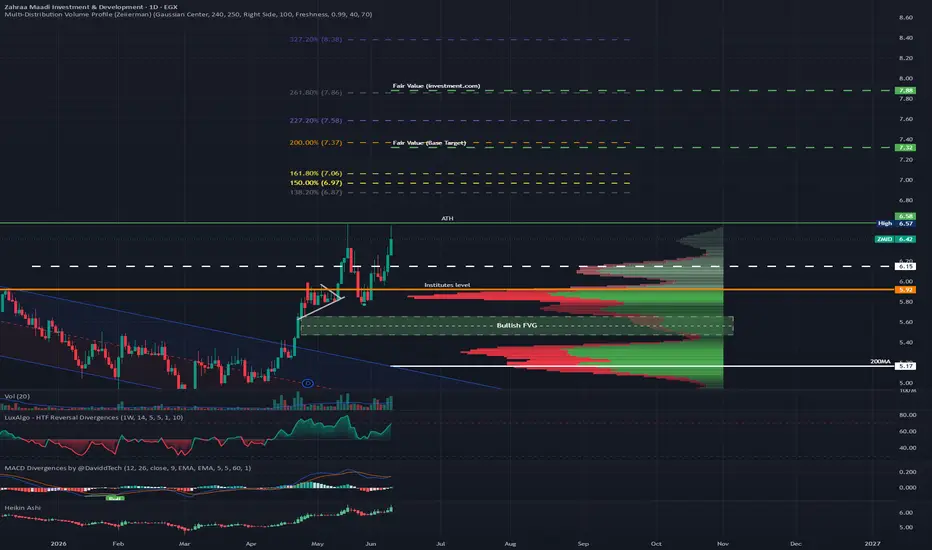
ZMID (Zahraa Maadi): The Fundamental Diamond ZMID (Zahraa Maadi): The Fundamental Diamond ๐๐
The Cash King: This as a "Deep Value" titan.
Passing the cash-flow health test with flying colors is rare for the sector.
With zero debt and a balance sheet that holds more cash than liabilities.
ZMID is the ultimate defensive "Safe Haven" in Egyptian real estate. ๐ก๏ธ๐ฆ
The Valuation Gap: Trading at a P/E of ~8.3x with a massive Gross Margin of 86.7%, the stock is a high-quality machine.
The Technical Trigger:
The Hidden Signal: The massive volume spike seen today is a classic sign of institutional accumulation. ๐๐
The Gatekeeper: The level to watch is 5.60 EGP.
A clean daily close above this resistance is the confirmation that the sideways "Distribution/Accumulation" game is over and the next impulsive wave has begun. ๐งฑ๐
Sharia Status:
โ Status: Non-Compliant (Not Listed).
Audit: Despite its rock-solid fundamentals, it remains a "No-Go" for those strictly following the index until it undergoes the official certification process. โช๏ธ๐ซ
Verdict: Strong Buy on Breakout.
Itโs not a trap; itโs a powerhouse waiting for the market to realize its worth.
If you like my posts, please follow and boost ๐
๐ Get a $15 discount on your next subscription:
๐ www.tradingview.com โจ๐ธ
ORWE โ The Head & Shoulders Standoff ORWE โ The Head & Shoulders Standoff ๐๐งถ
The Reality: A "Fundamental Fortress" facing a margin squeeze. ๐ฐ
Oriental Weavers delivered a masterclass in 2025, with EGP 26.6B in revenue and an elite 89% cash conversion rate.
Its balance sheet is nearly bulletproof, with a Net Debt/EBITDA of 0.2x, meaning it is virtually immune to the high-interest-rate shocks affecting other Egyptian industrials. ๐ก๏ธ๐
The 2026 Headwind: The "Goldilocks" period of 2025 is ending. ๐ฌ๏ธ๐ฅ
While 2025 benefited from low Polypropylene (raw material) prices, 2026 is seeing a double-whammy: rising raw material costs and a strengthening USD.
This means profit margins will almost certainly contract compared to last year's record highs. ๐๐ก๏ธ
The Strategy: The technicals and fundamentals are currently in a standoff. ๐ญ
The price is trapped in a massive sideways channel, and a Head and Shoulders pattern has formed.
This is a classic "Wait and See" moment the technicals want to break the pattern, but the fundamental pressure from raw materials might be the catalyst that confirms the bearish drop. ๐ง๐ฏ
Sharia Confirmation: โ
Confirmed Compliant. As a mainstay of the EGX33 Shariah Index, ORWE remains a top-tier pick for ethical and institutional investors. โช๏ธ๐
Verdict: ORWE is a "Fundamental Giant" in a "Technical Trap." ๐๏ธ๐๏ธ
Chasing the stock while the Head and Shoulders is active is gambling.
We are watching closely for a confirmed breakout or breakdown.
Stay patient the market will tell us its next move soon. ๐ก๏ธ๐
If you like my posts, please follow and boost ๐
๐ Get a $15 discount on your next subscription:
๐ www.tradingview.com โจ๐ธ
Verdict: The High-Quality Hold. ORWE is one of the best-managed companies on the EGX, but the 2026 cost-push inflation is a real threat. Don't pre-empt the move; let the Head and Shoulders pattern resolve before entering or exiting. ๐ก๏ธโ๏ธ
VALU โ RSI Divergence & The 34.40 CeilingVALU โ RSI Divergence & The 34.40 Ceiling ๐๐
The Reality: A "Real Earnings" powerhouse! ๐๏ธ๐
Valmore is a rare example of a diversified holding company where reported profits are backed by cold, hard cash.
With USD-denominated revenue from fertilizers and energy, it is the ultimate natural hedge against EGP volatility.
Its 6.82% USD-equivalent yield remains one of the most attractive in the region. ๐ตโ
The Transition: The rebrand to "Valmore" isn't just a name change; itโs a strategic shift from a "Kuwaiti bridge" to a North African Private Equity leader. ๐
Technical Analysis:
The price is coiling within an uptrend channel, but the momentum is fading. ๐ข๐ฉน
The Barrier: 34.40 is the line in the sand. ๐งฑ๐น
The price has failed to break and hold this level for over a month.
The Divergence: While the price is making equal highs, the RSI is making Lower Highs.
This is a classic Bearish Divergence, suggesting a pullback is imminent. ๐๐
The Trend Line: I expect a retest of the white trend line.
This is the "Buy Zone" where the uptrend pattern stays intact. โ๐งฑ
The Breakout Path: If the price clears 34.40, it faces one last hurdle at 36.75.
Above that, it enters "Blue Sky" territory where no historical supply exists until the 43.15 Fair Value. ๐๐ฐ๏ธ
Sharia Confirmation: โ Non-Compliant.
While the core industrial subsidiaries (Sprea, NatEnergy) are Halal, the companyโs non-banking financial services (NBFS) and interest-bearing treasury management keep it off the Sharia list. ๐ฆ๐ซ
Verdict: Valmore is a "Buy the Dip" stock, not a "Buy the Breakout" stock right now. ๐๏ธ๐๏ธ
The RSI divergence is a warning you shouldn't ignore.
Keep your eyes on the 31.00 support if it holds, itโs a gift.
If it breaks, the uptrend is over. ๐ก๏ธ๐
If you like my posts, please follow and boost ๐
๐ Get a $15 discount on your next subscription:
๐ www.tradingview.com โจ๐ธ
EGCH โ Liquidity Surge vs. Sector Headwinds EGCH โ Liquidity Surge vs. Sector Headwinds ๐๐งช
The Reality: A "Value Trap" with massive operational weight. ๐๏ธโ๏ธ
Kima is fundamentally efficient, converting most of its operating profit into cash and trading at a P/E of 6.94x (way below the sector's 15.5x).
However, the "Kima 2" mega-project debt has left it with a 75% Debt-to-Equity ratio, making it hypersensitive to the 2026 interest rate climate. ๐โ
The Sector Drag: The "Fertilizer Boom" is hitting an electricity-shaped wall. ๐๐
Egypt's current power issues are directly impacting production capacity for the sector.
While Kima is a vital agricultural player, these macro headwinds make it difficult to justify a bullish run in the short term. ๐๐ก๏ธ
Technical Analysis:
Is the downtrend finally over? The signals are mixed but leaning bullish. ๐ข๐ง
The Liquidity Signal: The recent EGP 133M volume spike is a major "smart money" indicator.
This is the highest intensity since the 52-week high, suggesting accumulation at these levels. ๐๐
The Fib Levels: The stock respected the 61.8% Fib (11.10) perfectly during consolidation.
The close above the 50% Fib (11.60) is the first step toward a trend reversal. ๐โช
The Barrier: Despite the positive momentum, the stock is still inside the broader downtrend channel. ๐งฑ๐ป To confirm a "Change of Character," the price needs to decisively clear the 12.20 main resistance.
The Support: The 11.10 level is now our "line in the sand." If it breaks back below this, the consolidation was a fake-out. โ๐งฑ
Sharia Status: โ Non-Compliant. EGCH fails the quantitative screens for the EGX33 Shariah Index (April 2026). Its debt from massive expansion projects and interest income from cash reserves consistently exceed the 30% and 5% thresholds. โช๏ธ๐ซ
Verdict: Kima is showing the best technical signs it has seen in months, but the fundamental "Sector Decline" in fertilizers makes it a risky "early" buy. ๐๏ธ๐๏ธ
Keep your capital on the sidelines until you see a daily close above 12.20.
There is plenty of room for profit between 12.20 and the fair value don't feel the need to catch the absolute bottom. ๐ก๏ธ๐
If you like my posts, please follow and boost ๐
๐ Get a $15 discount on your next subscription:
๐ www.tradingview.com โจ๐ธ