NCCW remains in a major downtrendNCCW remains in a major downtrend ๐.
The stock broke a key trendline, failed the retest, and continued lower โ๐.
Current resistance sits around 4.9 ๐งฑ; if the downtrend persists, the next key level to watch is 3.8 ๐๐.
Any sign of real positivity would require price to close above the 200 MA, hold above 5.62, and break and close above 6.1 ๐โ๏ธ.
๐ If you like my posts, please consider boosting
โ ๏ธ Disclaimer: This is general information only and not financial advice. For personal guidance, please talk to a licensed professional.
CERA is in a bottleneck zone CERA is in a bottleneck zone โ ๏ธ.
Price broke a major trendline ๐ but failed the retest โ.
Either we see a pullback followed by a close back above the trendline next week ๐๐, or price may test the 200 MA around 1.0 ๐๐.
I wouldnโt consider any entry unless price closes above 1.25 and breaks out of the triangle pattern ๐โ๏ธ.
The yellow box marks the Rumble trend level ๐จ๐.
๐ If you like my posts, please consider boosting
โ ๏ธ Disclaimer: This is general information only and not financial advice. For personal guidance, please talk to a licensed professional.
VLMRA remains in a downtrend wave VLMRA remains in a downtrend wave ๐.
For higher-risk traders only โ ๏ธ any consideration comes after a break and close above 24.8 ๐โ๏ธ.
Upside levels to watch are 26.68 ๐ฏ, 26.5, and 28.75 ๐.
๐ If you like my posts, please consider boosting
โ ๏ธ Disclaimer: This is general information only and not financial advice. For personal guidance, please talk to a licensed professional.
MPCI broke out of the triangle pattern MPCI broke out of the triangle pattern ๐โ๏ธ.
Next upside levels include the Fib target at 176 (fair price) ๐ฏ, followed by 197.5 ๐ and 224 ๐.
That said, a pullback is possible due to a bearish RSI divergence, with the 0.382 Fib level around 165 acting as a potential reflect zone ๐๐.
๐ If you like my posts, please consider boosting
โ ๏ธ Disclaimer: This is general information only and not financial advice. For personal guidance, please talk to a licensed professional.
ORWE is showing signs of strength but no confirmed breakoutORWE is showing early signs of strength ๐, supported by strong volume ๐๐, but no confirmed breakout yet โ ๏ธ.
Price is still trading within the triangle pattern ๐, and I wouldnโt turn positive unless it closes above 24 ๐โ๏ธ โespecially with RSI showing a bearish divergence ๐โ ๏ธ.
Until then, take care and avoid rushing in ๐ง๐.
๐ If you like my posts, please consider boosting
โ ๏ธ Disclaimer: This is general information only and not financial advice. For personal guidance, please talk to a licensed professional.
ISPH is showing strong momentum ISPH is showing strong momentum ๐, breaking out of a consolidation phase since August โ25 ๐๐.
Key upside levels include the ATH at 13.7 ๐๏ธ, followed by 14, 14.7, and a longer-term target at 15.8 ๐ฏ๐.
These targets are medium- to long-term โณ. If you missed the move, donโt chase the price wait for a pullback โ ๏ธ๐.
๐ If you like my posts, please consider boosting
โ ๏ธ Disclaimer: This is general information only and not financial advice. For personal guidance, please talk to a licensed professional.
isph-egyprofessional technical analysis in English based on the second chart you shared (monthly timeframe โ EGP-denominated stock, Insina Pharma):
๐ Primary Trend (Long-Term)
The long-term trend is bullish.
Price is moving within a well-defined ascending channel (pink trendlines).
The strong rally from the 2022โ2023 lows confirms a structural trend reversal from bearish to bullish.
๐ฃ Highlighted Time Zone (Purple Area)
The shaded purple zone represents a high-momentum expansion phase.
This phase shows vertical price acceleration, usually followed by:
Consolidation
Or a corrective pullback before continuation
๐ Such zones often mark late-stage momentum, where risk increases for new entries.
๐ฆ Key Resistance / Supply Zone
Marked blue zone:
Lower bound: 13.287
Upper bound: 14.187
This area represents:
Prior resistance
Channel upper-mid interaction
Likely profit-taking / supply zone
โก๏ธ Price is currently below this resistance, rejecting from lower levels.
๐ด Current Price Context
Current price: ~10.85
Price has pulled back after a strong rally
This pullback so far looks corrective, not trend-breaking
๐ป Scenarios
โ Bearish / Deeper Correction Scenario
Triggered if:
Monthly close below the rising channel midline
Loss of momentum structure
Downside targets:
9.50 โ 9.00
Stronger support near 8.00 โ 7.50
Channel base (major support)
๐ This would still be considered a healthy correction within a bullish trend unless the channel is broken.
โ
Bullish Continuation Scenario (Preferred)
Triggered if:
Price holds above the rising channel support
Builds a base between 9.50 โ 11.00
Then breaks above 13.30
Upside targets:
14.20 (first major resistance)
16.00 โ 16.80
Channel upper boundary extensions beyond that
๐ A confirmed breakout above 14.20 would signal trend continuation, not just a bounce.
๐ฏ Risk & Positioning Notes
Chasing price at highs is risky after such an extended rally
Best risk-reward comes from:
Pullbacks to channel support
Or confirmed breakout + retest above 13.30โ14.20
Long-term investors should focus on monthly closes, not intramonth volatility
๐ง Summary
This is a structurally bullish stock in a long-term uptrend.
The current phase is a cooling-off / correction, not a trend failure.
13.30โ14.20 remains the key level separating consolidation from continuation.
MPCO rebounded from the 200 MA &broke out of the triangle patterMPCO rebounded from the 200 MA ๐๐ and broke out of the triangle pattern with strong volume ๐๐.
The main resistance to watch is 1.72 ๐งฑ.
A break and close above this level would open the way toward the first target at 1.9 ๐ฏ, followed by the second target at 2 ๐.
โ ๏ธ Note: RSI is showing a bearish divergence ๐, so some consolidation or a retest remains possible before continuation.
โ ๏ธ Disclaimer: This is general information only and not financial advice. For personal guidance, please talk to a licensed professional.
RMDA rebounded from the fair value gap & gained momentumRMDA rebounded from the fair value gap ๐๐, gained momentum, and broke the triangle pattern ๐โ๏ธ.
Price will now hit a strong resistance at 2.27 ๐งฑ.
A pullback is possible to retest the triangle pattern again, especially with a bearish RSI divergence in place ๐โ ๏ธ.
A deeper retest toward the fair value gap around 2.25 could also occur to rebuild momentum before a continuation toward 3.566 ๐๐.
โ ๏ธ Disclaimer: This is general information only and not financial advice. For personal guidance, please talk to a licensed professional.
ISMQ is retesting the triangle pattern ISMQ is retesting the triangle pattern ๐๐, while RSI is showing a bearish divergence ๐โ ๏ธ.
If price fails to close above the triangle, it may move to test the lower boundary of the pattern again ๐๐.
โ ๏ธ Disclaimer: This is general information only and not financial advice. For personal guidance, please talk to a licensed professional.
BONY is starting to show some positive signsBONY is starting to show some positive signs ๐, but I wouldnโt consider any entry unless price breaks above 3.82 and clears the downtrend line ๐โ๏ธ.
โ ๏ธ Disclaimer: This is general information only and not financial advice. For personal guidance, please talk to a licensed professional.
CSAG is building toward a solid uptrendCSAG is building toward a solid uptrend ๐.
Price has broken the 0.5 Fib level ๐โ๏ธ and faced some resistance at the reverse fair value gap ๐งฑ.
I expect a breakout from that zone, opening the way toward the first target at 36 ๐ฏ and the fair value target at 38.3 ๐ฐ.
โ ๏ธ Disclaimer: This is general information only and not financial advice. For personal guidance, please talk to a licensed professional.
EGCH is once again attempting to break the strong resistance at EGCH is once again attempting to break the strong resistance at 12.57 ๐งฑ๐.
Donโt rush to buy โ ๏ธ โ confirmation requires a clear breakout and close above this level ๐โ๏ธ.
If the breakout fails, a pullback toward the 200 MA around 10.1 ๐๐ is possible.
โ ๏ธ Disclaimer: This is general information only and not financial advice. For personal guidance, please talk to a licensed professional.
UNIP has a positive trendWeekly chart
Technical analysis and advice for Universal for Paper and Packaging Materials (UNIP) on the Egyptian Stock Market (EGX) is detailed below:
Executive Summary: Technical Advice
Recommendation: Accumulate / Buy on Dips The stock is currently in a positive technical trend following a major price adjustment caused by a stock dividend (free shares) in late 2025. While some investors in social groups express frustration due to the lower nominal price, the technical indicators suggest strong momentum and accumulation.
1. Important Context: The "Price Drop" Misconception
If you see comments on Facebook groups complaining that the stock "crashed" from 0.80+ to the 0.20s, it is crucial to understand this was not a loss in value but a corporate action.
Event: On September 24-25, 2025, the company distributed 2 free shares for every 1 original share (a 3:1 split effect).
Impact: This naturally divided the share price by roughly 3. The current price of ~0.29 EGP is technically equivalent to the old ~0.87 EGP. The stock is essentially trading near its pre-split highs, which is a bullish sign.
2. Technical Indicators Analysis
The automated technical readings are overwhelmingly positive:
Trend: Bullish (Upward). The stock is trading above its key Moving Averages (5, 10, 20, 50, and 100-day), signaling a strong short-to-medium-term uptrend.
RSI (Relative Strength Index): ~70 (High/Overbought Border). This indicates very strong buying momentum. While it suggests the stock is "expensive" in the very short term, in strong trends, an RSI > 70 often signals a breakout rather than a reversal.
MACD (Moving Average Convergence Divergence): Positive. The MACD line is above the signal line, confirming the bullish momentum is still active.
Volume: Trading volumes have been healthy, indicating genuine interest from buyers at these new price levels.
3. Key Chart Levels (Support & Resistance)
Based on the post-split price action:
Current Price: ~0.292 EGP
Resistance (Target) 1: 0.305 EGP (Psychological barrier and recent high).
Resistance (Target) 2: 0.320 - 0.330 EGP (Extension target if 0.30 is broken with volume).
Support (Buy Zone): 0.282 - 0.285 EGP. This is the "floor" the stock has recently established.
Stop Loss: Below 0.270 EGP. A close below this level would invalidate the current bullish setup.
4. Social Sentiment (Facebook & Forums)
The "Trapped" Investor: Many retail investors on forums who bought at "highs" before the split often feel "stuck" because they see the price as 0.29 vs. their buy price of 1.00+, forgetting they now own 3x more shares. Ignore the panic from these comments; their "loss" is likely psychological rather than realized if adjusted for the split.
The Smart Money: Experienced traders are viewing the 0.28 - 0.29 zone as an accumulation phase, expecting the stock to eventually re-test the equivalent of its old highs (which would be ~0.40 - 0.50 in current terms over the long run).
5. Trading Plan & Advice
For Short-Term Traders: Look for entries as close to 0.285 as possible. Take profit partially at 0.305 and leave the rest for a potential breakout. Watch volume closely at 0.30; if it breaks with high volume, the rally could extend quickly.
For Investors: The stock is financially stable with recent capital increases. Hold your position if you already own it. If the price dips to 0.275, it is a strong "Buy" opportunity.
Note: AI generated based on my thoughtful prompt.
AMIA formed a double bottomAMIA formed a double bottom ๐โ๏ธ and broke the downtrend channel with strong volume ๐๐.
You can either:
โข Wait for a retest of the 0.5 Fib level at 4.54 ๐ (my preferred option)
โข Enter after a close above 4.94 ๐โ
โ ๏ธ Disclaimer: This is general information only and not financial advice. For personal guidance, please talk to a licensed professional.
AMER is seeing strong volume & has broken the triangle patternAMER is seeing strong volume ๐๐ and has broken the triangle pattern ๐โ๏ธ.
Caution โ ๏ธ heavy selling pushed the price below the 0.382 Fib level ๐.
I wouldnโt consider entering unless it closes above 2.2 with strong volume ๐โ
.
โ ๏ธ Disclaimer: This is general information only and not financial advice. For personal guidance, please talk to a licensed professional.
ORAS is gaining strong volume ORAS is gaining strong volume ๐๐, signaling the start of an uptrend.
The stock broke its downtrend channel and closed above the main resistance ๐โ๏ธ.
Upside targets:
โข First: Fib 0.382 at 439 ๐ฏ
โข Second: Fib 0.617 at 466.5 and the fair value gap ๐
โข Third: 485 ๐
โข All-time high: 513 ๐๏ธ
โ ๏ธ Disclaimer: This is general information only and not financial advice. For personal guidance, please talk to a licensed professional.
TALM has been consolidating since October TALM has been consolidating since October ๐๐.
A positive early sign is yesterdayโs trendline breakout on strong volume, followed by a successful retest and rebound ๐โ๏ธ.
That said, this alone isnโt sufficient โ ๏ธ, I wouldnโt consider entry unless price breaks and closes above 16.4 with strong volume ๐๐.
Long term, the stock looks positive ๐, but low liquidity remains a key characteristic and risk ๐งโ ๏ธ.
โ ๏ธ Disclaimer: This is general information only and not financial advice. For personal guidance, please talk to a licensed professional.
ECAP printed strong volume today ECAP printed strong volume today ๐๐ฆ, but caution is still warranted as the stock remains in a downtrend โ ๏ธ๐.
Early signs of a trend shift would be a close above the 200 MA, the 0.382 Fib level, the downtrend line, and RSI breaking above the 50 level ๐๐โ๏ธ.
Upside levels to watch include the main resistance at 31.8 ๐ฏ, followed by 33.45, and the 52W high at 35.4 ๐๏ธ.
โ ๏ธ Disclaimer: This is general information only and not financial advice. For personal guidance, please talk to a licensed professional.
LCSW is rebounding after closing the fair value gap LCSW is rebounding after closing the fair value gap ๐๐.
For the outlook to turn positive, price needs to close above the 200 MA and the main resistance 25.5๐โ๏ธ.
Caution is advised โ ๏ธ โ this rebound is accompanied by a bearish RSI divergence ๐, so a retest remains possible.
If volume stays strong ๐๐, upside targets are 27.3 ๐ฏ, followed by the fair value at 31 ๐ฐ.
โ ๏ธ Disclaimer: This is general information only and not financial advice. For personal guidance, please talk to a licensed professional.
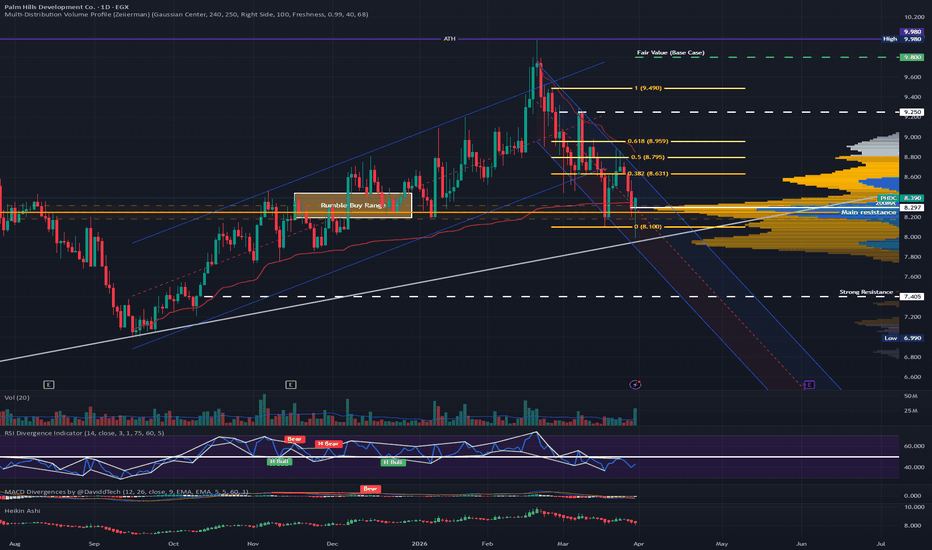
PHDC Setup ๐โ Breakout & Go
โข ๐ฏ Entry: โฅ 8.95โ9.00 (1H or Daily close/hold)
โข ๐ก๏ธ Stop: 8.70
โข ๐ฏ Targets: T1 9.30 ยท T2 9.50โ9.80
โข Confluences (3):
โข Range top/round number 9.00 โ resistance-flip
โข EMAs stacked up (9/20/50) = trend confirmation
โข Upper-BB expansion + rising green volume
EMFD is rebounding from the 200 MA and a key resistance levelEMFD is rebounding from the 200 MA and a key resistance level ๐๐, while forming a double bottom pattern ๐โ๏ธ.
Entry is only considered after an upward triangle breakout with a close above it ๐๐.
A strong resistance sits around 9.6 ๐งฑ.
Upside targets are 10.5 ๐ฏ, followed by the fair value at 11.88 ๐ฐ.
โ ๏ธ Disclaimer: This is general information only and not financial advice. For personal guidance, please talk to a licensed professional.