Long
Long
 Long
Long
 Long
Long
 Long
Long
 Long
Long
 Long
Long
 Short
Short
MCQE is a High-Conviction Fundamental and Technical Buy on Dips.MCQE is a High-Conviction Fundamental and Technical Buy on Dips. 📉🌋
The Reality: I see a "Fundamental Tank" crushing the industrial space! 🚜💎
Cash conversion is incredibly efficient Q1 2026 consolidated net profit skyrocketed to EGP 793.56M (up massively from EGP 310.70M in Q1 2025) 🚀📈.
Operating cash flow (EGP 705.3M in Q1 alone) tracks accounting profits smoothly, leaving no room for artificial paper accruals or accounting maneuvers 🧼💰.
The Pricing Moat: I observe supreme localized pricing power.
Despite intense domestic input inflation (raw materials, transport logistics), a persistent national infrastructure push gives MCQE a free pass to transfer production cost increases straight to the market, protecting gross lines past the EGP 1B mark in Q1 2026 🧾🛡️.
The Fuel Shield: I recognize an intense reliance on global energy benchmarks (coal & natural gas) ⛓️🔥.
However, MCQE's aggressive plant modernization, alternative fuel usage, and self-operational optimization have built an excellent defensive barrier against global raw-material shocks 🏗️⚡.
Sharia & Index Status: ✅ Confirmed Compliant.
I confirm that MCQE is Sharia compliant and safely passes all quantitative leverage filters and qualitative industrial criteria.
However, due to market float and institutional rebalancing criteria, it remains excluded from the EGX33 Shariah Index 📜❌.
Technical Analysis:
The Channel Pullback Patiently Hunting the Structural Re-Entry 🎢📉
The Coiling Setup: I noticed the stock is cooling off inside a prominent upward channel after reaching its latest All-Time Highs near 201.00 EGP.
Volumes are decreasing and momentum indicators are cooling off perfectly this is a healthy structural reset 📉💨.
The Entry Mapping: * 180.00 EGP: The first structural minor correction target.
Expect local institutional buy walls to start activating here 🩹.
173.00 EGP: The secondary, another good value floor.
Snagging allocations here places your entry right at the base of the long-term uptrend channel 🧱🏹.
Verdict: The Elite Heavy-Industry Buy. 👑🏗️
Exceptional cash velocity and absolute pricing power make this a top-tier asset.
The long-term trend remains heavily protected treat the short-term pullback as a premium gift! 🛡️🔭
If you like my posts, follow and boost! 🙌✨
🎁 Get a $15 discount on my next subscription:
🔗 www.tradingview.com ✨💸
 Long
Long
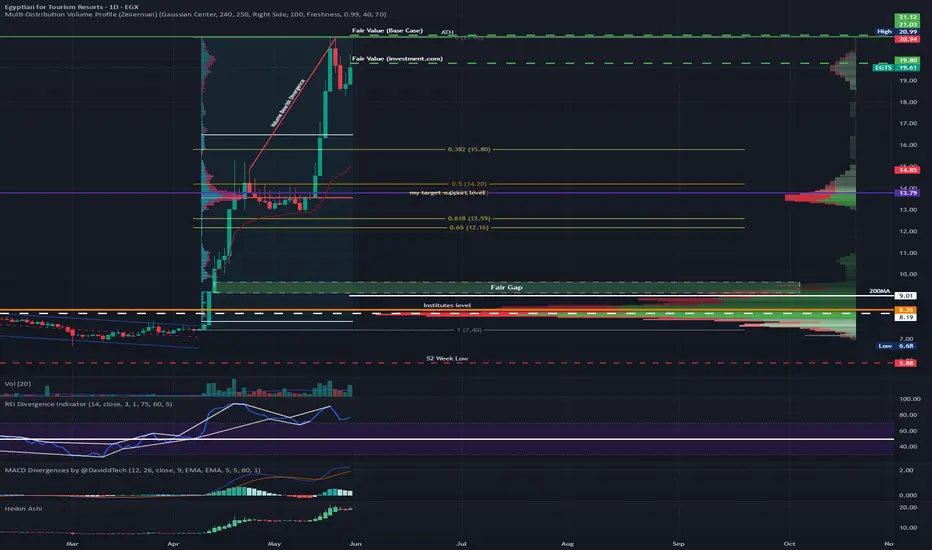
EGTS – Post-Target Pullback Sets Up Next Major Re-Entry EGTS – Post-Target Pullback Sets Up Next Major Re-Entry 📉🏖️
The Reality: I see a "High-Beta Momentum Play" riding high on a true turnaround! 🎢🚀
The shift from massive historical losses to a net profit crossing EGP 1B is fully organic, fueled strictly by genuine land handovers and core resort operations, not balance sheet gymnastics!
But watch out: master layout delays mean paper profits from land sales are outrunning actual Operating Cash Flow (CFO), keeping accruals very high ⏳💸.
The Structural Shield: I observe an incredibly defensive debt profile.
With minimal formal bank debt, EGTS is fully insulated from Egypt’s high interest rates 🛡️🦅! However, the balance sheet carries a high volume of contract liabilities from advanced customer deposits, and long-term buyer installment plans lock up vital liquidity into multi-year receivables ⛓️💰.
The Macro Tailwind: I find the entire Egyptian tourism sector capturing an unprecedented regional wave 🌍✈️!
With alternate travel routes like Dubai and Beirut seeing temporary soft periods, Arab and international travelers are shifting liquidity directly into premium Egyptian hospitality hubs 🏝️🔥.
Sharia & Index Status: ❌ Non-Compliant.
I confirm EGTS is strictly excluded from the EGX33 Shariah Index.
The equity is completely ineligible for dedicated Islamic mandates (such as Azimut, Beltone "Wafra", or CIAM Misr funds) because it fails Tier 1 qualitative filters due to un-purified hospitality segments and sub-developer land usage 📜🚫.
Technical Analysis:
Managing the Correction Wave – Mapping the Support Triggers 🎢📉
The Rejection Sign: I noticed the price accurately tapped your macro adjusted target at 21.00 EGP before immediately pausing to let momentum indicators cool off.
The Downside Maps:
15.80 EGP: The first critical consolidation zone.
If the buyers step in here next week, the stock will build a tight base before attacking the ATH again.
13.80 EGP: The absolute dream entry level.
A deeper correction down to this horizontal floor represents a highly attractive risk-reward area for long-term positioning.
Verdict: I classify EGTS as a "Fundamental Hold / Technical Buy on Pulldowns." 🏗️🏎️
Do not chase the tape while the minor pullback wave is active.
I am setting buy alerts at 15.80 and 13.80 to accumulate this tourism king on red days! 🛡️🔝
Do you think the high contract liabilities will cause further operational delays in the Sahl Hasheesh layout expansion, or will the massive influx of Arab tourism cash accelerate project handovers? 🤔🌊🔍💼
If you like my posts, follow and boost! 🙌✨
🎁 Get a $15 discount on my next subscription:
🔗 www.tradingview.com ✨💸 ADIB growth +241% since 2024Growth: +241% since 2024, compared to the EGX30 index, which rose by only 106%.
One of the strongest and most successful investments that has drawn attention over the past three years on the Egyptian Stock Exchange in general, and the EGX30 index in particular.
Technical Analysis (for long-term investors, not traders)
Recommendation: Hold. Any decline in price is considered a strong buying opportunity, with a stop-loss level at EGP 36.
Financial Analysis (Focus on Q1 2026 Results — Simplified)
Profit Growth: Net profit after tax reached EGP 3.65 billion, up 21% compared to the same period last year (EGP 3.03 billion in Q1 2025).
Key Ratios: ROI: 41% | ROE: 27.10% | Net Profit Margin: 3.91%
Cost Efficiency: Success always comes at a relatively high — or at least stable — cost. However, ADIB Egypt managed to reduce its cost-to-income ratio to just 18.3%.
Drivers of these strong results:
New Customer Growth: The bank attracted 66,000 new customers in Q1 alone.
Digital Transformation & Non-Geographic Expansion: 79% of new customers were acquired through digital channels, and 61% of personal finance transactions were executed digitally.
This demonstrates that the bank's management has a strong understanding of the opportunities and threats posed by digital transformation — and knows how to navigate them effectively, unlike many competitors. ADIB Egypt may well emerge as a powerful new player in the non-banking financial services market, including securities trading and individual/corporate payments.
Was This Success Planned? — Variance Analysis (Actual vs. Planned)
Revenue & Financing: Results exceeded forecasts and budget estimates (positive variance), driven by strong demand for corporate lending to large enterprises and government sectors, which grew by 17%.
Risk Provisions (Planned Negative Variance): Provisions increased by 50% to AED 158 million. This variance was fully aligned with the bank's precautionary plans (Cost of Risk at 48 basis points) to cover any economic fluctuations.
Asset Quality: The Non-Performing Assets (NPA) ratio improved to its lowest historical level of 2.6%, better than what was set in the risk budget.
Bottom Line:
Management didn't just meet its targets — it exceeded its own expectations. But the question remains: Were the budget targets easy to achieve?
Sometimes, management sets easily attainable plans and budgets to show shareholders that they have — in fact — met or even exceeded budget goals.
Performance vs. Peers
Bank ROE Net Profit (EGP)
ADIB Egypt 41% 3.65 billion
Commercial International Bank (CIB) 34% 17.82 billion
Housing & Development Bank (HDB) 30% 5.62 billion
Faisal Islamic Bank 25% 3.09 billion
Market Position — Customer Deposit Growth
Bank Deposit Growth Rate Total Deposits (EGP)
ADIB Egypt 15.50% 320 billion
CIB 6.50% 790 billion
HDB 5.10% 112 billion
Faisal Islamic Bank 4.20% 195.40 billion
Final Verdict
Although ADIB Egypt's absolute net profit (EGP 3.65 billion) is not the highest among peers, its growth rate is the strongest. This is clearly reflected in the rapid and sweeping growth of customer deposits, indicating increasing customer confidence in the bank — and consequently, a growing market share in Egypt.  Short
Short
Commercial International Bank (CIB - COMI) Here is the institutional-grade technical report translated into professional financial English:
🛑 Technical & Structural Evaluation Report: Commercial International Bank (CIB - COMI)
Date: May 2026
Report Type: Urgent Update – Trend Reversal & Distribution Evaluation
Current Status: Active Downside Slippage (In-Progress Free Fall)
I. Executive Summary
The Commercial International Bank (CIB) stock is currently undergoing a Major Institutional Distribution Phase after testing its historical peak near the 144.78 EGP level. Multi-timeframe technical indicators explicitly confirm a complete exhaustion of buying momentum alongside an aggressive expansion in selling pressure (Smart Money Outflow). We strongly recommend exercising extreme caution and temporarily neutralizing long positions, as the stock has entered an active liquidation phase targeting deeper structural supports.
II. Technical & Price Action Anatomy
1. Chart Patterns & Market Structure:
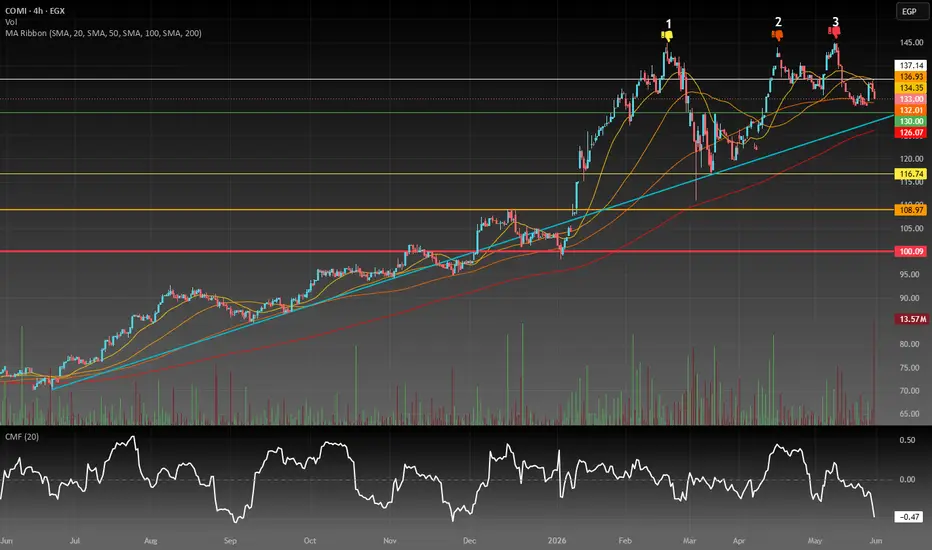
Triple Top Pattern: Multi-frame chart analysis reveals a clear failure by buyers to break above or sustain prices over the key historical resistance zone of on three consecutive attempts. This recurring rejection underscores a major momentum exhaustion, validating the formation of a macro Triple Top distribution pool.
Trendline Break: The price has decisively broken below its primary ascending trendline (the main driver of the recent rally) with zero immediate bullish reaction. This structural shift officially transitions the stock from a consolidation phase into a vertical downward trajectory.
2. Volume Profile & Money Flow:
Chaikin Money Flow (CMF) Deterioration: The CMF indicator displays a severe negative divergence, dropping deeply to (-0.47) on the 4-hour frame and deteriorating further to an extreme (-0.65) on intraday frames (45-minute). This indicates heavy institutional liquidation and aggressive distribution that completely absorbs any localized buying depth.
Price-Volume Relationship: The latest bearish candles are strictly accompanied by significant volume spikes. This volume expansion during a price drop validates the presence of heavy institutional selling rather than retail panic.
3. Moving Average Ribbon Matrix:
The price is currently trading below its short-term exponential and simple moving averages (20 & 50 periods), which have now flipped into static and dynamic resistance zones capping any upside near .
The current downside velocity has pushed the price below the slower 100 and 200-period averages on intraday charts, stripping the stock of its immediate cushion levels.
III. Downside Targets
Based on structural extension measurements and historical liquidity gaps, the downside targets are projected sequentially as follows:
🎯 First Target (130.00 EGP): Represents the closest psychological support level and the 50-day moving average (DMA) low on the daily frame. Given the current selling velocity, this level is highly vulnerable to an immediate break.
🎯 Second Target (117.00 EGP): A critical structural station representing the Major Accumulation Zone established during March and April. Institutional buying interest is expected to re-emerge here, potentially triggering a technical relief bounce.
🎯 Third Target (108.00 EGP): This station marks the initial breakout point of the macro rally and serves as a major structural retest. It also aligns with the mandatory filling of the large price gap created at the beginning of the year.
🛑 Strategic Ultimate Target (95.00 EGP): Should the selling pressure intensify and decisively break the 108.00 EGP floor, the stock will inevitably drift toward its "concrete baseline"—the core accumulation base that sustained the stock throughout 2023.
IV. Recommendation & Operational Strategy
For Day Traders / Short-Term Investors: Implement a strict Capital Preservation strategy. Any temporary intraday relief rallies (Technical Bounces) lacking massive volume confirmation must be treated as a Bull Trap designed to distribute residual blocks. These should be utilized to trim existing positions rather than initiating new buy orders.
For Medium to Long-Term Investors: Refrain entirely from "catching a falling knife." It is highly advised to stand aside and closely monitor the price action at the first major structural cushion around , tracking the volume profile and money flow to ensure a verified institutional re-accumulation process begins before allocating capital.
Disclaimer: This report represents a purely technical and structural assessment of price behavior and capital flow based on available chart data. It does not constitute a direct solicitation or recommendation to buy or sell. The final investment decision and the responsibility for risk management rest entirely with the portfolio manager or individual investor.  Short
Short
EHDR – Sideways Grind Under the 2.30 Supply Wall EHDR – Sideways Grind Under the 2.30 Supply Wall 📉🧱
The Reality: I see a "High-Beta Speculative Vehicle" running entirely on momentum rather than cold hard cash! Just like many minor developers, actual liquidity from historical handovers is non-existent, creating a massive gap between paper accounting revenue and the empty cash drawer.
The Non-Core Trap: I observe a bottom line that is highly vulnerable to financial engineering, subsidiary mergers, and asset revaluations rather than sustainable real estate growth.
Utilizing "percentage-of-completion" tricks means profits are booked instantly, but the actual collection cycle drags out across eternal client installment plans acting as a massive weight on working capital efficiency.
Sharia & Index Status: ✅ Confirmed Compliant.
I confirm that EHDR is fundamentally Sharia compliant.
However, because its daily trading volume and market cap are so small, it remains completely excluded from the EGX33 Shariah Index due to strict institutional liquidity filters.
Technical Analysis:
The Consolidation Phase, awaiting the Outflow of Speculative Volume 🎢📉
The Resistance Battle: I noticed the price has zero strength to pierce the 2.30 EGP horizontal barrier.
A breakout here needs a massive influx of volume; clean air only exists once institutional order books overwhelm the retail sellers.
The Key Levels:
2.30 EGP: The primary trend trigger.
Daily closure above this opens a swift speculative path toward the ATH resistance zones.
2.19 EGP: The immediate short-term support that keeps the coiling structure alive.
Verdict: I classify EHDR as a "Fundamental Pass / Technical Watch Only Above 2.30." 🏗️🏎️
Stand aside and protect your capital.
Let the retail noise churn inside the sideways range, and wait for a definitive breakout print above 2.30 EGP before even considering a short-term momentum entry!
If you like my posts, follow and boost! 🙌✨
🎁 Get a $15 discount on my next subscription:
🔗 www.tradingview.com ✨💸
 Long
Long
 Long
Long