DOMT Technical ViewDOMT Technical View 📊
Short term: sideways consolidation
Mid term: still in an uptrend
Key support / invalidation: 24.8
If price dips below support, 23.8 becomes an interesting level to watch
Breakout trigger: strong volume above 25.9
🎯 Targets: 27 (recent ATH) and 28 if momentum continues
ISMQ Price is expected to react around the Fibonacci golden ratiISMQ 📈
Price is expected to react around the Fibonacci golden ratio.
🔻 If it breaks down, the next major resistance is at 6.3.
🔼 If price reacts upward, wait for a daily close above 7 for confirmation.
🎯 Targets:
• Target 1: ~8% → major order block
• Target 2: ~15% → fair value
• Target 3: ~30% → Fib 100% extension
CERA Price is trading at a major resistanceCERA 📊
Price is trading at a major resistance and has failed to break the white moving resistance since May 25. It’s also reacting around the Fibonacci golden ratio.
🔍 If price turns bullish:
• Wait for a confirmed break above 1.26 (major resistance) before buying
🎯 A confirmed breakout could lead to a ~10% move toward the major order block and all-time high, following this strong downward move.
Ferchem Misr is currently trading near a major resistance zone.Ferchem Misr 📈
Price is sitting at a major resistance zone. A breakout could open the way toward 67.5.
The current candle structure suggests a possible liquidity sweep before break of structure .
🔍 Plan:
• Wait for a break above the moving (white) resistance
• Strong confirmation = daily close above 81 (major volume resistance)
✅ If confirmed, upside potential of ~25% toward the next major order block.
EASB – BUY Recommendation | Target 6.10Recommendation: BUY based on accumulation after a strong downtrend and improving price stability.
Stop-loss: below the accumulation range low / last swing low (daily close).
Take-profit: partial at nearest resistance, final target 6.10.
High risk / high volatility. Trade with proper position sizing.
This is my market opinion, not guaranteed results.
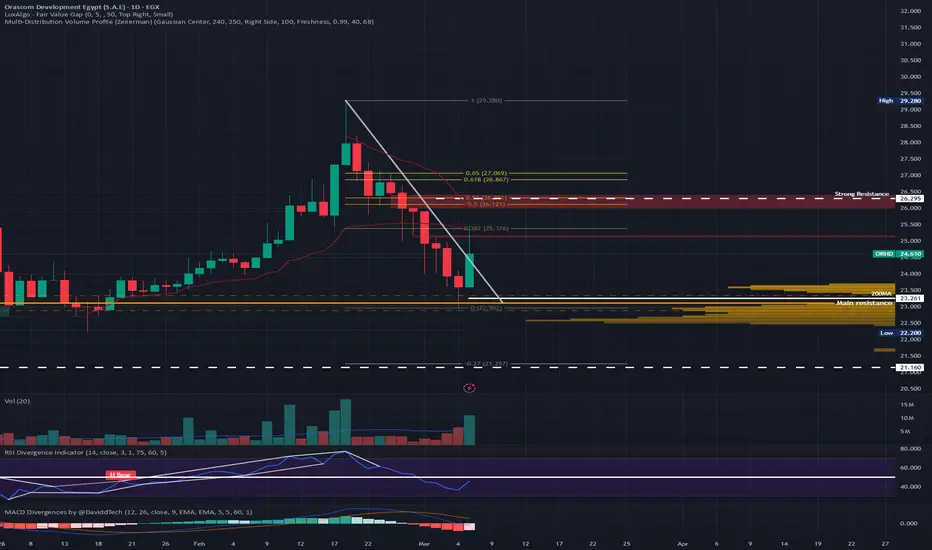
Long ORHDThis is a very good long to consider.
Looks like the up trend is very solid so far, so i think there might be another push to the upside.
In details, what i think it might happen is that we get a wick inside the blue box, then up from there.
But dont set limit orders, just confirm on lower timeframes, as whales could very well whales push the price further down to manipulate the market.
ISMQ is testing resistance level - Waiting for breakout !Weekly chart, the stock EGX:ISMQ is drawing an ascending channel, and is trying to break the resistance line R.
Above 7.60 for 2 weeks, the target will be 10.1 - 10.3
Near stop loss is 7.00
Below 7.00, the support will be line S (then, a price action around 6.60 - 6.50)
So, a new entry should be above R breakout (closing above 7.60 for 2 weeks), or after a price action at 6.50 - 6.60 and rebound.
ATQA LongThis is a good long trade, based on all the techicals. This trendline held since 2023, for three years straight. so it would be odd to break now. What worries me is the liquidity sitting below 9.1.
So we take the first entry, and if it fails, then we wait for the sweep and makes another entry.
Also if you can confirm on lower timeframes, then it would offer very good RR.
EMFD hit a very precise target after the flag breakoutEMFD hit a very precise target after the flag breakout, then pulled back and attempted twice to break the moving resistance parallel to the flag target. Price is now pulling back again. There are two possible buying scenarios:
Wait for price to reach the strong orange resistance and buy on a confirmed breakout, or
Wait for the pullback to finish and buy on a breakout above the moving resistance, which would be a strong bullish indicator.
The choice is yours.
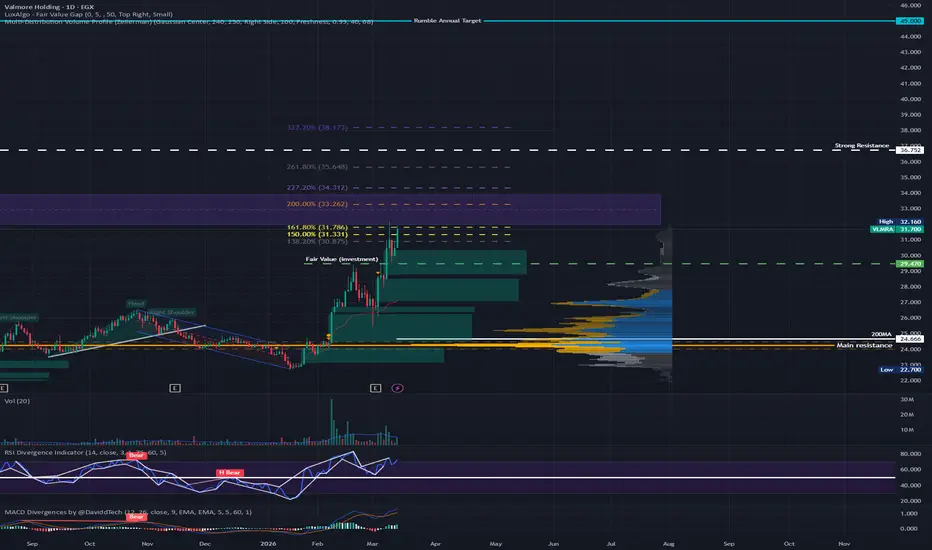
VLMRA has broken the Head and Shoulders harmonic pattern VLMRA has broken the Head and Shoulders harmonic pattern and pulled back from the 50% target. At this point, there are two possible scenarios: either price continues toward the 100% target (especially since the pullback volume is not high), or it breaks the structure and moves beyond the moving resistance. I will only consider buying if price breaks above the green 0.27 Fibonacci channel target, not the white moving resistance.
RREI broke important resistance RREI (ELICO) – Summary:
• Trend: Bullish
• Current price: Around 3.00
• Key support: 2.80, then 2.12
• Targets: 3.16 – 3.36 – 3.64
• Break above 3.64: Opens the way for higher levels
• Break below 2.80: Weakens the setup
Stock remains positive as long as it holds above 2.80. ✅