Long
Long
 Long
Long
 Long
Long
MEPA: Low Liquidity Makes This Breakout Setup Unconvincing 📊 MEPA: Low Liquidity Makes This Breakout Setup Unconvincing ⚠️
🏛️ Fundamental Review:
📊 Business Quality:
MEPA is a niche manufacturer of medical packaging products serving Egypt's pharmaceutical and healthcare industries. 🏥
✅ Strengths & Catalysts:
The company benefits from the long-term growth of Egypt's healthcare manufacturing sector while maintaining a healthy balance sheet with very low debt. 💪
Its micro-cap nature also makes it capable of delivering sharp momentum moves when liquidity enters the stock. 🚀
⚠️ Risks:
Profit margins continue to contract, the business operates on a relatively small scale, and the stock trades at an extremely rich valuation, leaving little room for disappointment. ⚠️
💰 Valuation:
Despite solid financial health, the current valuation appears stretched, making MEPA more suitable as a speculative trading stock than a long-term investment. 💎
🔍 The Pulse:
If you're thinking about entering now, I would wait. ⏳
The stock is currently trapped between the major support at 1.69 EGP and the 200-day Moving Average at 1.62 EGP. 📊
I want to see a confirmed triangle breakout followed by a close above the major resistance at 1.86 EGP before turning bullish. ✅
The biggest concern remains liquidity, which is far too weak to support a sustainable breakout. 💰
For me, a genuine breakout should be accompanied by at least EGP 100 million in daily trading value. 📈
Anything less is likely to result in a false breakout that quickly fails. ⚠️
🧱 The Key Structural Boundaries
🚀 Breakout Trigger, 1.86 EGP.
A confirmed close above this resistance validates the bullish breakout.
🎯 First Target, 2.00 EGP.
A retest of the 52-week high.
🎯 Second Target, 2.30 EGP.
My estimated fair value.
🎯 Final Target, 2.88 EGP.
A retest of the all-time high.
⚠️ First Warning, Low Liquidity.
A breakout without at least EGP 100 million in trading value lacks conviction.
🛑 Stop Loss, 1.62 EGP.
A confirmed close below the 200-day Moving Average for two consecutive sessions invalidates the setup.
🎯 The Verdict:
MEPA remains a speculative trading candidate rather than a high-quality investment. ⚠️
The technical structure still requires confirmation before new positions become attractive. 📊
Wait for both a confirmed breakout above 1.86 EGP and strong liquidity before considering an entry. 🤝
Without institutional participation, any breakout should be treated with caution. 🛡️
---
If you like my insights, follow and boost! 🙌💙🚀
🎁 $15 TradingView Discount:
🔗 www.tradingview.com ✨💸🤑
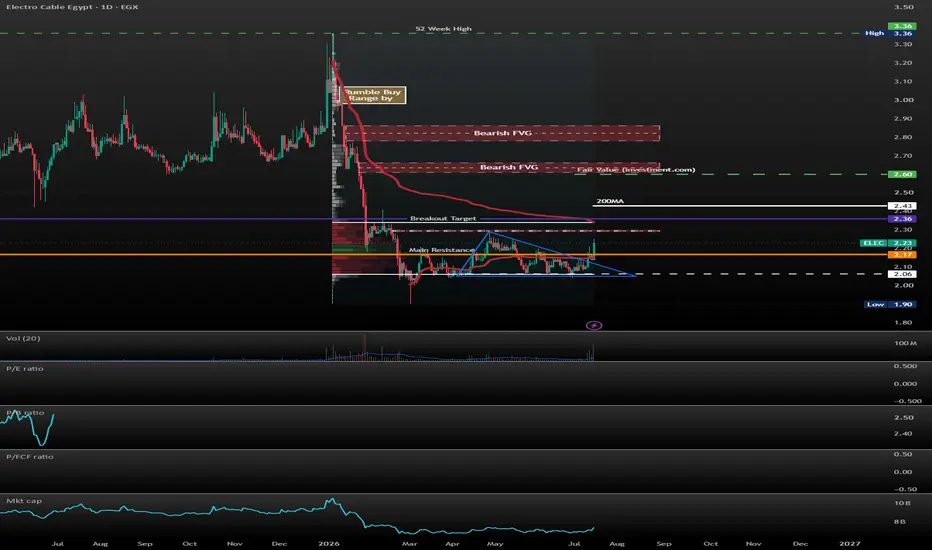
ELEC: Don't Mistake the Bounce for a Trend Reversal 📊 ELEC: Don't Mistake the Bounce for a Trend Reversal ⚠️
🏛️ Fundamental Review:
📊 Business Quality:
ELEC is one of Egypt's largest cable manufacturers, supplying power, telecommunications, and infrastructure projects across Egypt and export markets. ⚡
✅ Strengths & Catalysts:
The company remains strategically important to Egypt's infrastructure sector and continues to secure major government projects. 🏗️
Its large industrial asset base and discounted valuation could support a recovery once earnings stabilize. 💎
⚠️ Risks:
Q1 2026 results deteriorated sharply, with the company reporting a significant loss while high debt, weak cash generation, and institutional selling continue to pressure sentiment. 📉
💰 Valuation:
Although the stock appears inexpensive on an asset basis, improving fundamentals are still needed before it deserves a higher valuation. ⚖️
🔍 The Pulse:
If you think the stock has already turned bullish, I believe that conclusion is premature. 🚫
The recent triangle breakout projects only toward the strong resistance around 2.36 EGP, which still sits below the 200-day Moving Average. 📐
I do not recommend buying stocks that continue trading below their 200-day Moving Average. 📊
The first real bullish confirmation will be a close above the 200-day Moving Average at 2.43 EGP. ✅
The main support at 2.17 EGP remains critical, and I expect the market to retest this level before any sustainable advance. 🛡️
The stock also requires much stronger institutional buying before the trend can genuinely change. 💰
Institutional investors have withdrawn more than EGP 2.5 billion, while recent inflows of only EGP 200–300 million are not sufficient evidence of a true reversal. ⚠️
🧱 The Key Structural Boundaries
🚀 Breakout Trigger, 2.43 EGP.
A confirmed close above the 200-day Moving Average signals the first real bullish shift.
🎯 First Target, 2.60 EGP.
My estimated fair value.
🎯 Second Target, 2.80 EGP.
The bearish Fair Value Gap.
🎯 Final Target, 3.36 EGP.
A retest of the 52-week high.
⚠️ First Warning, 2.36 EGP.
The triangle breakout reaches strong resistance here, making rejection likely.
🚨 Second Warning, 2.17 EGP.
A break below the main support significantly weakens the structure.
🛑 Stop Loss, 2.17 EGP.
A close below the main support invalidates the current setup.
🎯 The Verdict:
ELEC remains a watchlist stock rather than a buying opportunity at current levels. 👀
The recent move looks more like a technical bounce than the start of a new uptrend. 📉
Wait for a confirmed close above the 200-day Moving Average together with stronger institutional participation before considering new positions. 🤝
Until then, capital preservation should take priority over chasing early breakouts. 🛡️
---
If you like my insights, follow and boost! 🙌💙🚀
🎁 $15 TradingView Discount:
🔗 www.tradingview.com ✨💸🤑
 Short
Short
EPCO: Technical Setup Looks Promising, But Fundamentals are Weak📊 EPCO: Technical Setup Looks Promising, But Fundamentals Remain Weak ⚠️
Fundamental Review:
EPCO is a speculative micro-cap poultry producer operating in Egypt's defensive food sector, but its financial quality remains weak. 🐔
The company continues to report operating losses despite owning valuable agricultural assets and processing facilities. 📉
Rising feed, energy, and imported input costs continue to pressure margins and profitability. ⚠️
Although the sector benefits from steady domestic demand, the stock lacks the financial strength required for a long-term investment. 🚫
The Pulse
EPCO remains a weak fundamental stock, but it has historically respected technical levels remarkably well. 📊
If you want to understand this behavior, check my previous analysis published on May 11. 📚
I have now updated the technical structure to reflect the latest price action. 🔄
The stock became technically stretched after today's rally, with most momentum indicators reaching overbought conditions. 📈
My base case is a pullback toward the strong resistance-turned-support around 10.00. 🎯
The more likely correction target is the major support level at 9.41. 🛡️
If selling pressure accelerates, the final support sits at 8.55, where I expect a strong bullish reaction. 💪
After the correction, a confirmed close above 10.54 would signal the continuation of the uptrend. 🚀
🧱 The Key Structural Boundaries
Breakout Trigger: A confirmed close above 10.54 activates the bullish continuation. 📈
First Target: The 52-week high at 12.25. 🎯
Second Target: The triangle breakout objective at 13.72. 📐
Final Target: My estimated fair value around 15.30. 💰
The Verdict
The technical setup remains attractive despite the company's weak fundamentals. ⚠️
Keep position sizes small, as the financial picture does not justify a large allocation. 💼
A break below the major support at 8.55 should be treated as the stop-loss. 🛑
Patient traders should wait for the breakout above 10.54 before considering new positions. ✅
If you like my insights, follow and boost! 🙌💙🚀
🎁 $15 TradingView Discount: www.tradingview.com ✨💸🤑
 Long
Long
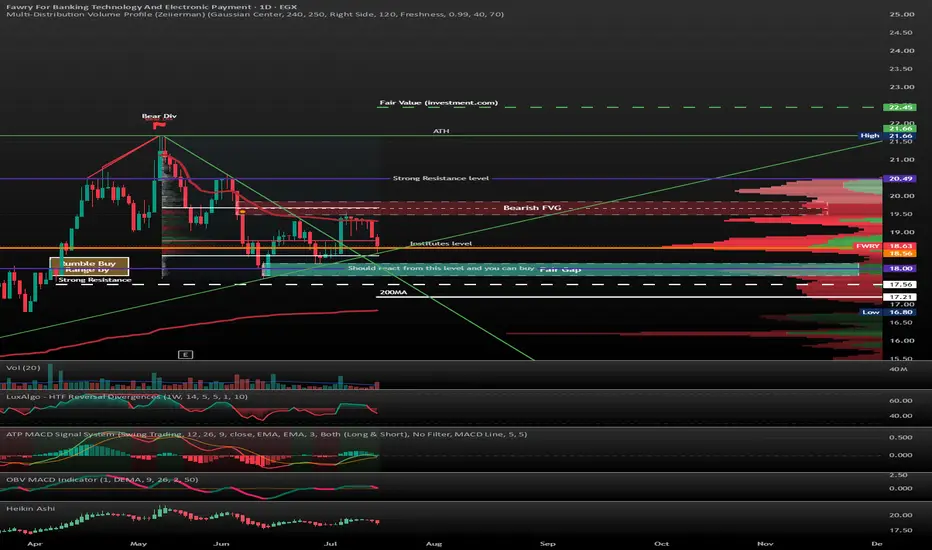
FWRY: Pullback Into Support Could Set Up the Next Bullish Wave 📊 FWRY: Pullback Into Support Could Set Up the Next Bullish Wave 🚀
🏛️ Fundamental Review:
📊 Business Quality:
FWRY is Egypt's leading fintech and digital payments company, with a dominant position across electronic payments, merchant services, consumer finance, and digital banking. 🏦
✅ Strengths & Catalysts:
The company continues to deliver outstanding growth, with Q1 2026 revenue rising 34% and net profit increasing nearly 24% year-over-year. 📈
Its rapidly expanding financial services business, strong loan growth, and industry-leading margins reinforce its long-term competitive advantage. 🚀
⚠️ Risks:
The stock trades at a premium valuation and faces increasing competition from banks, fintech startups, and telecom payment platforms, requiring continuous investment to maintain its leadership. ⚠️
💰 Valuation:
Despite its premium multiple, FWRY remains one of the highest-quality long-term growth companies on the EGX thanks to its powerful structural growth story. 💎
🔍 The Pulse:
After touching a major bearish Fair Value Gap, the stock entered a healthy pullback. 📉
Although several technical indicators have turned negative and today's session showed strong selling pressure, I still consider the overall trend bullish. 💪
The price reacted from the major support level at 18.56 EGP while also respecting a long-term rising trend line. 📈
I expect a new bullish wave to begin either tomorrow or sometime next week. 🚀
A pullback toward the Fair Value Gap around 18.00 EGP would offer an attractive entry opportunity if buyers step in. 📍
The first warning signal would be a close below the long-term trend line or below the 18.56 EGP support. ⚠️
The second bearish confirmation would be a break below the strong support at 17.56 EGP. 🚨
A confirmed close above 19.60 EGP would signal the beginning of a new bullish leg. ✅
🧱 The Key Structural Boundaries
📍 Entry Zone, 18.00 EGP.
A retest of the Fair Value Gap could provide an attractive buying opportunity.
🚀 Breakout Trigger, 19.60 EGP.
A confirmed close above this level signals the start of a new bullish wave.
🎯 First Target, 20.50 EGP.
The next major resistance level.
🎯 Second Target, 21.66 EGP.
A retest of the all-time high.
🎯 Final Target, 22.45 EGP.
My estimated fair value.
⚠️ First Warning, 18.56 EGP.
A close below the trend line or this support weakens the bullish structure.
🚨 Second Warning, 17.56 EGP.
Breaking this strong support significantly increases downside risk.
🛑 Stop Loss, 17.21 EGP.
A close below the 200-day Moving Average invalidates the bullish setup.
🎯 The Verdict:
FWRY remains one of the strongest long-term growth stories on the EGX. 🏆
The current pullback appears healthy despite short-term selling pressure. 📉
A confirmed move above 19.60 EGP would provide the strongest technical entry signal, while any controlled pullback toward 18.00 EGP may offer an attractive accumulation opportunity. 🤝
Risk remains well defined with a stop below the 200-day Moving Average. 🛡️
---
If you like my insights, follow and boost! 🙌💙🚀
🎁 $15 TradingView Discount:
🔗 www.tradingview.com ✨💸🤑
 Long
Long
EXPA: BB Squeeze Breakout Signals a New Bullish Phase 📊 EXPA: BB Squeeze Breakout Signals a New Bullish Phase 🚀
🏛️ Fundamental Review:
📊 Business Quality:
EXPA (Export Development Bank of Egypt) is one of Egypt's strongest commercial banks, specializing in trade finance and export-focused banking services. 🏦
✅ Strengths & Catalysts:
The bank delivered exceptional Q1 2026 results, with net profit surging 111% year-over-year while maintaining outstanding profitability, strong capital efficiency, and direct exposure to Egypt's expanding export sector. 📈
Its state-backed ownership structure and institutional sponsorship make EXPA one of the highest-quality financial stocks on the EGX. 🏆
⚠️ Risks:
Future earnings remain sensitive to interest rate changes, while recent capital increases have modestly diluted per-share metrics. ⚠️
🕌 Shariah Status:
EXPA is not Shariah-compliant because its core business is conventional commercial banking that generates and earns interest-based income. ❌
💰 Valuation:
The fundamentals remain among the strongest in the banking sector, supporting a favorable long-term investment outlook. 💎
🔍 The Pulse:
After reaching its all-time high, EXPA entered a healthy consolidation channel. 📊
Today's breakout from that consolidation followed a Bollinger Band squeeze, one of the strongest technical continuation signals. 🚀
A close above 19.42 EGP tomorrow would provide an attractive breakout entry. ✅
Alternatively, a successful retest of the 19.00 EGP level that holds as support would also offer a favorable buying opportunity. 📍
The first upside target is a retest of the all-time high at 21.18 EGP. 🎯
The medium-term objective is my estimated fair value around 24.10 EGP. 📈
The long-term target stands at 26.13 EGP. 🚀
🧱 The Key Structural Boundaries
🚀 Breakout Trigger, 19.42 EGP.
A confirmed close above this level strengthens the bullish continuation.
📍 Alternative Entry, 19.00 EGP.
A successful retest and rebound from this support offers another buying opportunity.
🎯 First Target, 21.18 EGP.
A retest of the all-time high.
🎯 Second Target, 24.10 EGP.
My estimated fair value.
🎯 Final Target, 26.13 EGP.
The long-term upside objective.
🛑 Stop Loss, 18.63 EGP.
A close below this level invalidates the bullish setup.
🎯 The Verdict:
EXPA combines elite fundamentals with one of the strongest technical setups in the banking sector. 🏆
The Bollinger Band squeeze breakout significantly improves the probability of trend continuation. 📈
A confirmed move above 19.42 EGP or a successful retest of 19.00 EGP both offer attractive entry opportunities. 🤝
Risk remains clearly defined with a stop below 18.63 EGP. 🛡️
---
If you like my insights, follow and boost! 🙌💙🚀
🎁 $15 TradingView Discount:
🔗 www.tradingview.com ✨💸🤑
 Long
Long
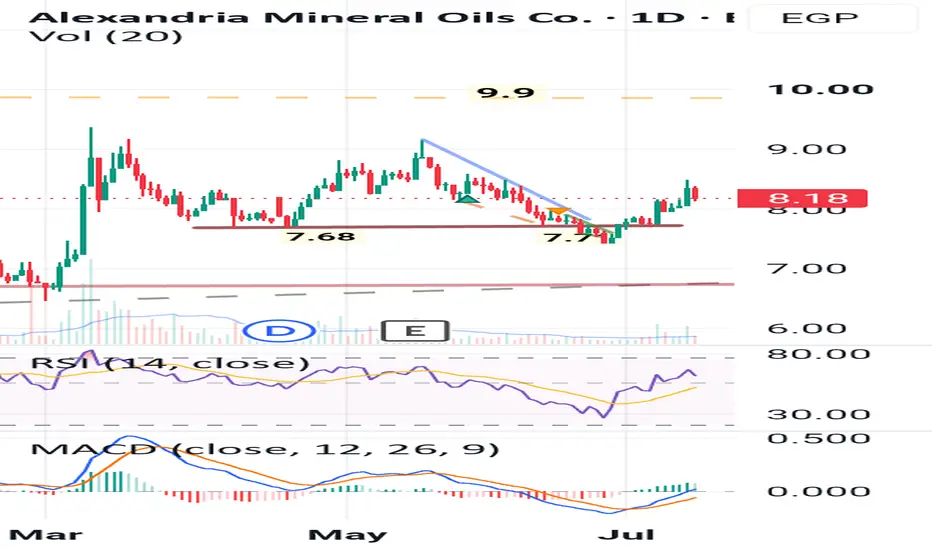
AMOC - EGX: Overview update
1. Price Action & Structural Support
The Double Bottom / Key Support Test: The stock has established a strong horizontal support zone around 7.68 – 7.70 EGP. It tested this area in late April/early May and successfully retested it in late June, creating a solid base.
Trendline Breakout: The blue descending trendline, which governed the correction from the May peak (~9.10 EGP), has been clearly broken to the upside.
Current Position : The stock is currently trading at 8.18 EGP, successfully holding above the minor psychological level of 8.00 EGP after clearing the trendline.
2. Momentum Indicators
RSI (14) : The Relative Strength Index dropped close to the oversold boundary (30) during the late June dip and has since recovered strongly, currently pointing upward around the 50-60 mid-range. This indicates that buying momentum is returning without the stock being overbought yet.
MACD (12, 26, 9): There is a clear bullish crossover below the zero line that occurred in late June. The MACD line (blue) has crossed above the signal line (orange), and the histogram has turned positive (green bars expanding upward), confirming a shift from a bearish to a bullish regime.
Technical Outlook
The chart shows a classic reversal setup. The successful defense of the 7.68-7.70 support zone, combined with a descending trendline breakout and confirming bullish momentum on both the RSI and MACD, favors the upside.
As long as the price sustains daily closes above the 8.00 EGP area, the immediate path of least resistance is toward the 8.60-8.70 region, with an extension potential back toward the 9.10 swing high.
Level Type Price (EGP) Significance
Immediate Support 8.00 Psychological level and recent breakout retest zone.
Major Support (Stop Loss) 7.68 – 7.70 Crucial structural floor; a daily close below this invalidates the bullish setup.
First Target / Resistance 8.50 – 8.70 Intermediate peak zone from late May.
Major Target 9.10 The May swing high.
Ultimate Target 9.90 The long-term resistance level marked on your chart.
 Long
Long
 Long
Long
MFPC: Great Fundamentals, Waiting for Technical Confirmation 📊 MFPC: Great Fundamentals, Waiting for Technical Confirmation ⏳
🏛️ Fundamental Review:
📊 Business Quality:
MFPC (MOPCO) is one of Egypt's highest-quality fertilizer producers and a premier export-driven industrial company, generating more than 80% of its revenue in hard currency. 🌍
✅ Strengths & Catalysts:
The company delivered outstanding Q1 2026 results, with net profit surging 88% year-over-year while maintaining exceptional profitability, a virtually debt-free balance sheet, and industry-leading cash generation. 📈
Continuous investments in production efficiency and carbon recovery projects further strengthen its long-term competitive advantage. 🚀
⚠️ Risks:
Earnings remain tied to global fertilizer prices and domestic natural gas availability, making profitability sensitive to commodity cycles and government energy policies. ⚠️
💰 Valuation:
MFPC remains fundamentally attractive and one of the strongest long-term holdings on the EGX, but the chart has not yet confirmed a new bullish trend. 💎
🔍 The Pulse:
MFPC is another high-quality stock waiting for the right technical entry signal. ⏳
Although the valuation looks attractive, the technical structure has not yet turned bullish. 📉
I prefer waiting for a confirmed breakout and close above 41.52 EGP before entering. ✅
That confirmation would significantly improve the probability of a sustained upward move. 🚀
The first upside target stands at 44.22 EGP. 🎯
The second target is a retest of the all-time high around 48.00 EGP. 📈
The long-term objective remains Faisal's annual target around 52.90 EGP. 🚀
🧱 The Key Structural Boundaries
🚀 Breakout Trigger, 41.52 EGP.
A confirmed close above this level signals a new bullish trend.
🎯 First Target, 44.22 EGP.
The initial upside objective after the breakout.
🎯 Second Target, 48.00 EGP.
A retest of the all-time high.
🎯 Final Target, 52.90 EGP.
Faisal's annual target and the long-term objective.
🛑 Stop Loss, 37.20 EGP.
A close below this level invalidates the bullish setup.
🎯 The Verdict:
MFPC combines elite fundamentals with attractive long-term valuation. 🏆
The only missing piece is technical confirmation. ⏳
Wait for a confirmed breakout above 41.52 EGP before building a position. 🤝
Once confirmed, the stock offers an attractive risk-to-reward profile toward progressively higher targets. 📈
---
If you like my insights, follow and boost! 🙌💙🚀
🎁 $15 TradingView Discount:
🔗 www.tradingview.com ✨💸🤑
ABUK: The First Bullish Signal Has Finally Arrived 📊 ABUK: The First Bullish Signal Has Finally Arrived 🚀
🏛️ Fundamental Review:
📊 Business Quality:
ABUK is Egypt's dominant nitrogen fertilizer producer and one of the highest-quality industrial companies on the EGX, with a strong export-driven business model. 🌍
✅ Strengths & Catalysts:
Q1 2026 net profit more than doubled year-over-year, supported by stable natural gas supplies, higher production, and expanding export volumes that generate substantial hard currency revenues. 📈
The company combines exceptional financial strength, strong institutional ownership, and a durable competitive position within the fertilizer sector. 🏆
⚠️ Risks:
Profitability remains sensitive to global fertilizer prices and government gas pricing policies, while the stock still trades at a premium valuation compared with some regional peers. ⚠️
💰 Valuation:
Despite its premium multiple, ABUK remains one of the highest-quality long-term investments on the EGX thanks to its strong cash generation and defensive fundamentals. 💎
🔍 The Pulse:
ABUK remains one of the strongest stocks on the Egyptian Exchange. 💪
I have been waiting for weeks for the first technical confirmation before considering a new investment. ⏳
Today's price action delivered that first bullish signal. ✅
Aggressive investors can consider entering from yesterday's close around 73.31 EGP. 📍
Conservative investors should wait for a confirmed close above 75.77 EGP for additional confirmation. 🚀
Both strategies use the same technical stop-loss below the 200-day Moving Average at 63.45 EGP. 🛡️
🧱 The Key Structural Boundaries
🚀 Early Entry, 73.31 EGP.
The first bullish signal has already appeared for investors willing to enter early.
✅ Confirmation Trigger, 75.77 EGP.
A close above this level confirms the continuation of the bullish trend.
🛑 Stop Loss, 63.45 EGP.
A break below the 200-day Moving Average invalidates the bullish setup.
🎯 The Verdict:
ABUK continues to rank among the highest-quality companies on the EGX. 🏆
Both the fundamentals and the technical structure are aligning in favor of higher prices. 📈
Early entries are now reasonable, while conservative investors may prefer waiting for confirmation above 75.77 EGP. 🤝
Risk remains well defined with a stop below the 200-day Moving Average. 🛡️
---
If you like my insights, follow and boost! 🙌💙🚀
🎁 $15 TradingView Discount:
🔗 www.tradingview.com ✨💸🤑
 Long
Long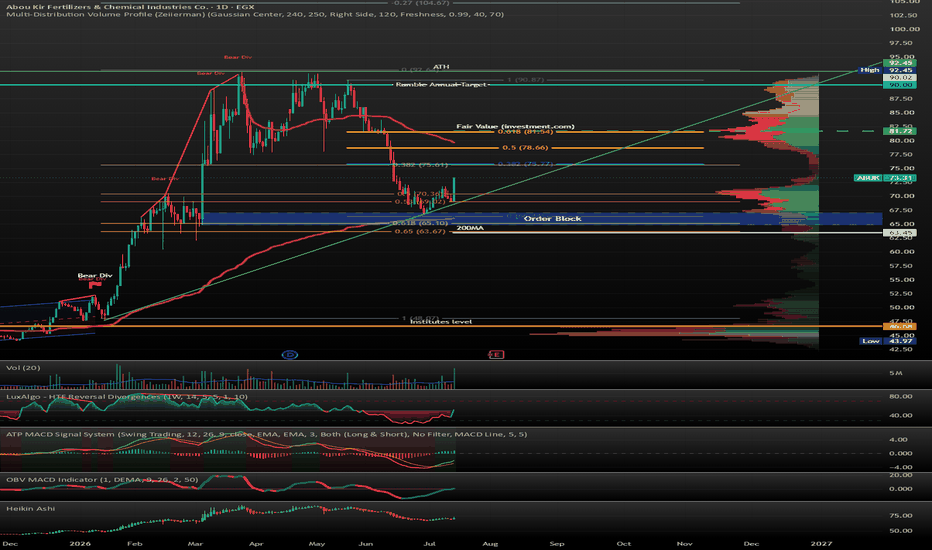
ICFC: Wait for the Triangle Breakout Before Entering 📊 ICFC: Wait for the Triangle Breakout Before Entering ⏳
🏛️ Fundamental Review:
📊 Business Quality:
ICFC is one of Egypt's leading agricultural distributors, benefiting from a diversified portfolio across fertilizers, pesticides, seeds, and grains. 🌱
✅ Strengths & Catalysts:
The company continues to deliver strong earnings growth, with Q1 2026 net profit rising nearly 34% year-over-year, supported by robust operations and increasing contributions from affiliated companies. 📈
Strategic expansion into agricultural seeds and a proposed acquisition further strengthen its long-term growth outlook. 🚀
⚠️ Risks:
Trading liquidity remains relatively limited, while profitability is still exposed to raw material costs, currency fluctuations, and supply chain disruptions. ⚠️
💰 Valuation:
ICFC remains attractively valued with healthy financials, making it one of the stronger agricultural names on the EGX, but technical confirmation is still required before committing new capital. 💎
🔍 The Pulse:
Technically, the stock has just reclaimed the 200-day Moving Average, which is an encouraging first step. 📈
However, the price is still trading inside a large triangle consolidation pattern. 📐
This is not an ideal entry point, as the breakout has not yet been confirmed. ⏳
My preferred strategy is to wait for a confirmed close above 15.83 EGP before entering the trade. ✅
A successful breakout would open the path toward the first target at 17.00 EGP. 🎯
The second upside target stands around 19.50 EGP if bullish momentum continues. 🚀
🧱 The Key Structural Boundaries
🚀 Breakout Trigger, 15.83 EGP.
Wait for a confirmed close above this level before entering.
🎯 First Target, 17.00 EGP.
The initial objective following the breakout.
🎯 Second Target, 19.50 EGP.
The next major upside target if momentum remains strong.
🛑 Stop Loss, 15.20 EGP.
A close below this level invalidates the bullish setup.
🎯 The Verdict:
ICFC combines strong fundamentals with an attractive long-term outlook. 📈
Despite the improving technical picture, the current setup does not yet justify a new position. ⏳
Patience offers the higher-probability trade. 🤝
Wait for the triangle breakout above 15.83 EGP before considering an entry. ✅
---
If you like my insights, follow and boost! 🙌💙🚀
🎁 $15 TradingView Discount:
🔗 www.tradingview.com ✨💸🤑
LUTS, EGX : Macro Analysis / Weekly TimeframeStructural Breakdown & Price Action
Macro Trend Reversal : The weekly chart highlights a massive multi-year base-building process that has recently transitioned into an aggressive bullish breakout.
Key Breaches : The price decisively broke above the macro descending trendline (solid blue line) anchored from the 0.820 EGP peak down through the 0.685 EGP lower high.
Support Validation : Following a massive volume-backed surge out of the accumulation structure, the stock has established a crucial structural support floor at 0.710 EGP. The current weekly candle is holding firmly at 0.736 EGP, validating this zone as a strong "polarity flip" (previous resistance turned major support).
Long-Term Trend Alignment : The long-term ascending trendline (dashed grey line) remains entirely intact below, acting as the ultimate structural anchor for the multi-year macro uptrend.
Indicators & Momentum
Volume Profile : The initial thrust out of the base was driven by massive buying volume (well above the 20-period volume moving average), confirming institutional accumulation. Current consolidation volume is thinning out healthily.
RSI (14): Currently sitting at 74.05. While it is technically in the overbought zone, the RSI has successfully broken out of its long-term ceiling, a characteristic signature of a stock entering a powerful macro extension phase.
MACD : The MACD lines have crossed strongly above the zero line with an expanding positive histogram, indicating that macro-scale bullish momentum is just hitting its stride.
Key Technical Levels to Watch
Critical Support Zone: 0.710 – 0.730 EGP. The daily/weekly structural floor and the ascending trendlines form a hard floor here. Any corrective dip into this pocket represents a high-probability loading zone.
Breakout Trigger Line : 0.750 – 0.755 EGP. A decisive 30-minute to 1D candle close above the descending blue trendline on the intraday chart will confirm the pennant breakout.
Upside Targets : Once 0.755 EGP clears, momentum should rapidly test the recent high of 0.780 – 0.788 EGP. Overcoming that opens the doors to macro price discovery, targeting psychological zones at 0.820 EGP and 0.880+ EGP.
Tactical Verdict
The charts present a textbook example of a structural bull market taking a healthy breather. The massive weekly volume breakout validates the macro trend, while the daily and 30-minute charts reveal a volatility squeeze nearing its final apex. The bias remains heavily skewed to the upside as long as the 0.710 EGP structural support remains unbreached on a weekly closing basis.  Long
Long
LUTS, EGX : Swing Analysis / Daily TimeframeEGX:LUTS 1-Day Chart
Structural Breakdown & Price Action
The Continuation Pattern: Following a sharp vertical rally in June that peaked near 0.780 EGP, the daily chart shows a highly organized, classic Symmetrical Triangle / Pennant consolidation pattern.
Pattern Boundaries:
Upper Boundary: Marked by a descending orange dashed trendline connecting the recent short-term lower highs.
Lower Boundary: Marked by a solid red ascending support line catching the recent higher lows.
Current Status: The price closed at 0.736 EGP (-1.08% on the day), compressing tightly right into the apex of this pennant. The immediate lower edge of the pennant heavily clusters with the structural 0.710 EGP horizontal level, making it a high-confluence support zone.
Indicators & Momentum
Volume Profile : Volume is steadily drying up (44.71M vs the 20MA at 67.26M) as the price compresses into the apex. This classic volume decay perfectly matches a reliable pennant formation, signaling an explosive breakout move is imminent.
RSI (14): Sitting at a perfectly neutral 57.58. It has successfully cooled down from overbought territory via time consolidation rather than a deep price correction—a highly bullish sign.
MACD : The lines are undergoing a mild, healthy convergence in positive territory. The histogram is printing small red bars, reflecting the temporary pause in the trend before the next major direction is chosen.
Key Technical Levels to Watch
Critical Support Zone: 0.710 – 0.730 EGP. The daily/weekly structural floor and the ascending trendlines form a hard floor here. Any corrective dip into this pocket represents a high-probability loading zone.
Breakout Trigger Line: 0.750 – 0.755 EGP. A decisive 30-minute to 1D candle close above the descending blue trendline on the intraday chart will confirm the pennant breakout.
Upside Targets: Once 0.755 EGP clears, momentum should rapidly test the recent high of 0.780 – 0.788 EGP. Overcoming that opens the doors to macro price discovery, targeting psychological zones at 0.820 EGP and 0.880+ EGP.
KZPC: Weak Fundamentals Keep This Stock Off the Watchlist📈 KZPC: Weak Fundamentals Keep This Stock Off the Watchlist
The Fundamentals 🌱
Kafr El Zayat Pesticides remains an important player in Egypt's agricultural chemicals industry, but its financial performance has deteriorated significantly. 📉
Sharp earnings declines, shrinking margins, and rising raw material costs continue to pressure the business. Despite its attractive valuation, the current fundamentals do not justify a new investment. ⚠️
☪️ Sharia Compliance
❌Not Sharia-Compliant.
KZPC/KZPH does not currently qualify for the EGX33 Shariah Index due to its financial ratios exceeding the permissible Sharia screening thresholds.
The Pulse ⚡
The technical picture remains weak. The stock is trading below its 200-day moving average, confirming that the long-term trend is still bearish. 📉
At the current stage, there is no technical or fundamental reason to consider a new position. A meaningful change in outlook would require a strong volume breakout above the major resistance level. Until then, the stock should remain on the sidelines. ⏳
🧱 The Key Structural Boundaries
🚀 Breakout Trigger, 8.81 EGP.
A strong daily close above this level with high trading volume is the minimum requirement before considering a new entry.
⛔ Stop-Loss, Current Levels.
For existing shareholders, the stock has already reached the technical stop-loss zone, making capital preservation the priority.
The Verdict 🎯
KZPC currently fails both the fundamental and technical investment tests. ⚠️
With weak earnings, a bearish long-term trend, and no confirmed buying momentum, there is no investment case at the moment. The preferred strategy is to stay out until a high-volume breakout above 8.81 EGP confirms a meaningful trend reversal. 💰
If you like my insights, follow and boost! 🙌💙🚀 🎁 $15 TradingView Discount: www.tradingview.com ✨💸🤑
 Short
Short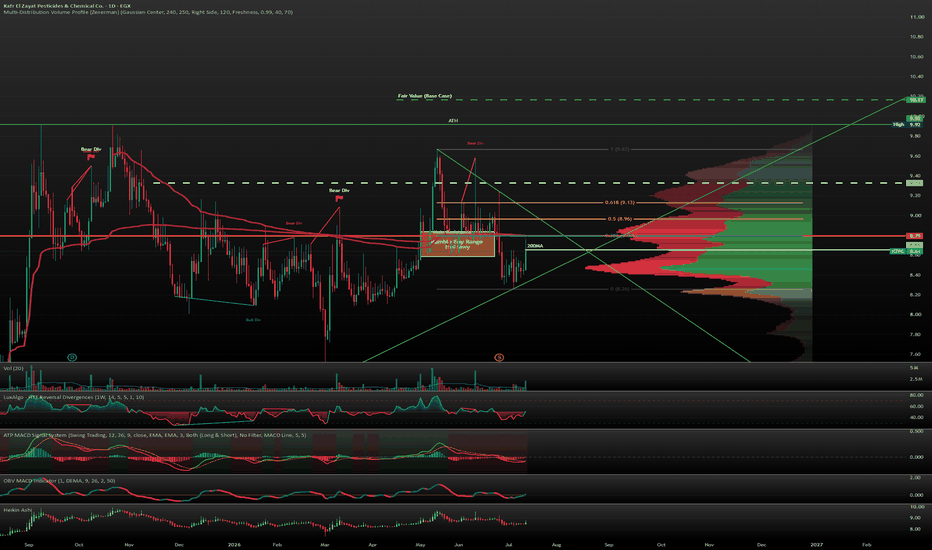
GDWA: Wait for the 1.09 EGP Breakout Before Considering an Entry📈 GDWA: Technical Potential Exists, but Fundamentals Remain a Major Concern ⚠️
The Fundamentals 🏭
Gadwa owns a diversified industrial portfolio with exposure to cables, dairy, and packaging businesses. 📈
Despite trading at an attractive valuation, the company is currently facing significant financial challenges, including margin compression, high leverage, and recent net losses.
These weak fundamentals continue to weigh heavily on the long-term investment case. ⚠️
❌Not Sharia-Compliant.
GDWA does not currently qualify for the EGX33 Shariah Index due to its financial ratios exceeding the permissible leverage thresholds established by the EGX Shariah Supervisory Committee.
The Pulse ⚡
This is a stock that may attract traders because of its technical recovery potential, but the fundamentals remain weak and do not currently support aggressive investment. 📉
The chart continues to face a major technical resistance that must be cleared before the bullish outlook improves. Until that happens, preserving capital should remain the priority. ⏳
🧱 The Key Structural Boundaries
🚀 Breakout Trigger, 1.09 EGP.
A daily close above this level is required before considering any new position.
⛔ Capital Protection.
Avoid entering before a confirmed breakout above 1.09 EGP, as the stock still faces significant technical resistance and weak underlying fundamentals.
The Verdict 🎯
GDWA may eventually present an attractive turnaround opportunity, but the current combination of weak fundamentals and major technical resistance makes the risk-to-reward ratio unfavorable. ⚠️
The preferred strategy is to protect capital and avoid entering until the market confirms a sustained breakout above 1.09 EGP. Only then would the technical picture begin to support a more constructive outlook. 💰
If you like my insights, follow and boost! 🙌💙🚀 🎁 $15 TradingView Discount: www.tradingview.com ✨💸🤑
 Short
Short
OCPH: Breakout Begins, but Confirmation Is Still Required 📈 OCPH: Breakout Begins, but Confirmation Is Still Required 🚀
The Fundamentals 💊
October Pharma continues to deliver strong earnings growth, with accelerating profitability, healthy return on equity, and strong institutional ownership. 📈
Its solid operational performance supports the long-term investment case, although limited free float and thin liquidity require disciplined trade execution. 💼
✅Sharia-Compliant.
OCPH satisfies the EGX33 Shariah screening criteria based on both its business activity and financial structure.
The Pulse ⚡
After reaching its all-time high at 416 EGP, OCPH entered a prolonged downtrend channel before establishing a strong base around the major support level at 357 EGP. 📊
Today's session produced a breakout from the downtrend channel with strong trading volume, signaling that buyers are returning. 🚀
However, two additional confirmations are still required before considering a new entry. First, the stock must achieve a daily close above 369 EGP to validate today's breakout. Second, it must break above the major resistance at 389 EGP, where a cluster of bearish supply remains active. ⏳
For long-term investors, a pullback toward the main support around 357 EGP could provide another attractive accumulation opportunity. Until one of these scenarios occurs, patience remains the preferred strategy. 💎
🧱 The Key Structural Boundaries
🚀 Breakout Trigger, 369.00 EGP.
A daily close above this level confirms the breakout from the downtrend channel.
🚀 Major Resistance, 389.00 EGP.
A breakout above this level clears the primary bearish resistance cluster and confirms the continuation of the bullish trend.
🛡️ Support Zone, 357.00 EGP.
A retest of the main support level offers an attractive long-term investment opportunity.
⛔ Stop-Loss, 335.00 EGP.
A daily close below this level invalidates the current bullish structure.
🎯 First Target, 416.00 EGP.
A retest of the all-time high.
💎 Second Target, 482.00 EGP.
The measured target from the triangle breakout.
🚀 Final Target, 541.00 EGP.
The long-term upside target if bullish momentum continues.
The Verdict 🎯
OCPH has delivered an encouraging technical breakout backed by strong volume, but confirmation is still required before the next bullish leg can begin. ✅
The preferred strategy is to wait for either a confirmed close above 369 EGP followed by a breakout above 389 EGP, or for a healthy pullback toward 357 EGP for long-term accumulation. 💰
As long as the stock remains above 335 EGP, the long-term technical outlook remains constructive. 🚀
If you like my insights, follow and boost! 🙌💙🚀 🎁 $15 TradingView Discount: www.tradingview.com ✨💸🤑
 Long
Long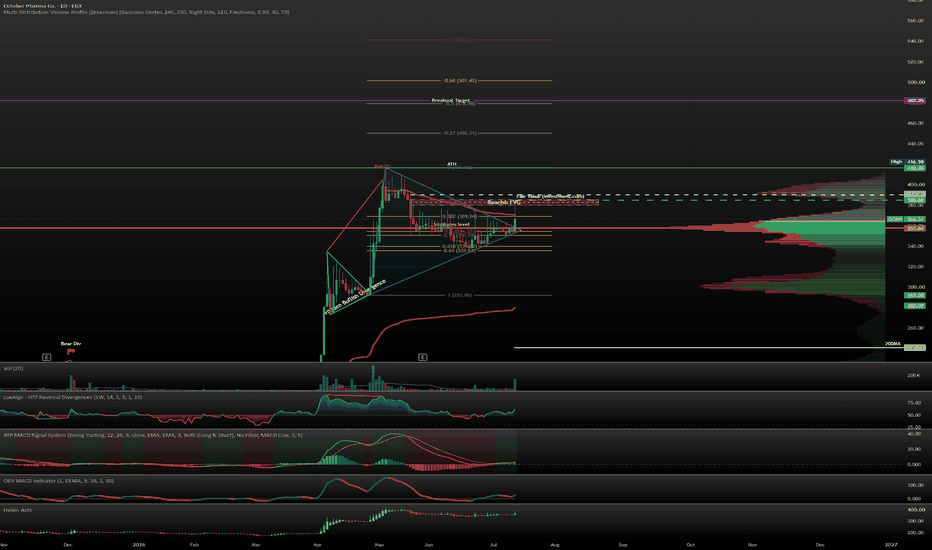
MCRO: Breakout Confirmed as Buyers Take Control 📈 MCRO: Breakout Confirmed as Buyers Take Control 🚀
The Fundamentals 💊
Macro Group Pharmaceuticals continues to execute a strong operational turnaround, returning to profitability after previous losses. 📈
Its focus on OTC healthcare and cosmeceutical products provides higher pricing flexibility than traditional pharmaceutical companies, while maintaining strong retail demand. 💼
Although leverage remains relatively high, improving earnings and strong liquidity continue to support the bullish investment case. ✅
❌Not Sharia-Compliant.
MCRO does not currently qualify for the EGX33 Shariah Index due to its financial ratios exceeding the permissible leverage thresholds established by the EGX Shariah Supervisory Committee.
The Pulse ⚡
Last week, MCRO completed a breakout from its triangle consolidation pattern and successfully retested the breakout level. 📈
Today's session confirmed the breakout with strong trading volume, significantly increasing the probability of a continuation toward higher targets. 🚀
Investors can either wait for a healthy pullback toward 1.27 EGP or wait for a confirmed daily close above 1.33 EGP before entering between 1.35 and 1.43 EGP. 💎
If neither setup occurs, patience remains the preferred strategy until either the pullback or breakout confirmation develops. ⏳
🧱 The Key Structural Boundaries
🚀 Breakout Trigger, 1.33 EGP.
A daily close above this level confirms the continuation of the bullish trend.
🛡️ Primary Support, 1.27 EGP.
A retest of this level offers the preferred accumulation opportunity.
⛔ Stop-Loss, 1.21 EGP.
A daily close below this level invalidates the current bullish structure.
🛡️ Secondary Support, 1.11 EGP.
If the current breakout fails, this becomes an attractive long-term investment zone.
🎯 First Target, 1.57 EGP.
Investment.com's estimated fair value.
💎 Second Target, 1.68 EGP.
A retest of the all-time high.
🚀 Final Target, 1.90 EGP.
The measured target from the triangle breakout pattern.
The Verdict 🎯
MCRO has confirmed its triangle breakout with strong buying volume, shifting the technical outlook back in favor of the bulls. ✅
The preferred strategy is to avoid chasing the current move and instead wait for either a pullback toward 1.27 EGP or a confirmed close above 1.33 EGP before initiating new positions. 💰
As long as the stock remains above 1.21 EGP, the probability favors a continuation toward the higher technical targets. 🚀
If you like my insights, follow and boost! 🙌💙🚀 🎁 $15 TradingView Discount: www.tradingview.com ✨💸🤑
 Long
Long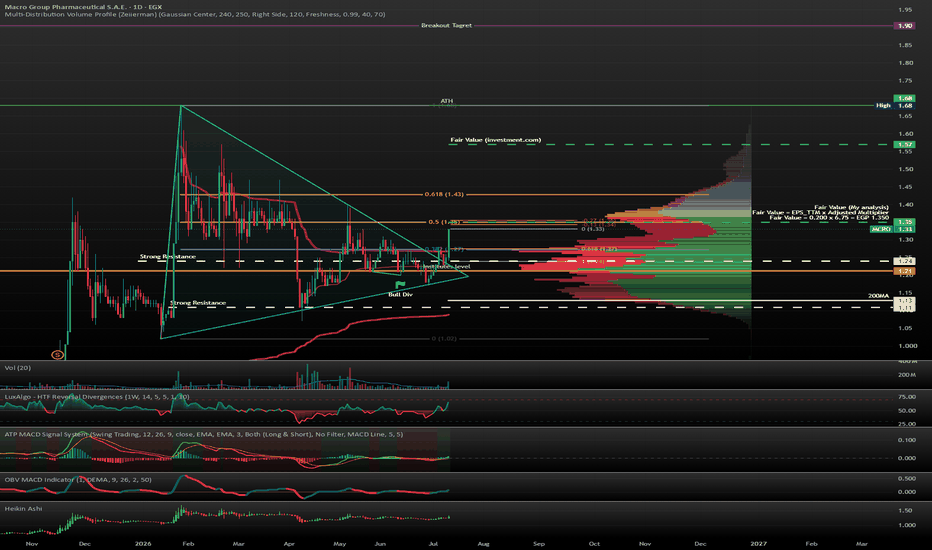
CIRA: Breakout Confirms the End of the Correction 📈 CIRA: Breakout Confirms the End of the Correction 🚀
The Fundamentals 🎓
CIRA remains one of the strongest long-term growth companies on the EGX, combining two resilient sectors: education and real estate. 📈
Its diversified education platform, expanding campus network, and strong earnings recovery continue to support the long-term investment story. 💼
Despite trading at a premium valuation, the company's dominant market position justifies continued institutional interest. ✅
✅ Sharia-Compliant.
CIRA's core education business activity and financial structure satisfy the EGX33 Shariah screening criteria.
The Pulse ⚡
CIRA has completed its Elliott Wave five-wave impulsive cycle and successfully finished an ABC corrective pattern. 🌊
Today's session confirmed the breakout above the ABC correction with strong trading volume while printing a new 52-week high. 🚀
The preferred entry is a healthy pullback toward 30.00 EGP. 💎
If momentum continues, a daily close above 32.21 EGP would provide another attractive breakout entry. 📈
If the stock trades between these two levels without confirmation, patience is preferred until either the pullback or breakout occurs. ⏳
🧱 The Key Structural Boundaries
🚀 Breakout Trigger, 32.21 EGP.
A close above this level confirms the continuation of the bullish trend.
🎯 First Target, 34.00 EGP.
The first major technical objective following the breakout.
💎 Second Target, 35.00 EGP.
A retest of the all-time high.
🚀 Final Target, 36.80 EGP.
The long-term upside target.
🛡️ Support Zone, 30.00 EGP.
A pullback to this level would provide the preferred accumulation opportunity.
⛔ Stop-Loss, 28.50 EGP.
A daily close below this level invalidates the current bullish structure.
🛡️ Secondary Support, 27.45 EGP.
A retest of the primary support level would offer an attractive long-term investment opportunity.
The Verdict 🎯
The technical structure has turned bullish following the confirmed ABC breakout. ✅
Investors should avoid chasing the stock between support and breakout levels, instead waiting for either a pullback toward 30.00 EGP or a confirmed close above 32.21 EGP. 💰
As long as the stock remains above its key support levels, the probability favors a continuation toward the higher technical targets. 🚀
If you like my insights, follow and boost! 🙌💙🚀 🎁 $15 TradingView Discount: www.tradingview.com ✨💸🤑
 Long
Long
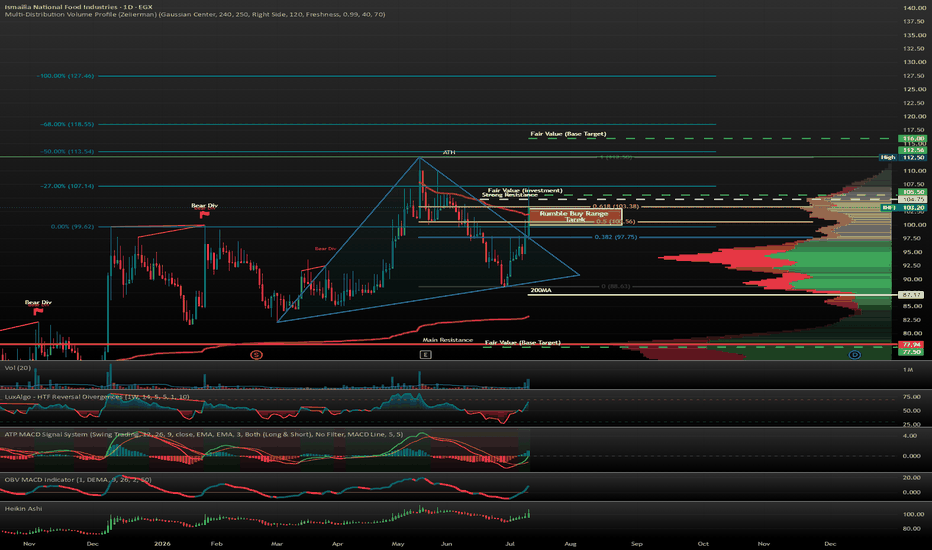
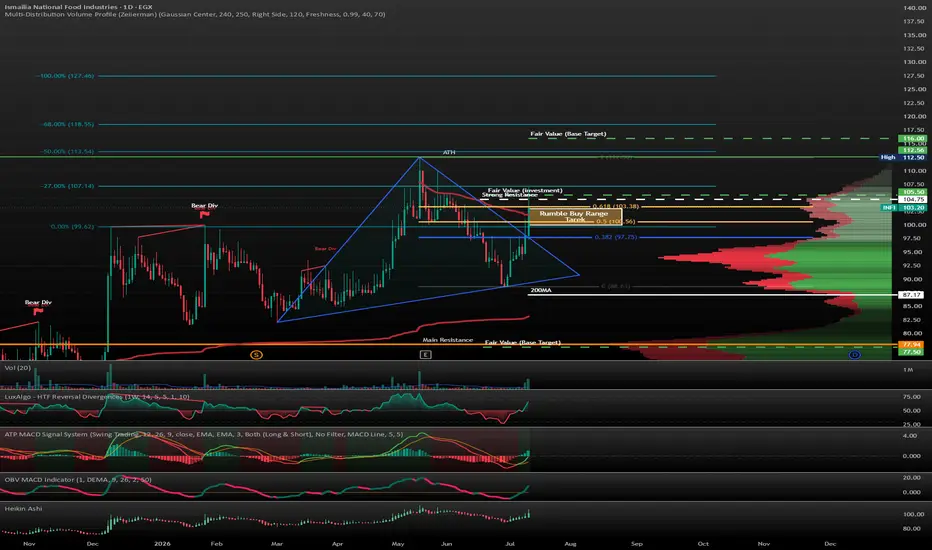
INFI: Triangle Breakout Confirmed, But Fundamentals Remain a Con📈 INFI: Triangle Breakout Confirmed, But Fundamentals Remain a Concern ⚠️
The Fundamentals 🌽
INFI benefits from strong institutional ownership, a healthy balance sheet, and a well-established position in Egypt's food processing sector. 📈
However, the sharp decline in recent earnings continues to weigh on the long-term investment case. ⚠️
The stock's current valuation remains difficult to justify based on the latest profitability figures. 📊
At this stage, the technical setup looks considerably stronger than the underlying fundamentals. 🔍
✅ Sharia-Compliant.
INFI's core business activity and financial structure satisfy the EGX33 Shariah screening criteria.
The Pulse ⚡
Last week, the stock successfully retested the triangle breakout level. 📊
Today's session confirmed the breakout and strengthened the bullish technical structure. 🚀
The next key confirmation comes from a daily close above 104.75 EGP, which would significantly improve the probability of a move toward new highs. 📈
For traders seeking a lower-risk entry, a retest of the breakout area around 100.56 EGP remains an attractive setup. 💎
Despite the bullish chart, position sizing should remain conservative given the weak earnings profile and the stock's reliance on retail sentiment. ⚠️
🧱 The Key Structural Boundaries
🚀 Breakout Trigger, 104.75 EGP.
A close above this level confirms the continuation of the bullish trend.
🎯 First Target, 112.50 EGP.
A retest of the all-time high.
💎 Second Target, 118.44 EGP.
The next major technical objective.
🚀 Final Target, 127.46 EGP.
The long-term upside target.
🛡️ Support Zone, 100.56 EGP.
A retest of this level would provide an attractive accumulation opportunity.
🛡️ Secondary Resistance, 107.14 EGP.
A break above this level would further strengthen bullish momentum.
⛔ Stop-Loss, 97.75 EGP.
A daily close below this level or a return inside the triangle pattern invalidates the current bullish structure.
The Verdict 🎯
The breakout is technically valid and momentum currently favors the bulls. ✅
However, this remains a sentiment-driven trade rather than a fundamentally supported investment. ⚠️
Avoid oversized positions and maintain strict risk management while the earnings picture remains weak. 🛡️
If you like my insights, follow and boost! 🙌💙🚀 🎁 $15 TradingView Discount: www.tradingview.com ✨💸🤑
 Long
Long