EMFD โ Bullish Market Structure & All-Time High BreakoutTrade Setup
Buy Zone 1: 11.85
Buy Zone 2: 10.91
Stop Loss: 10.08
Targets
Target 1: 13.58
Target 2: Trail Stop for trend continuation
Technical Overview
EMFD has confirmed a strong bullish market structure after breaking above its previous all-time high on elevated volume, signaling aggressive institutional participation and strong demand.
The breakout appears technically valid, but after such an extended move, a short-term pullback or retest of the breakout area would be a healthy developm
MPRC : Elliott Wave Exhaustion vs. Channel IntegrityMPRC : Elliott Wave Exhaustion vs. Channel Integrity ๐
๐ The Pulse:
MPRC has exhibited stellar structural strength since March, consistently mapping higher highs inside a well-defined ascending trend channel.
However, localized momentum readings indicate the structure is approaching severe Elliott Wave exhaustion, hinting at a looming corrective phase.
The immediate price action will serve as a definitive litmus test to see whether buyers can muster one final cyclical push or if sellers will
FCMD: The Paper Profit Illusion: A Squeeze Caught in a Cash CrunFCMD โ The Paper Profit Trap vs. Bollinger Resistance ๐งฌ๐
The Reality: Severe cash conversion issues are evident ๐งพโ๐ต.
I find a stark divergence where reported operating earnings are completely trapped in accrual accounting adjustments rather than turning into liquid capital.
Top-line revenue spikes are completely unbacked by cold, hard cash in the bank, signaling highly aggressive, non-cash revenue recognition.
The Risk/Regulatory Flag: High solvency and supply chain credit traps are flashing
F
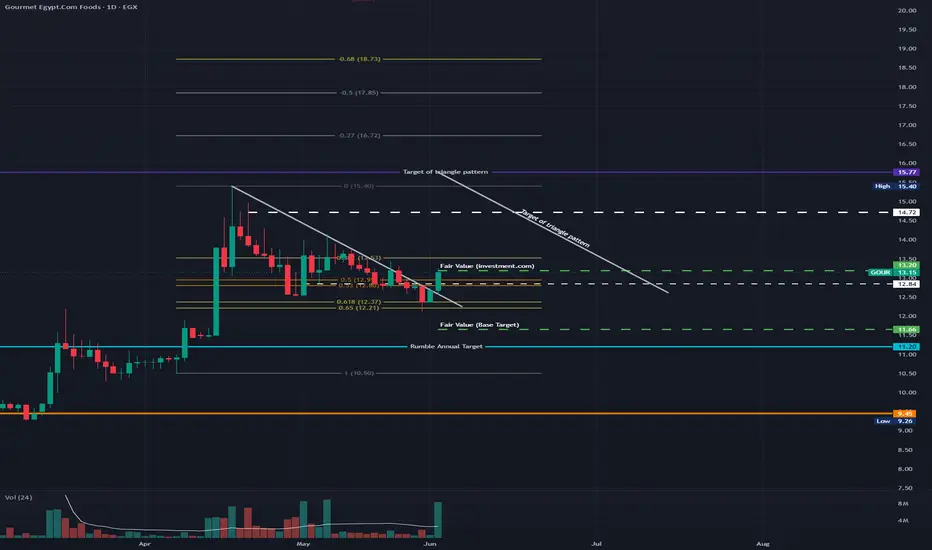
GOUR: Triangle Breakout & TargetsGOUR: Triangle Breakout & Targets ๐
๐ The Pulse: GOUR remains a top-tier pick with a highly efficient business model.
While its growth is priced into traditional models, the hidden premium of its massive brand equity isn't.
Today, the chart validated this fundamentally strong narrative with a massive technical breakout, smashing through a clear triangle pattern on powerful volume and a decisive bullish momentum candle. ๐๐
๐งฑ The Key Structural Boundaries:
The Initial Fib Ceiling (13.50 EGP):
Abuk (Long)ABUK โ Bull Flag Continuation | Risk-Defined Entry
Setup:
Price structure showing a Bull Flag pattern following a strong impulse leg. Market environment is broadly bullish, with signs of potential transition from corrective to impulsive wave.
Risk Parameters:
Entry: 88.29
Stop Loss: 82.44
Risk (1R): 5.85 pts
Target 1: 94.27 (โ 1R)
Target 2: Trailing โ letting the market decide
Execution note:
Entry taken before daily close. Assessed risk as acceptable given current structure โ flag channel hol
BTFH (Beltone Holding, EGX) โ Breakout Confirmed, Target 3.90Market Overview & Technical Setup
Daily Chart
EGX:BTFH has successfully broken out of its medium-term bearish trendline (descending from the 3.66 and 3.61 peaks). After establishing a solid horizontal support base around 2.80 , the stock has shifted its market structure to bullish, posting higher lows and recently breaking above local resistance.
โข Current Price: 3.21
โข Trend: Bullish Reversal (Trendline Breakout)
Key Technical Indicators
โข MACD (12, 26, 9): Moving averages are well-
MACRO โ Trend Continuation Setup
Trade Plan
* Buy #1: 1.28
* Buy #2: 1.24
* Stop Loss: 1.20
Profit Management
* Target 1: 1.36
* Target 2: Trail Stop
Technical Context
The stock appears to be completing a corrective phase and may be preparing for a new impulsive advance.
**Reasons for Entry:**
* Falling Wedge reversal pattern.
* Trend continuation setup within the broader uptrend.
* Potential transition from a corrective structure into a new impulse wave.
* Risk-to-reward profile remains favorable while price holds a
Recap Egypt has bullish indicatorsDaily chart,
I expect the price EGX:REAC will continue to form a triangle chart pattern.
Technical indicators RSI and MACD are positive, and showing a bullish movement - i.e. A soon breakout
However, I think after a rally of 7 consecutive green candlesticks, a minor correction should happen to test the support line S.
Then, a rebound to test the upper resistance line R. The breakout can be around 8.50 - 5.45
After crossing R (and stabilizing for 2 days with high volume), the target wil
RLong
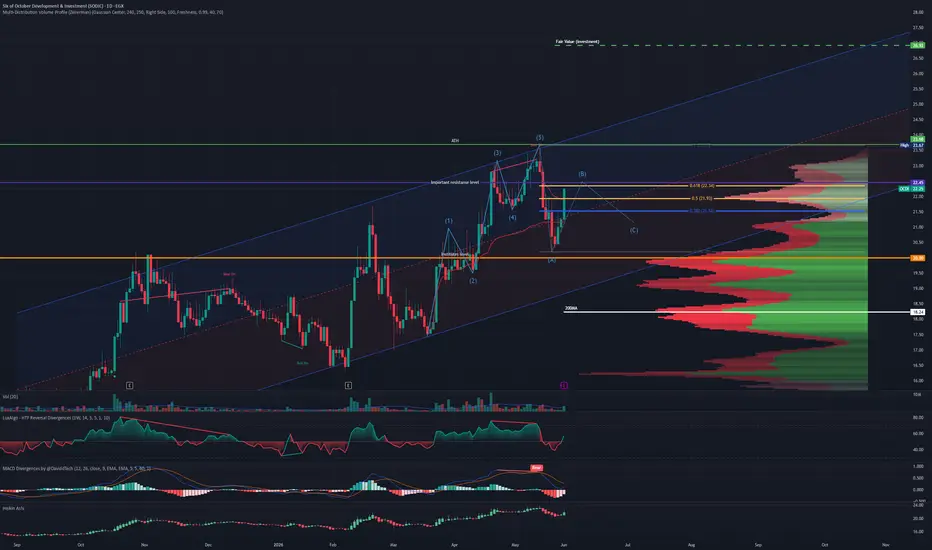
OCDI: Elliott Wave 5 Done, ABC Correction in Play OCDI: Elliott Wave 5 Done, ABC Correction in Play ๐๐
๐ The Pulse: OCDI is building momentum for what looks like a new bullish wave toward the ATH at 23.7.
But from an Elliott Wave read, the 5th wave already closed at the ATH, and we're now inside an ABC correction.
Failure to close above 22.45 would confirm the B point and open the road to the C-leg target between 21โ21.5. ๐ฏ
๐งฑ Key Levels
The ATH (23.7 EGP): Wave 5 top, the magnet for the bullish read. ๐
The B-Point Trigger (22.45 EGP): Res
SWDY: Elliott Wave 5 Done, ABC Correction in PlaySWDY: Elliott Wave 5 Done, ABC Correction in Play ๐๐
๐ The Pulse: SWDY has completed Elliott Wave 5 and from my read, we're now inside an ABC correction.
The C-leg target lines up beautifully with the Fair Value Gap (FVG) and the 50% Fib retracement at 85 EGP. ๐ฏ
๐งฑ Key Levels:
The C-Leg Target (85 EGP): FVG + 50% Fib confluence = high-probability reaction zone. ๐ฏ
The Decision Line (90 EGP): Holding above keeps the bullish continuation alive. โ๏ธ
Fair Value (100 EGP): Medium-term upside targe
ELSH: Hidden Land Bank Value Fuels Sharp UptrendELSH: Hidden Land Bank Value Fuels Sharp Uptrend ๐๏ธ๐
๐ The Pulse: Any fair value model on ELSH will look weak because the company hasn't repriced its land bank to reflect real value.
But technically, momentum is very loud: a sharp-angle uptrend channel just printed a strong break on high volume, signaling bullish wave continuation.
Price already closed inside the ATH order block today. ๐ฅ๐
๐งฑ Key Levels
Support (~8.4 EGP): The line in the sand. ๐ก๏ธ
ATH Order Block: Already entered today, next
PHAR Liquidity Surge Signals New Uptrend LegPHAR Liquidity Surge Signals New Uptrend Leg ๐
๐ The Pulse: PHAR is reacting off the pullback today with massive liquidity (180M EGP), a level not seen since September 2025 (260M EGP), which kicked off the original uptrend channel.
Strong signal that a new momentum leg is loading. ๐ฅ๐
๐งฑ Key Levels
Support (83 EGP): The new floor to defend. ๐ก๏ธ
The Confirmation (87.9 EGP): Resistance must break to officially end the pullback. ๐
Short-Term Target (92 EGP): ATH retest. ๐
Medium-Term Target (96
FTNS (LONG)Context & Thesis
FTNS has been in a downtrend, but price is now showing early signs of a trend transition. This is not a confirmed reversal yet โ it's a breakout attempt with supporting evidence that warrants a structured, risk-controlled position.
Why I took this:
Downtrend breakout structure developing
Volume expansion confirming buyer participation at the breakout zone
MACD histogram momentum confirmation
Potential early-phase trend transition โ not a reversal call, a participation call
Tra
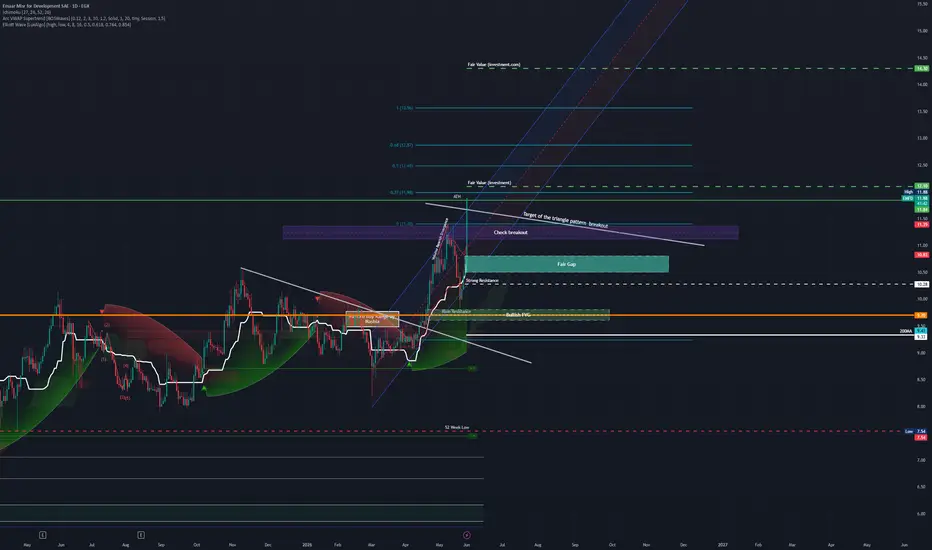
EMFD Quick Range MapEMFD Quick Range Map ๐
๐ The Pulse: EMFD fired off a rocket pattern today (opening with fair value gap + long momentum candle), confirming a new strong bullish wave and printing a fresh ATH. ๐๐ฅ
๐งฑ Key Levels
New Support (11.4 EGP): The old ATH, now flipped into the key support floor. ๐ก๏ธ
Short-Term Target (12.5 EGP): First take-profit zone. ๐ฏ
Medium-Term Target (13.5 EGP): Continuation objective. ๐ฏ๐ฏ
Long-Term Target (14.3 EGP): Full measured move target. ๐
If you like my insights, follow a
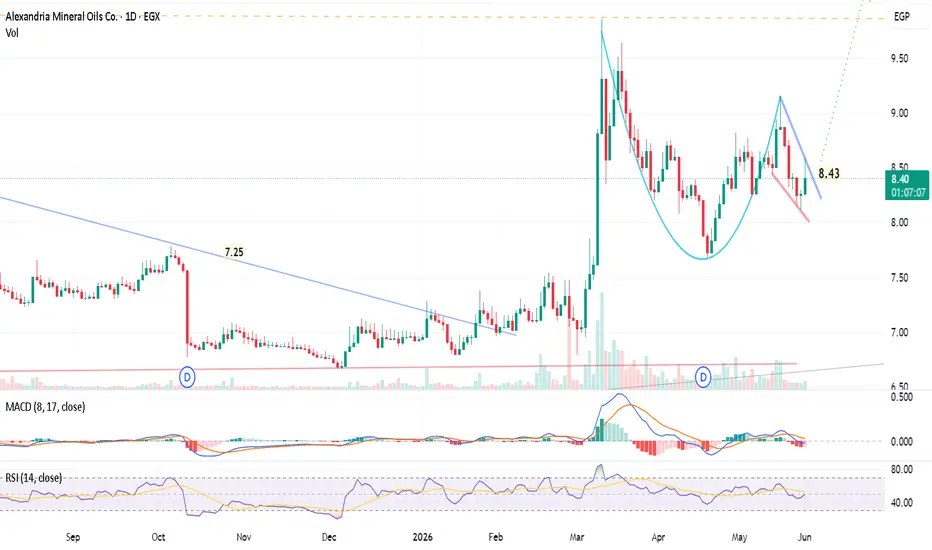
EGX - AMOC: Probable Cup & Handle Setup๐ Idea Type: Long / Bullish Continuation
๐ Timeframe: Daily (1D)
Technical Setup
Pattern: Clear Cup and Handle formation on the daily chart AMOC_2026-06-01_13-29-03.png.
Trigger: Looking for a decisive daily candle close above 8.43 EGP to confirm the handle breakout.
Indicators: Volume has dried up constructively on the descent. RSI (49.25) and MACD are compressed near mid-lines, primed for an upside momentum shift.
Trade Execution Strategy
Entry Zone: 8.40 - 8.45 EGP (Best confirmed on a
ETRS Quick Range Map ETRS Quick Range Map ๐
๐ The Pulse: ETRS just broke the key 8 EGP resistance today on very strong volume, confirming the triangle pattern breakout and unlocking a measured-move target up to 10.3 EGP. ๐ฅ๐
If you like my insights, follow and boost! ๐๐๐
๐ $15 TradingView Discount: ๐ www.tradingview.com โจ๐ธ๐ค
EGX: ZEOT - A possible breakoutExtracted Oils & Derivatives Co. ( EGX:ZEOT ) is at a decisive junction on the Daily chart . Price is compressed at the apex of a multi-month symmetrical triangle, testing structural trendline support.
Technical Breakdown
Price Action: Trading at 8.69 EGP (+1.05%), sitting directly on the long-term ascending support (red line).
Key Resistance: Remains below the broken horizontal shelf at 9.00 EGP.
Momentum:
- MACD : Bearish; line at -0.177 and histogram at -0.073.
- RSI : Weak at 4
KABO โ Distribution Phase Trapped Under Heavy Supply KABO โ Distribution Phase Trapped Under Heavy Supply ๐๐งต
The Reality: I see a speculative asset flashing clear forensic red flags! ๐จ
Hidden behind the recent trading hype, the company's net operating cash margin is being heavily choked by massive working capital tied up in raw material stockpiling (cotton and synthetic yarns).
A major divergence exists here: reported operating profits look fine on paper, but the cold hard cash is trapped inside warehouse inventory instead of flowing smoothly i
MCQE is a High-Conviction Fundamental and Technical Buy on Dips.MCQE is a High-Conviction Fundamental and Technical Buy on Dips. ๐๐
The Reality: I see a "Fundamental Tank" crushing the industrial space! ๐๐
Cash conversion is incredibly efficient Q1 2026 consolidated net profit skyrocketed to EGP 793.56M (up massively from EGP 310.70M in Q1 2025) ๐๐.
Operating cash flow (EGP 705.3M in Q1 alone) tracks accounting profits smoothly, leaving no room for artificial paper accruals or accounting maneuvers ๐งผ๐ฐ.
The Pricing Moat: I observe supreme localized pricing
HELI: Healthy Consolidation Map HELI: Healthy Consolidation Map ๐๏ธ
๐ The Pulse: After printing a fresh ATH last week, HELI is cooling down.
Indicators are normalizing, and both volume and liquidity are drying up.
This isn't a structural collapse; it's a textbook pause to build energy and sustain the broader ascending channel. ๐๐
๐งฑ Key Levels
The 50% Fib Anchor (6.00 EGP):
Your first defensive buffer.
A mild pullback here retests key support while flushing short-term overbought conditions. ๐ฏ๐งฑ
The Deep Discount Zone (5.80
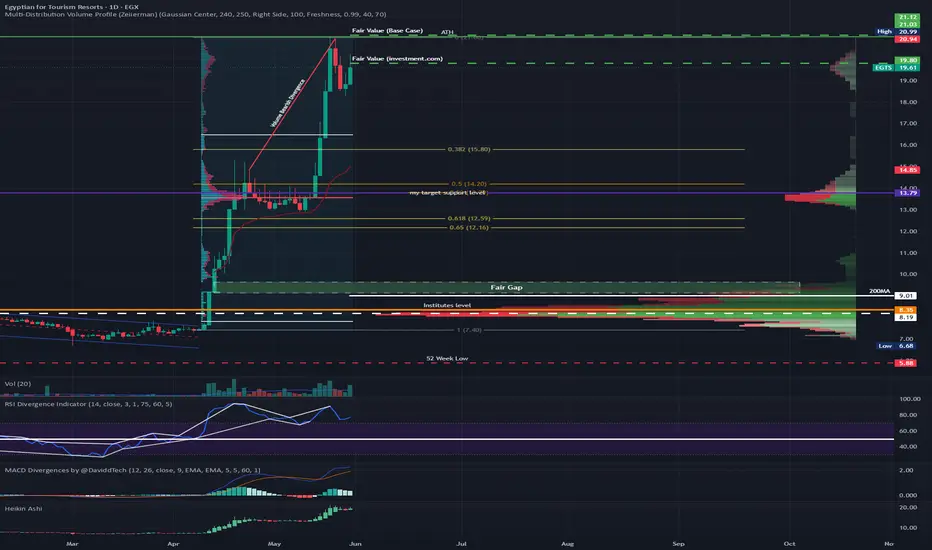
EGTS โ Post-Target Pullback Sets Up Next Major Re-Entry EGTS โ Post-Target Pullback Sets Up Next Major Re-Entry ๐๐๏ธ
The Reality: I see a "High-Beta Momentum Play" riding high on a true turnaround! ๐ข๐
The shift from massive historical losses to a net profit crossing EGP 1B is fully organic, fueled strictly by genuine land handovers and core resort operations, not balance sheet gymnastics!
But watch out: master layout delays mean paper profits from land sales are outrunning actual Operating Cash Flow (CFO), keeping accruals very high โณ๐ธ.
The Struct
ADIB growth +241% since 2024Growth: +241% since 2024, compared to the EGX30 index, which rose by only 106%.
One of the strongest and most successful investments that has drawn attention over the past three years on the Egyptian Stock Exchange in general, and the EGX30 index in particular.
Technical Analysis (for long-term investors, not traders)
Recommendation: Hold. Any decline in price is considered a strong buying opportunity, with a stop-loss level at EGP 36.
Financial Analysis (Focus on Q1 2026 Results โ Simplified
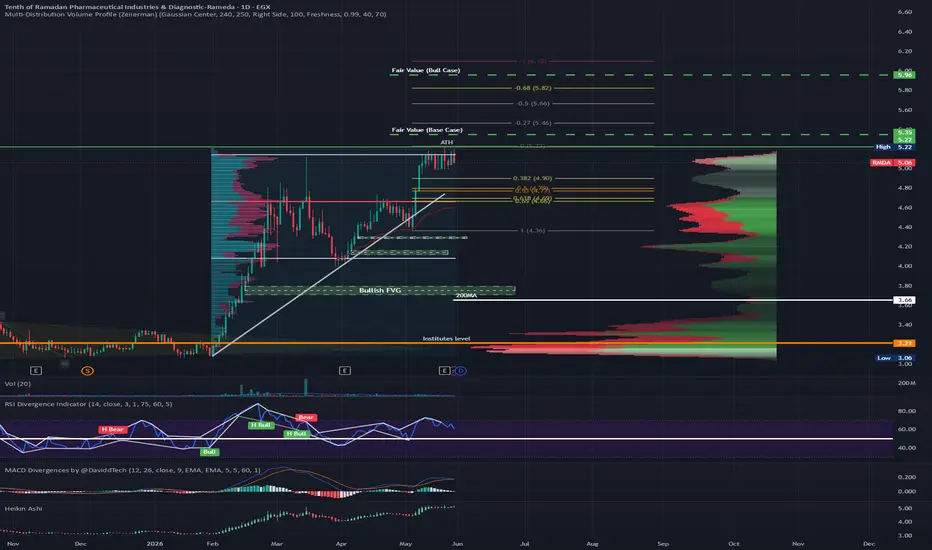
RMDA: Distribution Phase Map RMDA: Distribution Phase Map ๐
๐ The Pulse:
RMDA is stalling near its 52-week high of 5.22 EGP.
Volume is sharply fading during this consolidation, a textbook institutional distribution signature.
Expect a strong correction down to key support to reload momentum before another ATH attempt. ๐๐
๐งฑ Key Levels:
The Target Floor (4.66 EGP):
This structural support area is where the stock should find baseline buyers to absorb the distribution. ๐ฏ๐งฑ
The Heavy Ceiling (5.22 EGP ATH):
Major overhead