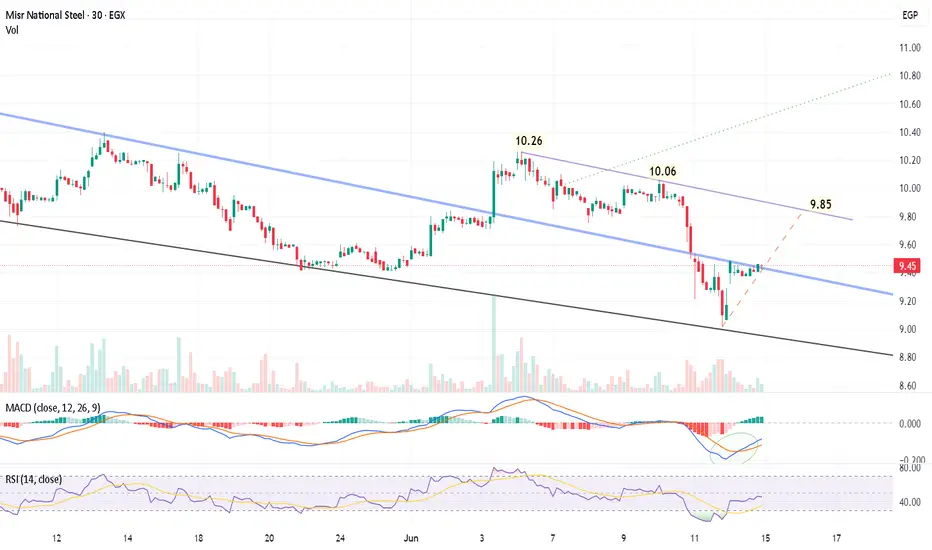
ATQA - EGX : 30-min Chart OverviewEGX:ATQA 30-min Chart
๐ Executive Summary
The 30-minute chart in ATQA_2026-06-14_21-21-41.png shows ATQA trading at 9.45 EGP (down slightly by $-0.11\%$). Following a sharp downward flush down to the $9.00$ psychological support area on June 11thโ12th, the stock has printed a sharp V-shaped recovery. ATQA is currently compressing at a critical inflection point where the immediate recovery path meets a major long-term descending resistance line (blue line). A breakout here confirms a shi
ASPI - EGX : 30-min Chart OverviewEGX:ASPI 30-min chart
๐ Executive Summary
The chart ASPI_2026-06-14_21-07-48.png captures ASPI on a 30-minute timeframe following a massive, high-volume bullish rally in early June. After peaking near 0.390, the stock entered a healthy, descending corrective phase. Currently, ASPI is compressing into a classic Falling Wedge/Pennant structure, trading at 0.319 EGP (down slightly by โ0.93% during the session). The price action is compressing right at a vital crossroads between a localized dy
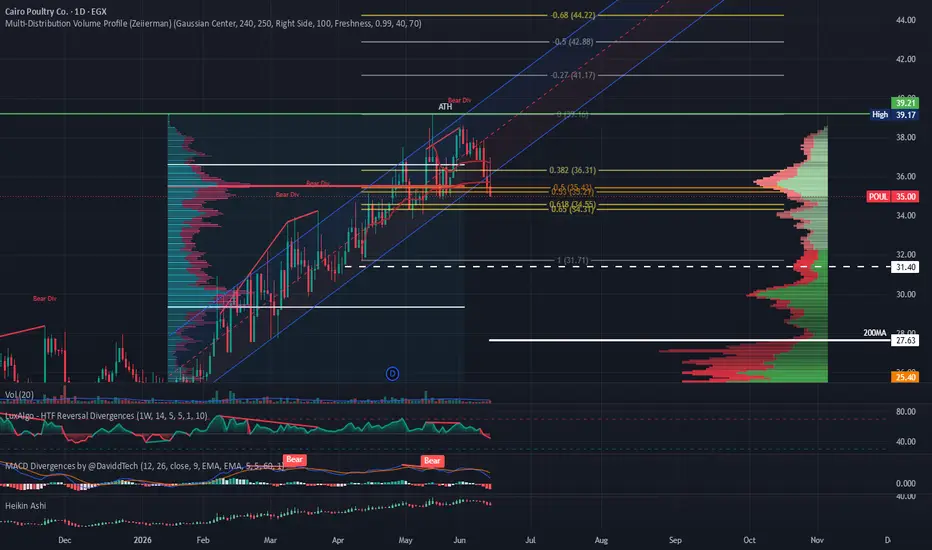
POUL: Critical Test Of 34.55 Support๐ POUL: Critical Test Of 34.55 Support โ ๏ธ๐
๐ The Pulse
POULโs strong yearly uptrend is under pressure after breaking its channel post-ATH and failing to re-enter it, with bearish sentiment amplified by rising volume on the pullback.
๐งฑ The Key Structural Boundaries
๐ Fibonacci 61.8% Confluence โ 34.55: The 61.8% retracement aligns with 34.55, forming the last line in the sand for the current uptrend.
๐ก๏ธ Primary Support / Stop Zone โ 34.55: A decisive break below 34.55 should trigger stop losse
SCTS โ Hourly Time Frame
SCTS is showing signs that the prevailing downtrend may be losing momentum. After an extended period of selling pressure, price action is beginning to stabilize, suggesting that bears are no longer in full control of the market.
Recent behavior points toward a potential trend exhaustion phase, where downside momentum is weakening and buyers are gradually stepping in. While a confirmed reversal has not yet been established, the current structure supports the possibility of an early trend trans
CLHO: Fair Value Consolidation Ahead of New Earnings๐ CLHO: Fair Value Consolidation Ahead of New Earnings ๐๐
๐ The Pulse:
Cleopatra Hospital Company is currently trading around its 50% Fibonacci fair value region at 14.80 EGP. ๐
I expect the price action to remain rangebound and chop within this vicinity for some time. โณ
The stock needs to wait for upcoming earnings reports to print stronger financial numbers before triggering a major expansion. ๐
๐งฑ The Key Structural Boundaries
The Value Entry Level (14.23 EGP): High-probability positioning
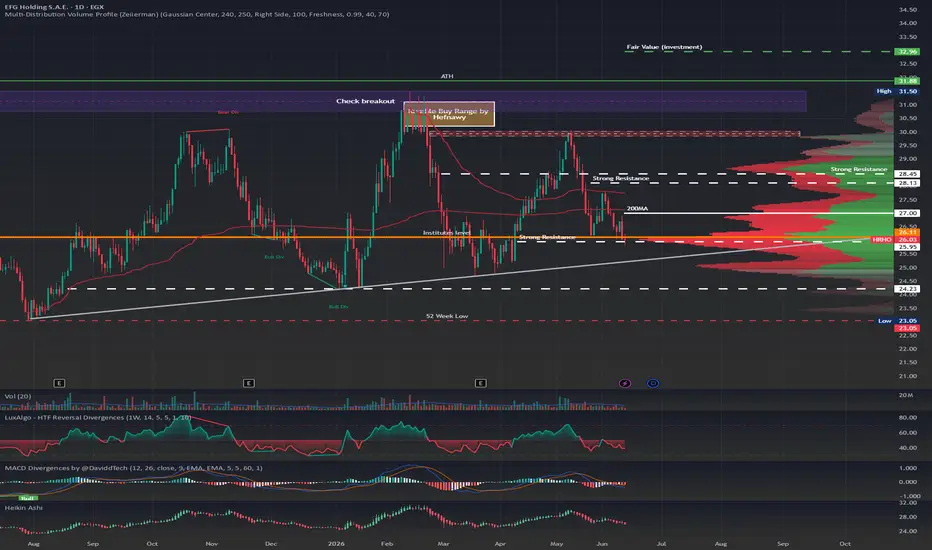
HRHO: Systematic Weakness Persists Below Key Resistance๐ HRHO: Systematic Weakness Persists Below Key Resistance ๐๐
๐ The Pulse:
EFG Holding is displaying a clear pattern of systematic weakness. ๐
Every time the price tests the 30.50 - 31.50 EGP region just below its ATH, it pullbacks to a trendline before attempting another retest. ๐
I expect the price to drop back to touch this trendline baseline once again. ๐
๐งฑ The Key Structural Boundaries
The Wait-and-See Condition: The active trendline currently sits below both the main support and the 200
KORRA: Successful IPO Eyes New Breakout Next Week ๐ KORRA: Successful IPO Eyes New Breakout Next Week ๐๐
๐ The Pulse:
Korra Energi delivered an exceptionally successful IPO debut. ๐
The stock reached an impressive intraday high of 3.87 EGP before closing the session at 3.55 EGP. ๐ฐ
The asset easily surpassed my initial target of 3.20 EGP during this explosive opening drive. ๐
๐งฑ The Key Structural Boundaries
The Crucial Defensive Floor (3.28 EGP): The price must hold above this near-term pivot baseline. โ
Holding safely above this line keeps
GOUR: Trendline Retest Offers Defensive Investment Entry๐ GOUR: Trendline Retest Offers Defensive Investment Entry ๐๐
๐ The Pulse:
Gourmet Egypt completed a trendline retest after breaking its triangle pattern. ๐
This localized pullback was driven entirely by broader market bearish conditions. ๐
I expect the stock to resume its primary bullish wave next week. โก
๐งฑ The Key Structural Boundaries
The Near-Term Target (13.78 EGP): Strong horizontal resistance level. ๐ฏ
Clearing this supply barrier is the first step toward validation. ๐
The Fair Value
ISPH: Anchored VWAP Holds Prior to Anticipated Resistance Test ๐ ISPH: Anchored VWAP Holds Prior to Anticipated Resistance Test ๐๐
๐ The Pulse:
Ibnsina Pharma initiated a pullback last week after tagging a major resistance ceiling. ๐
The price action printed a minor bullish reaction right at the Anchored VWAP level. โก
I expect a fresh retest of the major overhead supply zone in the coming week. ๐
๐งฑ The Key Structural Boundaries
The Anchored VWAP Support (11.30 EGP): Core horizontal demand zone. โ
The price may test this main support baseline once more b
GBCO: Consolidation Rules Post-Uptrend Line Breakdown ๐ GBCO: Consolidation Rules Post-Uptrend Line Breakdown ๐๐
๐ The Pulse:
I view Ghabbour Auto as more sideways than bullish on the medium-term timeframe. ๐
The price action broke below its primary uptrend line and has already retested it twice. ๐
A double bottom pattern successfully played out and hit its first target before reacting downward. โก
I see the stock building momentum for a potential third retest of that major broken trendline. ๐
๐งฑ The Key Structural Boundaries
The High-Value Entry
ETEL - good opportunity - low riskETEL โ 1-Day Timeframe
Trend analysis shows the stock is in a major uptrend since 2025, with price action consistently respecting a trend line established from November 2026. Prices have now returned to this trend line, forming a bullish candle.
Entry at current levels offers a low-risk opportunity. Set stop loss at 93.00. Targets: 98 to 102.
It is preferable to hold the stock if the weekly close is above 100 EGP.
*Disclaimer:* This analysis is based on chart data and is not investment advic
TAQA: Pullback Follows Fair Value & 52-Week High Touch ๐ TAQA: Pullback Follows Fair Value & 52-Week High Touch ๐๐
๐ The Pulse:
Taqa Arabia successfully hit its upside target today. ๐ฏ
The price immediately initiated a pullback after tapping its 52-Week High and matching fair value. ๐
I am zoom out to analyze the macro trend while adjusting my near-term support zones. ๐
๐งฑ The Key Structural Boundaries
The Minor Support Level (14.80 EGP): Immediate horizontal floor. โ
This level is short-term and considered structurally weak. ๐
The Main Support B
RREI โ Downtrend Breakout with Volume Confirmation
### Trade Setup
**Buy Zone 1:** 3.73
**Buy Zone 2:** 3.58
**Stop Loss:** 3.44
### Targets
**Target 1:** 4.02
**Target 2:** Trail Stop for trend continuation
---
### Technical Overview
RREI has recently broken above its downtrend line, signaling a potential shift in market character after a prolonged corrective phase.
What makes this breakout particularly noteworthy is the accompanying expansion in volume, indicating increased buyer participation and stronger conviction behind the move. W
ZEOT โ Downtrend Breakout on Hourly Time FrameTrade Setup
Buy Zone 1: 9.29
Buy Zone 2: 9.08
Stop Loss: 8.87
Targets
Target 1: 9.71
Target 2: Trail Stop for trend continuation
Technical Overview
On the hourly time frame, ZEOT has broken above a well-defined downtrend line, signaling a potential shift from bearish to bullish momentum.
Adding confidence to the setup, momentum indicators are showing a bullish divergence, where momentum improved despite price making lower lows during the correction. This often serves as an early warning si
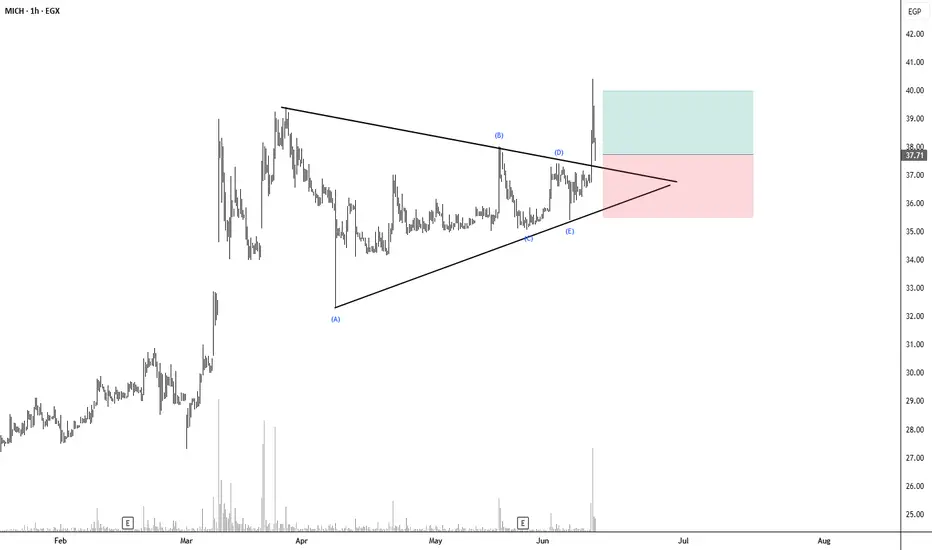
MICH โ Hourly Time FrameMICH is showing a potential bullish continuation setup following a breakout from an Elliott Wave triangle pattern. Price has successfully completed the breakout phase and is now retesting the former resistance area, which may act as new support in the context of Wave 4 development.
The retest is accompanied by a strong volume candle, indicating active participation from buyers and adding confidence to the validity of the breakout. If support continues to hold, the setup may provide an opportuni
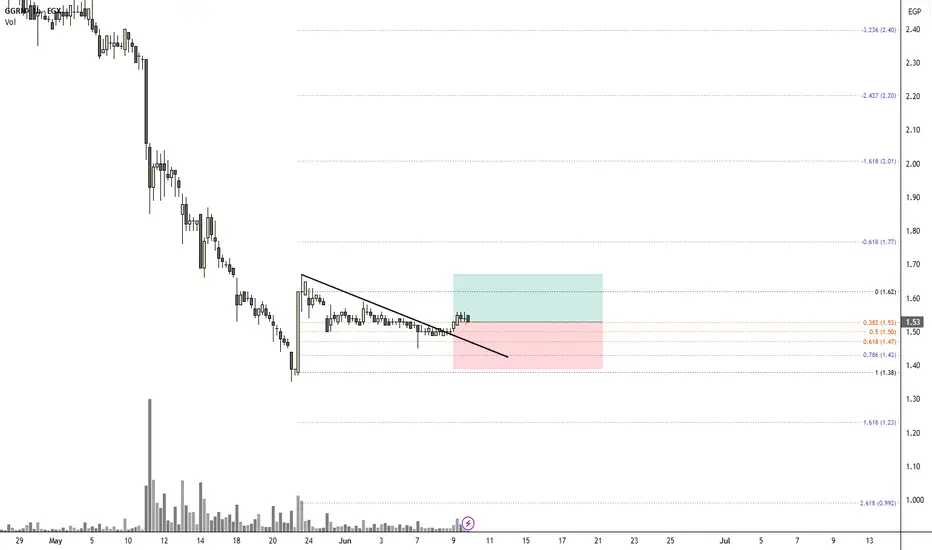
GGRN โ Hourly Time FrameAfter an extended downtrend, GGRN appears to be entering a potential accumulation phase as price transitions into a period of consolidation. The current range is developing within the boundaries of a strong bullish Marubozu candle, suggesting that buyers have started to absorb selling pressure.
Price action has remained stable above the key Volunacci Golden Zone, an area often associated with shifts in market control. A decisive commitment above this zone could signal the early stages of a bull
UBEE โ Hourly Time FrameUBEE continues to demonstrate strong bullish behavior, maintaining its uptrend structure with a sequence of higher high and higher low. The current setup favors trend continuation as buyers remain in control and price continues to respect the prevailing upward momentum.
Volume expansion supports the ongoing advance, while momentum remains positive, suggesting that bullish participation is still present. As long as the trend structure remains intact, the stock may continue to offer opportunities
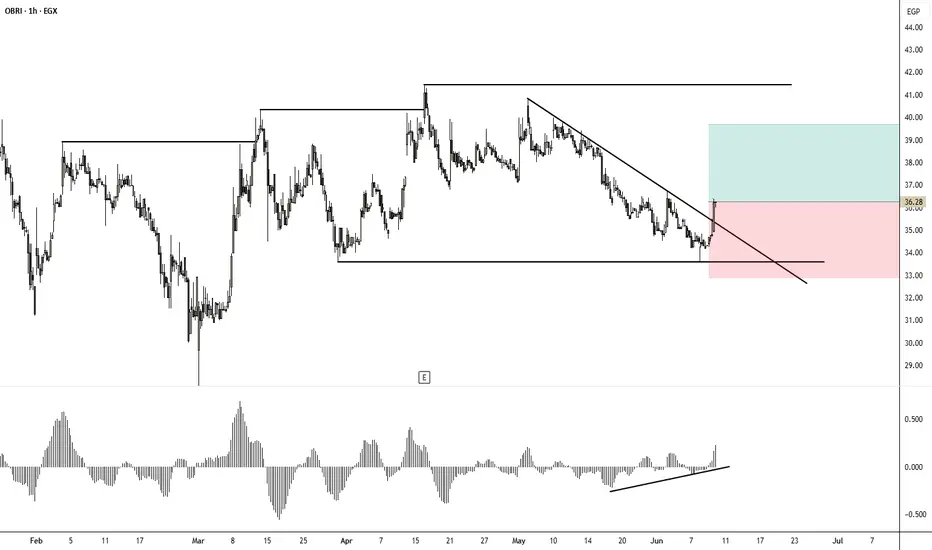
OBRI โ Hourly Time FrameA potential bullish reversal setup is developing on OBRI as price breaks above the descending trendline that has guided the recent downtrend. Selling pressure appears to be fading, with momentum divergence suggesting that bearish strength is weakening despite recent price action.
The stock has also reacted positively from a key support zone, adding confluence to the bullish case. Traders may look for continuation above the breakout area as confirmation that buyers are regaining control.
Entry
BTFH: Consolidation Holds Below Key Resistance Trigger ๐ BTFH: Consolidation Holds Below Key Resistance Trigger ๐๐
๐ The Pulse:
I consider Beltone Financial Holding to be in a flat sideways phase. ๐
The price action is actively whipsawing above and below the 200 Moving Average (MA) line. ๐
The primary macro support structure at 3.10 EGP remains highly relevant. โก
I remain neutral until a decisive expansion signal confirms structural control. ๐
๐งฑ The Key Structural Boundaries
The Structural Entry Target (2.97 EGP): Major horizontal demand zone. โ
ETRS: Pullback Ignites New Momentum to Retest ATH ๐ ETRS: Pullback Ignites New Momentum to Retest ATH ๐๐
๐ The Pulse:
Egytrans completed a healthy pullback and is gaining strong buying momentum. ๐
The price action is gearing up to retest its All-Time High (ATH). โก
I am updating the critical upside milestones and setting tight defensive floors. ๐
๐งฑ The Key Structural Boundaries
The Primary Support Target (8.54 EGP): Immediate horizontal demand zone. โ
I consider this level an excellent, high-probability entry point. ๐ฏ
The Hard Stop Loss (Be
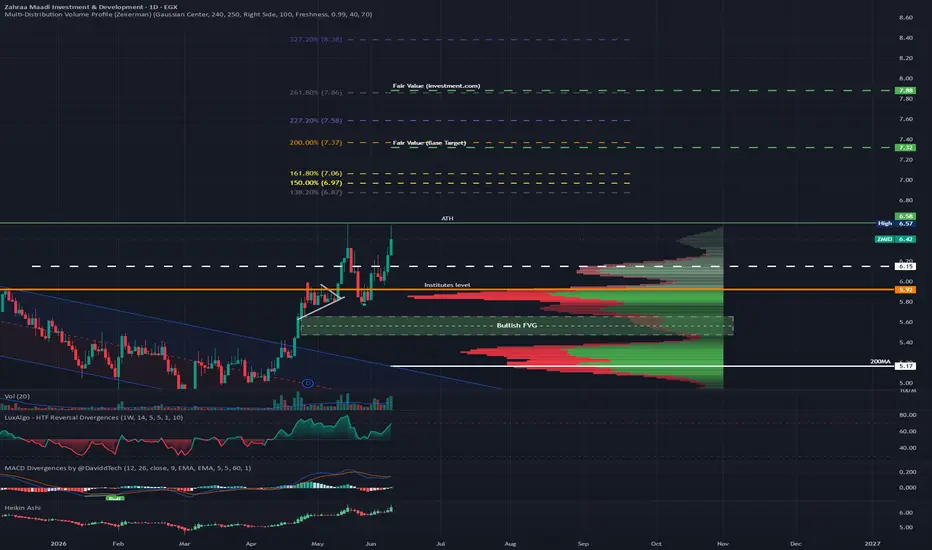
ZMID: Heavy Liquidity Fuels Potential ATH Breakout๐ ZMID: Heavy Liquidity Fuels Potential ATH Breakout Over Double Top ๐๐
๐ The Pulse:
Zahraa Maadi is facing a major structural crossroads between a Double Top rejection or a massive All-Time High (ATH) breakout. โก
I strongly favor the bullish breakout scenario. ๐
Strong institutional liquidity continues to inject solid momentum into the stock. ๐
All technical indicators look heavily bullish to support this expansion. ๐
๐งฑ The Key Structural Boundaries
The Primary Support Target (6.15 EGP): Im
NCCW: Strong Liquidity Surges Despite Resistance Rejection ๐ NCCW: Strong Liquidity Surges Despite Temporary Resistance Rejection ๐๐
๐ The Pulse:
I view Nasr Company for Civil Works as highly bullish due to a strong influx of liquidity. ๐
The price tested a major resistance ceiling today but failed to break above it. ๐
The underlying volume profile suggests this pause is only temporary. ๐
๐งฑ The Key Structural Boundaries
The Resistance Ceiling (6.87 EGP): Immediate horizontal barrier. ๐ฅ
Clearing this level is required to unlock the next leg up. ๐งฑ
Th
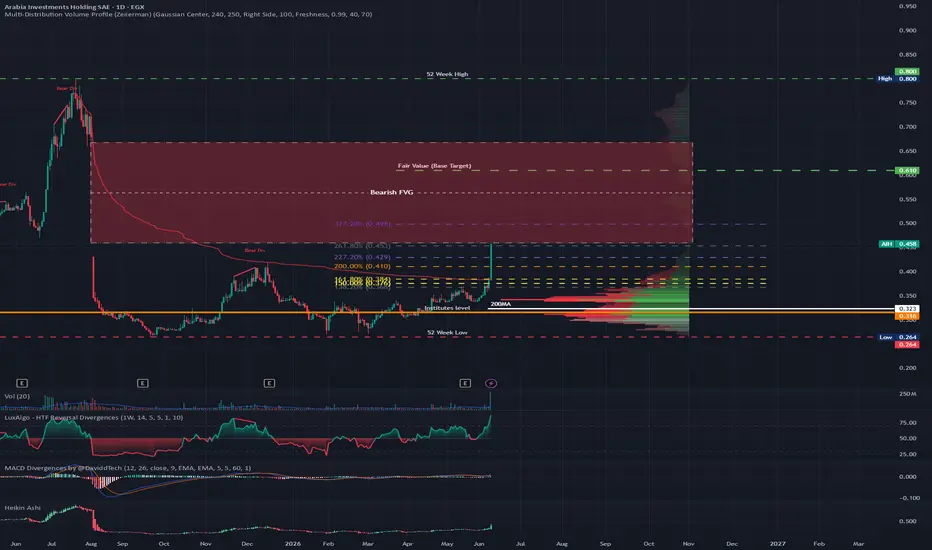
AIH: Navigating a Powerful Parabolic Wave๐ AIH: Navigating a Powerful Parabolic Wave ๐โก
๐ The Pulse:
I am updating the technical perspective for Arabia Investments Holding. ๐
The stock is riding an explosive, vertical parabolic wave. ๐ฅ
With this extreme momentum, it is impossible to predict exactly where the top will land. ๐
๐ฏ The Verdict
The vertical momentum is incredibly strong but highly sensitive. โณ
I recommend holding current positions but avoiding chasing fresh entries at these extended highs. ๐
---
If you like my insights