Long
Long
 Long
Long
 Long
Long
 Long
Long
Ismailia Misr Poultry (ISMA) - June 16, 2026🏛️ Ismailia Misr Poultry (ISMA)
🔬 Liquidity Mechanical Engineering, Mathematical Momentum Deconstruction, and Institutional Order Flow Governance
Date of Issue: June 16, 2026
Technical Liquidity Examination By: HOUTSOGHNEN - AHMED ABDELRAHIM
(Strategic Technical Analyst - Egyptian Stock Market)
📌 Vision Launch & Structural Declaration Document
Just as the "Market Maker" leaves an indelible digital footprint on the screens through monumental trading volumes that signal the birth of a new price era, this report stands as our professional signature in the financial community. We do not look at retail-level short-term fluctuations; instead, we apply an engineering scalpel to the asset's sovereign structure to deconstruct the panic and reformulate market concepts based on Smart Money Concepts and pure mechanical mathematics.
📈 I. Digital Inventory & Live Quantitative Data of a Historic Session
Today’s session witnessed a radical price expansion completely outside the scope of classic measurements, recording one of the most violent battles of behavioral engineering in the history of the Egyptian Stock Market. Here is the precise digital breakdown of the session:
Actual Closing Price: The stock stabilized by the end of trading at 30.15 EGP.
Nominal Daily Change: The stock recorded a minor decline of -0.23 EGP, equivalent to (-0.76%) compared to the previous close.
Opening Price: The session opened at 30.38 EGP.
Explosive Peak (High): Price advanced in an exposed vertical rally to strike the 36.45 EGP level, achieving a swift surge of +18.5% from its intra-session launch point of 30.72 EGP.
Deep Liquidity Low (Low): Price plunged under the weight of a sudden withdrawal of bids to strike 29.19 EGP, recording a rapid drop of -20% from the session's own peak.
Daily Trading Volume (Volume): This fierce battle unfolded under the fuel of immense volume reaching 4.73 Million shares on the daily timeframe, while the cumulative volume bar on the weekly timeframe recorded 6.72 Million shares. This volume officially represents the dominant institutional footprint (Institutional Volume Influx) that only a market maker can inject into the tape.
🧩 II. Mathematical Deconstruction of the Daily CMF Illusion & Intraday Liquidity Mechanics
The core engine to unlocking the cipher of this session lies in addressing the superficial reading of the Chaikin Money Flow (CMF) indicator on the daily timeframe, revealing how mathematical formulas can deceive the retail naked eye.
When calculating the structural Close Location Value (CLV) mathematically for today's candle based on the mechanical equation of money flow:
CLV = / (High - Low)
By applying the direct numerical values from the screen:
CLV = / (36.45 - 29.19)
CLV = (0.96 - 6.30) / 7.26 = -0.736
This sharp negative result for CLV proves with absolute mathematical evidence that the daily CMF stabilizing at -0.37 is not a result of an actual exit of institutional funds (Outflow). Rather, it is an inevitable mathematical artifact of the indicator's formula, which is heavily skewed by the price closing in the lower third of its candle following the temporary intraday withdrawal of institutional bids.
The absolute proof that entirely dispels the distribution hypothesis emerges when analyzing liquidity mechanics on smaller intraday timeframes at the exact moment the session’s lowest point was tested. Upon the price striking 29.19 EGP, the intraday CMF triggered immediate vertical buying surges, confirming deep passive accumulation on smaller timeframes the moment the low was swept.
🧠 Liquidity Governance Axiom
Had this rapid drop been a result of full institutional distribution, the market maker's tactic would have been a total withdrawal, leaving the price to collapse freely without any passive absorption of panic. However, the emergence of this vertical buying at the lows proves the existence of institutional Passive Buying / Limit Orders waiting in advance to swallow the panic-selling supply. A market maker never protects retail positions with institutional capital; they only protect their own average cost and strategic positions.
📐 III. Settling the Debate via the Sovereign Stochastic RSI Cipher
The technical validation that cuts through all doubt appears when placing the Stochastic RSI under a structural comparative lens between the daily and weekly timeframes, as precisely demonstrated by the live chart layouts:
The Daily Timeframe Deception: We observe on the daily timeframe that the Stochastic indicator plunged vertically in an exaggerated manner to enter the depths of extreme oversold territory, stabilizing at its absolute lows. This rapid plunge served as the psychological smokescreen used to induce retail panic and force them into selling at the exact bottom.
The Sovereign Weekly Timeframe: Looking at the bottom of the comprehensive weekly chart, we discover the grand truth that a market maker cannot fake. The weekly Stochastic lines reside with ironclad stability at the peak of bullish momentum zones at astronomical levels of 98.84 / 99.61. The weekly indicator moves in a solid horizontal structure at the absolute top without showing the slightest inclination to hook downward or trigger a single bearish crossover.
In terms of mechanical indicator behavior, what occurred was merely a deliberate intraday "Cooling Down" process of the daily indicator to cook a rapid bear trap, without disrupting the macro strategic structure or the sovereign weekly and monthly bullish momentum of the asset.
🏛️ IV. Engineering Reading of Comparative History (Macro Weekly Structural Analysis)
Looking at the integrated engineering layout of the stock spanning a quarter of a century (from 2001 to 2026) documented in the weekly chart, the current price movements are governed by three strategic visual pillars:
1. Structural Breakout
The price has demonstrated absolute success in breaking out of a violent macro accumulation range and piercing fierce historical resistance levels defined by the white horizontal line at 20.90 EGP. This level has officially flipped—via behavioral role reversal—from a historical supply zone into a long-term "Solid Structural Support". The price moving above this boundary mechanically means that the stock is revaluing itself in a free Markup Phase, completely detached from old historical congestion nightmares.
2. The Mathematics of Historical Discount & Revaluation Thesis
The chart brilliantly illustrates the sheer depth and scale of the major accumulation phase that extended from 2011 to 2019 (demarcated by the multi-year green box on the chart), in tandem with a historical decline that previously wiped out -84.00% of the asset's value.
This metric mathematically validates our thesis regarding the smart money's behavior:
Historically: At its 2011 peak, the stock was trading at the equivalent of $3.50 USD.
Currently: At today's close, the stock trades at the equivalent of a mere $0.60 USD (a real discount of 83% from its value in hard currency).
Institutions and heavy hands that engineered the breakout from the ascending channel (the yellow lines) and injected colossal cumulative volumes are not looking for a rapid nominal gain in local currency. They are moving to reclaim the fair dollar value of the asset, which mathematically translates over the long term into targets around 170 - 175 EGP.
3. Sovereign Liquidity Governance via the Chaikin Line
The stability of macro indicators aligns flawlessly with this strategic view; the weekly CMF line (plotted in distinctive fuchsia) prints a solid and stable positive reading in the upper territory at 0.28. This sovereign numerical consensus confirms that smart money remains fully embedded within the asset, showing no liquidation of core institutional positions.
⚖️ V. Behavioral Scene Engineering (The Three-Phase Shakeout Scenario)
Based on this mechanical deconstruction, the classic, superficial retail hypothesis classifying today's price action as a Blow-off Top completely collapses analytically. The true reality represents the most violent shakeout and psychological engineering process in the stock's history, executed with orchestral precision through three synchronized chapters:
The Trap Chapter: An exposed vertical markup to 36.45 EGP to trigger intense FOMO among retail traders.
The Panic Chapter: A sudden pulling of bids and a flash drop to 29.19 EGP to violently hunt and execute Stop Losses.
The Absorption Chapter: Immediate institutional swallowing of panicked supply at the session lows to protect institutional average costs.
Following these behavioral variables, the stock is expected to enter a phase of "Silent Supply Absorption" and tedious, crushing rotation ranging between the 30.00 and 31.00 EGP levels. This aims to exhaust what remains of margin traders and retail holders until supply completely vanishes, leaving the float entirely under the control of the market maker ahead of a structural markup to conquer the 36.45 - 36.51 EGP peak.
🧭 VI. Technical Governance Levels & Quantitative Tracking (The Action Matrix)
Risk management and smart money flow monitoring during the upcoming sessions will be strictly governed by tracking the following pivotal structural nodes derived from the calibrated chart:
The Resistance Line of Fire (36.45 - 36.51 EGP): The verified peak of the historic session (marked by the orange lightning bolt on the chart). A breakout and weekly close above this level officially signals price liberation into Blue Sky Territory.
The Absorption Zone (31.00 - 31.50 EGP): A congestion cluster of trapped retail supply; it demands flexible, grinding volume to completely dry out remaining sell orders.
The Central Pivot Node (30.39 EGP): The key to macro equilibrium; reclaiming this pivot and closing above it invalidates the distribution theory instantly and accelerates the bullish path. (Price is currently balanced slightly below it at 30.15 EGP).
The Institutional Line of Defense (29.19 EGP): The absolute low of the heavy hands and the ultimate structural invalidation point of the current setup. A clear daily close below this node is the only negative trigger that damages the current thesis.
Alternative Demand Zone (25.00 - 26.00 EGP): The technical target area for deep corrections and institutional re-entry, should the line of defense fail and macro weekly indicators deviate from their current bullish posture.
⚠️ Governance Disclaimer (English Disclaimer)
This analytical report represents an advanced mechanical and behavioral reading of price structures and smart money flows for comparative educational and technical documentation purposes. It does not contain, under any circumstances, a direct or indirect financial recommendation to buy or sell. Investment decisions remain the sole responsibility of the trader based on their own risk governance.
#ISMA #EGX #EGX30 #البورصة_المصرية #SmartMoneyConcepts #SMC #MarketStructure #OrderFlow #VolumeSpreadAnalysis #VSA #StrategicAnalysis #MacroStructure #TechnicalAnalysis #LiquidityEngineering #RiskGovernance  Long
Long
Al Tawfeek Leasing Company (A.T.LEASE) : Daily Chart OverviewAl Tawfeek Leasing Co (AT-LEASE - EGX) EGX:ATLC Daily Chart
Technical Chart Analysis
1. Price Action & Market Structure
The stock has undergone a significant structural shift over the analyzed period:
The Accumulation Phase (Late 2025 – Early 2026): For several months, the price consolidated within a gradual ascending channel, bounded by a lower support line and an upper blue resistance line.
The March Breakout : In March 2026, the stock experienced a massive volume-backed surge, breaking out of its historical consolidation range and peaking near the 5.75 level.
Current Symmetrical Triangle Structure : Following that peak, the stock entered a healthy correction and consolidation phase. It is currently forming a converging pattern bounded by a descending resistance trendline (green) and an ascending support trendline (brown).
2. Key Levels to Watch
Current Price: The stock closed at 5.20, marking a strong positive daily session (+5.69%).
Immediate Resistance: The stock recently tested 5.27 and is currently pressing directly against the descending green trendline. A clear daily close above this trendline signals a breakout from the consolidation triangle.
Pivot Line : Placed around 5.00. This acted as resistance in early March and is currently serving as a crucial psychological and structural anchor. Staying above this level maintains the short-term bullish bias.
Upside Targets : If the breakout is confirmed, the primary intermediate target sits at 5.75 (previous peak), with a secondary long-term technical target at 6.45.
3. Volume Analysis
The massive breakout in March was validated by exceptional volume columns (the highest on the chart), proving institutional interest.
During the subsequent April–June consolidation, volume significantly dried up. This behavior is classic and highly bullish; it indicates that selling pressure is exhausting, and weak hands have shaken out.
The recent uptick in price is accompanied by a noticeable bump in volume (3.87M vs. the 20-period average of 948.79K), indicating that buyers are stepping back in with force.
4. Technical Indicators
RSI (14) : Currently sitting at 59.92, rising sharply above its yellow signal line (50.47). This indicates expanding bullish momentum, with plenty of headroom remaining before reaching overbought territory ($>70$).
MACD (12, 26, 9) : The MACD line (blue) has crossed above the signal line (orange) right around the zero baseline, creating a fresh bullish crossover. The histogram is also flipping back to positive green bars, confirming a shift in momentum from bearish/neutral to bullish.
Summary
Trend : Short-term neutral-to-bullish within a larger, strong primary uptrend.
Current Action : The stock closed at 5.20 (+5.69%), heavily outperforming its recent average volume.
Key Triggers : A decisive break and hold above the 5.27 zone/green trendline will trigger a formal triangle breakout.
Key Support : The 5.00 pivot line and the brown ascending trendline act as the primary safety net for bulls.
Targets : 5.75 followed by 6.45 upon confirmed breakout fulfillment.
 Long
Long
Arab Ceramic Co. (Ceramica Rema) : Weekly Chart OverviewArab Ceramic Co. - Ceramica Remas EGX:CERA Weekly Chart
1. Price Action & Chart Patterns
The stock has transitioned from a long-term multi-year ascending channel into an aggressive markup phase, which is now consolidating into a well-defined classic continuation pattern.
The Main Pattern : The price action since the peak at 1.39 is forming a Symmetrical Triangle or a tightening Pennant (bounded by the blue descending resistance line and the red ascending/flat support line). This is developing right above the major green multi-month trendline.
Current Position : The last weekly candle closed at 1.18, pressing right against the blue descending resistance line. It is trading just below the minor local peak of 1.23.
2. Technical Indicators Breakdown
MACD (Moving Average Convergence Divergence)
The Setup : Inside the green box, the MACD line (blue) and Signal line (orange) are flattening out right around the zero line.
Implication : This signifies a complete loss of downward momentum. A bullish crossover here, especially near or slightly above the zero line, typically triggers a powerful momentum surge as the consolidation phase ends.
RSI (Relative Strength Index)
The Setup : While the price has been making lower highs since the 1.39 peak, the RSI (14) has formed a clear bullish divergence (indicated by the solid green support line on the RSI panel).
Implication : The RSI is making higher lows while climbing back above its yellow signal line (currently at 54.98). This indicates that underlying buying pressure is quietly building up despite the sideways price movement.
3. Potential Scenarios & Key Targets
There are two pathways based on how the price handles the current breakout zone:
#1 ____ Bullish Scenario (Breakout)
Trigger: A strong weekly close above the blue resistance line and the 1.23 local high, ideally backed by a pickup in volume.
First Target : 1.39 (The previous major structural high).
Pattern Target : 1.56 (Projected by the green dotted arrow, matching the depth of the initial thrust/triangle base).
#2 ____ Bearish Scenario (Rejection)
Trigger: Failure to clear 1.23, followed by a breakdown below the red lower boundary of the triangle.
Downside Target: 0.93 (Projected by the red dotted arrow). This would retest the upper boundary of the multi-year dashed orange ascending channel and the major psychological 1.00 support level.
__ Summary Strategy __
The setup is highly coiled. The bullish RSI divergence and the MACD flattening at the zero line heavily favor an upside resolution.
The safest execution relies on waiting for a confirmed breakout above 1.23 to trigger the move toward 1.39 and 1.56, keeping a tight stop invalidation just below the red support line (around 1.05–1.08).  Long
Long
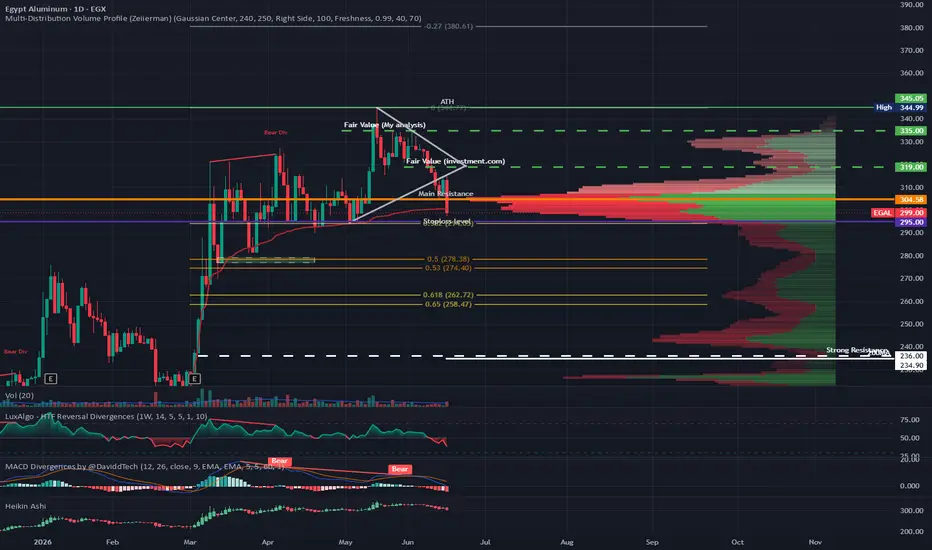
EGAL: From ATH Reversal To 295 Line In The Sand📊 EGAL: From ATH Reversal To 295 Line In The Sand ⚠️📉
🔍 The Pulse
EGAL reversed from its 350 ATH into a correction, breaking a triangle pattern to the downside, failing the retest, and now losing main support on high volume.
Price action is shifting from distribution to a confirmed bearish phase unless 295 is defended this week.
🧱 The Key Structural Boundaries
📈 All-Time High – 350: The recent 350 ATH marks the top of the prior impulsive leg and the start of the current correction phase.
📉 Key Support / Fib 38.2% / Stop Zone – 295: A break of the 295 area, aligned with the 38.2% Fibonacci level, is the final confirmation of a new downtrend and the logical stop loss for remaining longs.
🎯 Triangle Breakdown Target / Fib 61.8% – 262: The measured move from the triangle points toward the 262 zone, near the 61.8% Fibonacci level, as the primary downside target.
🎯 The Verdict
Treat 295 as the hard invalidation level: a weekly break and hold below it signals a confirmed downtrend with downside potential toward 262.
Longs should respect stops at 295, while only disciplined, trend-aligned traders may look for short opportunities targeting the 262 area.
If you like my insights, follow and boost! 🙌💙🚀
🎁 $15 TradingView Discount:
🔗 www.tradingview.com  Short
Short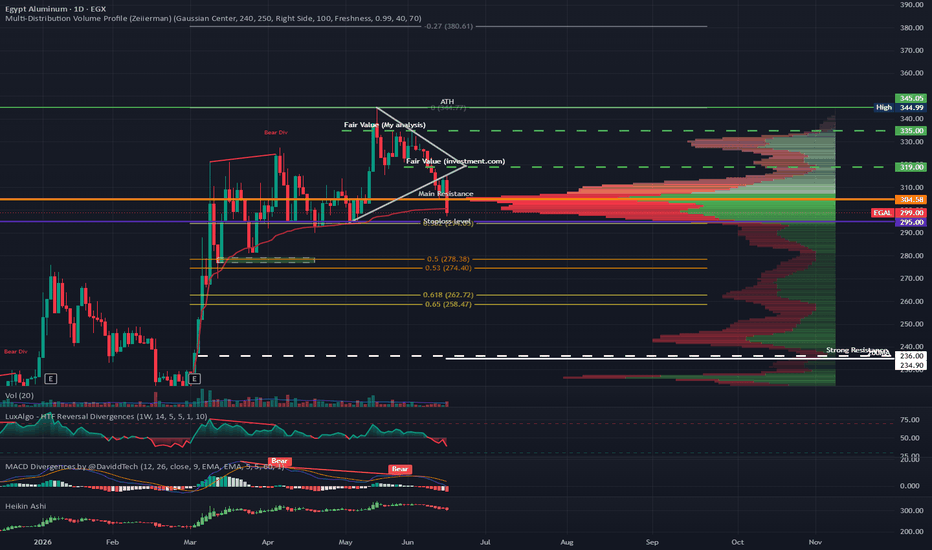
 Long
Long
 Long
Long
Kima, EGX : 30-min Chart OverviewEGX:EGCH 30-min Chart
1. Pattern & Price Action Analysis
Major Ascending Channel Context: The stock is trading within a broad, long-term ascending channel bounded by the upper blue resistance line and the lower red support line.
Critical Support Test: Following a corrective decline from its 15.4 EGP and 15.0 EGP peaks, the price has collapsed back to a key mid-channel dashed orange support line. It recently printed a minor local low at 12.9 EGP and is currently trading at 13.10 EGP.
Make-or-Break Pivot: This orange dashed line is the critical inflection point. A firm bounce here sets up a recovery, while a failure to hold exposes a drop to the major channel floor.
2. Indicators & Momentum
RSI (14): Currently deep in oversold territory at 28.09. This indicates extreme selling pressure in the short term, but historically leaves the stock highly ripe for a technical oversold bounce or relief rally.
MACD (12, 26, 9): The MACD lines are currently extended well below the zero line with a bearish posture. No bullish crossover has formed yet on this 30-minute timeframe, meaning aggressive buyers are trying to catch a falling knife before momentum officially shifts.
🎯 Trading Scenarios & Plan
Because the stock is sitting directly on an intermediate pivot line, the setup offers two clear structural pathways:
Scenario A: The Oversold Bounce (Bullish Path)
Trigger : Confirmed price stability above 12.9 - 13.10 EGP accompanied by an RSI curling back above 30.
Target : 14.3 EGP (Testing the upper blue channel resistance line).
Stop Loss : A clean break below 12.8 EGP.
Scenario B: Channel Floor Reset (Bearish Path)
Trigger : A breakdown below the 12.9 EGP support level.
Downside Target : 11.8 EGP - 11.9 EGP, aligning perfectly with the primary long-term red support line where a much safer, high-probability long entry can be established.  Long
Long
 Long
Long
 Long
Long
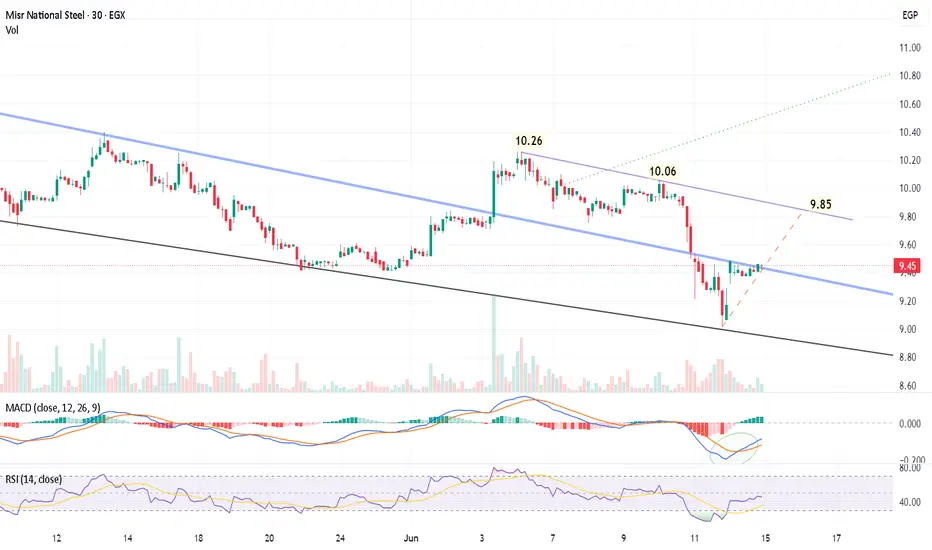
ATQA - EGX : 30-min Chart OverviewEGX:ATQA 30-min Chart
📈 Executive Summary
The 30-minute chart in ATQA_2026-06-14_21-21-41.png shows ATQA trading at 9.45 EGP (down slightly by $-0.11\%$). Following a sharp downward flush down to the $9.00$ psychological support area on June 11th–12th, the stock has printed a sharp V-shaped recovery. ATQA is currently compressing at a critical inflection point where the immediate recovery path meets a major long-term descending resistance line (blue line). A breakout here confirms a shift in structural control from sellers to buyers.
🔍 Technical Indicators Breakdown
1. Price Action & Pattern Geometry
• The Descending Channel Floor & Ceiling: The multi-week price action is bounded by a prominent macro descending blue resistance line and a lower black support line. The recent flush briefly undercut the inner structures but found a firm floor near the black multi-week support trendline (~9.00 EGP).
• The Lower Highs Resistance Line (Purple): Connecting the peaks of 10.26 EGP and 10.06 EGP, this secondary trendline acts as a rolling overhead supply line, currently projecting a major resistance hurdle near 9.85 EGP.
• The Recovery Vector (Orange Dashed Line): A steep, short-term ascending trajectory has formed directly off the 9.00 EGP low, guiding the immediate recovery back up to test the primary blue resistance line at 9.45 EGP.
2. Volume Analysis
• The volume during the recent June 11th drop was relatively contained, indicating that the drop was an exhaustion flush rather than systemic institutional distribution.
• The recovery back to 9.45 EGP has seen steady, stable volume blocks (currently at 214.54K on the latest bars), demonstrating steady absorption of overhead supply by buyers.
3. Momentum Oscillators
• MACD (12, 26, 9): A highly bullish development is visible here. The MACD line (blue) has formed a clear, deep bullish crossover above the signal line (orange) in deep negative territory (highlighted by the green circle). The histogram has flipped to solid green and is rising, signaling powerful underlying bullish divergence and an incoming wave of positive momentum.
• RSI (14): Having deeply reset into the oversold territory (sub-30) during the June 11th flush, the RSI has recovered beautifully to 45.62 and crossed back above its moving average (35.19). This indicates that the asset has fully shaken out weak hands and has extensive room to run upward before hitting overbought constraints.
🎯 Trading Strategy & Key Levels
The chart highlights a projected path targeting a breakout toward the near-term resistance clusters.
Level Type Price Target (EGP) Technical Significance
Immediate Support 9.43 - 9.45 Current price consolidation zone and intersection of the short-term orange recovery vector.
Major Support Floor 9.00 The recent absolute low and macro black trendline support. Critical stop-loss invalidation area.
Immediate Target 9.85 The intersection of the secondary purple trendline connecting previous lower highs.
Macro Target Range 10.26 - 10.60 Prior structural peak and the extension of the macro green dotted breakout vector.
Actionable Insights:
• Aggressive Setup : Entries at the current market price of 9.45 EGP present a highly asymmetrical risk-to-reward ratio. A clean breakout above the immediate blue trendline can quickly trigger an algorithmic pop toward the 9.85 EGP target. Keep a tight stop close underneath the 9.30 structural shelf.
• Conservative Setup : Wait for a firm candle close above the blue resistance line to confirm the macro shift, then look to accumulate positions on the retest, mapping out an extension path following the green dotted trendline toward 10.26 EGP and beyond.
 Long
Long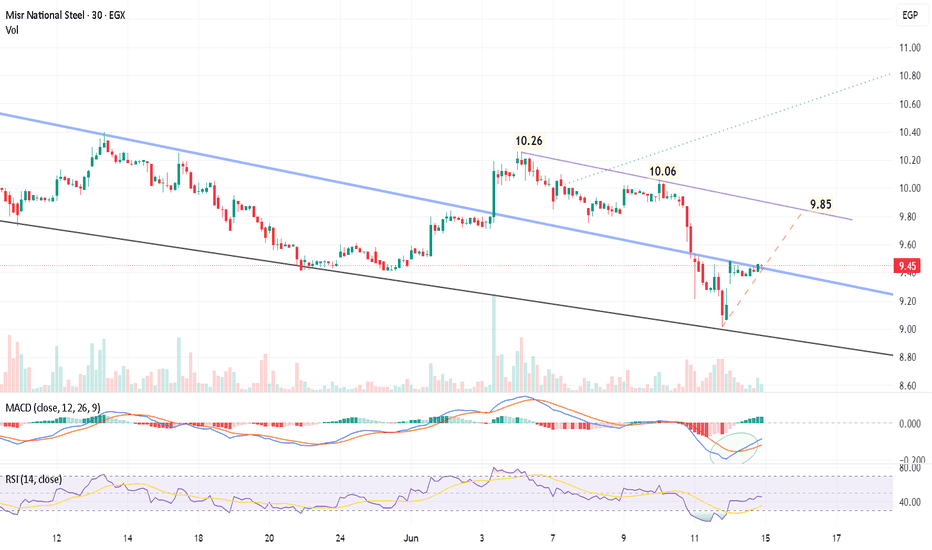
ASPI - EGX : 30-min Chart OverviewEGX:ASPI 30-min chart
📈 Executive Summary
The chart ASPI_2026-06-14_21-07-48.png captures ASPI on a 30-minute timeframe following a massive, high-volume bullish rally in early June. After peaking near 0.390, the stock entered a healthy, descending corrective phase. Currently, ASPI is compressing into a classic Falling Wedge/Pennant structure, trading at 0.319 EGP (down slightly by −0.93% during the session). The price action is compressing right at a vital crossroads between a localized dynamic support line and a long-term structural resistance ceiling.
🔍 Technical Indicators Breakdown
1. Price Action & Trendlines
The Resistance Line (خط المقاومة): A well-defined descending trendline connects the local lower highs from June 4th through June 14th. This line is acting as a major supply barrier, currently capping upside momentum near the 0.360−0.370 zone.
The Support Line (خط الدعم): A localized ascending trendline has formed over the last two trading sessions. The stock has successfully printed higher lows along this line, proving that buyers are actively stepping in to defend the 0.315−0.318 range.
2. Volume Analysis
The massive breakout on June 3rd–4th was backed by explosive volume (peaking over 15.25M), confirming institutional/strong-hand entry.
Crucially, the entire descent from June 4th onward has occurred on significantly diminishing volume. This indicates a lack of aggressive selling pressure—a classic sign of healthy profit-taking and consolidation rather than a trend reversal.
3. Momentum Oscillators
MACD (12, 26, 9): The MACD line (blue) has flattened out and crossed back above the signal line (orange) below the zero-bound. The histogram is flashing light green, signaling that bearish momentum has completely dried up and a positive convergence is quietly underway.
RSI (14): Sitting comfortably at 43.36 (with its moving average at 37.30). The RSI has reset beautifully out of the overbought territory from earlier in the month and is now curving upward, leaving plenty of runway for a strong bullish continuation without being restricted by immediate overbought conditions.
🎯 Trading Strategy & Key Levels
The chart highlights a green directional arrow pointing upward toward the descending resistance line, signaling an anticipated technical bounce.
Level Type Price Target (EGP) Technical Significance
Immediate Support 0.315 - 0.318 Local trendline support (خط الدعم); must hold to maintain the short-term bullish structure.
Major Structural Support 0.290 Historical horizontal support floor (blue line). Strong accumulation zone.
Immediate Target (Breakout) 0.360 - 0.375 The intersection of the descending resistance trendline (خط المقاومة).
Major Target Range 0.450 - 0.455 Golden target zone highlighted on the top right of your template.
------ Actionable Insights:
Aggressive Entry : Current levels (~0.319 EGP) offer an attractive risk-to-reward ratio, leveraging the immediate ascending support line. A protective stop-loss should be placed just below 0.315 EGP or 0.290 EGP, depending on your risk tolerance.
Conservative Entry : Wait for a decisive, high-volume 30-minute candle close above the blue descending resistance line (خط المقاومة) at around 0.365 EGP to confirm a structural breakout before targeting the macro 0.450 - 0.455 EGP zone.  Long
Long
 Long
Long
 Long
Long
 Long
Long