• Products
  • Community
  • Markets
  • Brokers
  • More
Get started
  • Markets
  • /Malaysia
  • /Stocks
  • /Ideas
FEYTECH - LOOKING FOR BULLISH SENTIMENTFeytech is developing a bullish N-wave recovery structure from July low around RM0.195, with the current price at RM0.250. The key issue now is whether price can decisively clear the RM0.260–RM0.265 resistance zone. The pattern becomes significantly more bullish once RM0.260–RM0.265 is broken with volume. The Ichimoku setup is improving, but not yet a fully confirmed breakout. Price is currently around RM0.250, while the important overhead resistance is approximately RM0.260–RM0.265. The most important confirmation would be: Daily close > RM0.260/RM0.265 + strong volume That would indicate that price has escaped the recent consolidation and is attempting to establish a new bullish leg. The cloud around the current price also makes RM0.24–RM0.25 an important near-term equilibrium/support area. Bias: BULLISH, but waiting for breakout confirmation The critical price is RM0.260–RM0.265. Above RM0.265: bullish breakout → target RM0.290 → RM0.295 → RM0.325 RM0.245–RM0.250 holds: accumulation/consolidation remains constructive. Below RM0.240: momentum becomes questionable. Below RM0.220: N-wave bullish structure is substantially weakened/invalidated. Trading plan Entry: RM0.250–0.255, or preferably breakout > RM0.265 SL: RM0.240 TP1: RM0.265 TP2: RM0.290 TP3: RM0.295 TP4: RM0.325 Notes: 1. Analysis for educational purpose only. 2. Trade at your own risk.
MYX:FEYTECHLong
by mg6112
Updated
sideaway will no sideaway foreverthe thing that market always do is sideaway..but how long sideaway can hold? there will be time, market need to break the sideaway
MYX:CTOSLong
by ExperTrader21
need retracement upneed retracement up. every down movement, price need to make retracement. tayor. this is for education purpose. not buycall.
MYX:TALIWRKLong
by ExperTrader21
need retracement upprice cant go down straight, need retracement up. every market movement need retracement. tayor.
MYX:TALIWRKLong
by ExperTrader21
need retracement upprice cant go down straight, need retracement up. every market movement need retracement. tayor.
MYX:GESHENLong
by ExperTrader21
every movement need retracementprice cant go down straight, need retracement up. every market movement need retracement. tayor.
MYX:HILong
by ExperTrader21
every down movement need retracementprice cant go down straight, need retracement up. every market movement need retracement. tayor.
MYX:AEONLong
by ExperTrader21
Price need to retrace upevery downtrend movement, price still need to retrace up.. its basic movement in the market
MYX:SPSETIALong
by ExperTrader21
discount is over? time to climbThe price has started showing upward strength following a decline. The low price represents a discounted level for us to buy.
MYX:KENANGALong
by ExperTrader21
CPE Technology BhdPullback Entry - Buy on a limit order or bullish reversal candle near the MYR 1.10 - 1.12 support area. - Confirmation: Low volume on the retracement to signal a lack of selling pressure, followed by a high-volume reversal bar. - Target: MYR 1.28 (First resistance/take-profit tier). Entry Price: MYR 1.12 Stop-Loss: MYR 1.05 Price Target: MYR 1.28 Risk / Share: MYR 0.07 Reward / Share: MYR 0.16 Risk-to-Reward Ratio = 1 : 2.28
MYX:CPETECHLong
by FikriSooudin2
DNEX: Catching the Breath Before Wave 5?Quick 4H structure read on DNEX Strong push up through Waves (1) and (3), now pausing in Wave (4), normal after two strong legs. A clean Wave (4) means clear risk, so the stop loss can sit tight below this structure. By wave equality, Wave (5) may move up to match the length of Wave (3), and this count stays valid as long as price holds above the Wave (1) high and if price closes below that, the count is dead. Not financial advice, just my read of the chart.
MYX:DNEXLong
by MuhammadSyakirin
KRONO1. Strong breakout from the RM0.10-RM0.12 consolidation zone. 2. Large volume expansion during the breakout, indicating genuine buying interest rather than a low-volume spike. 3. Price is trading above the Ichimoku cloud, suggesting the medium-term trend has turned bullish. 4. Cloud projection ahead is turning positive, supporting continuation if momentum remains intact. 5. Current price (RM0.14) remains above the key breakout area around RM0.12-RM0.13. The breakout volume and move above the Ichimoku cloud suggest institutional participation. However, the stock is currently pulling back after a sharp run, so chasing at RM0.14 carries a less favorable risk-reward than waiting near RM0.12-RM0.13. Suggested Strategy Buy: RM0.120-RM0.130 Stop Loss: RM0.100 Take Profit: RM0.170, RM0.190, RM0.220 Risk-Reward: Up to 3:1 toward TP2-TP3 Patience for a retracement into the entry zones marked on the chart would provide the highest probability trade. Notes: 1. Analysis for educational purposes only. 2. Trade at your own risk.
MYX:KRONOLong
by mg6112
GFM - Potential bullish sentimentN wave with E, N & NT projection. The overall structure appears constructive but still at a decision point. The stock has recently broken out of a longer-term descending resistance and is now forming a bullish ascending channel. The important observation is that price has already recovered strongly from the RM0.155–0.160 region and is now consolidating around RM0.180, just below the first significant resistance at RM0.185. A decisive breakout above RM0.185 (NT level) would be technically positive, particularly if accompanied by increasing volume. The price should ideally close above RM0.185 rather than merely touching it intraday. RM0.185 is therefore the immediate breakout trigger. If GFM successfully breaks RM0.185 and establishes support above it, the probability of a move toward RM0.200 improves significantly. Support Zones RM0.175–0.180 — Immediate support This is the first area I would monitor. The price is currently hovering around this zone. A successful hold here keeps the short-term bullish setup intact. RM0.170 — Key technical support This is more important. A break below RM0.170 would weaken the current bullish structure and could indicate that the recent rebound is losing momentum. RM0.155–0.160 — Major structural support This is the A-wave/base region. A decline back into this area would significantly damage the bullish N-wave setup. Resistance Zones RM0.185 — Immediate resistance / NT target First breakout level. RM0.190 — Major breakout confirmation zone The chart shows RM0.190 as a significant horizontal resistance area. A close above this level would provide stronger confirmation of bullish continuation. RM0.200 — N target Main target and psychological resistance. RM0.215 — E target Extended target. From the chart, the price appears to be interacting with the Ichimoku cloud and has recovered from below the cloud region. The setup is improving because: Price has recovered from the lower base. The recent rebound created a higher low around RM0.170. The price is approaching the RM0.185–0.190 resistance band. The broader rising blue trendline provides a potential dynamic support structure. However, a clean breakout with volume before considering the N-wave fully confirmed. The biggest technical risk is a false breakout around RM0.185–0.190, followed by a drop below RM0.175. Entry Strategies: Aggressive Entry: Enter near the current price of 0.180, anticipating the continuation of the wave. This offers a better risk-to-reward ratio but carries the risk of rejection at the 0.190 resistance. Conservative Entry: Wait for a confirmed daily close above the major resistance at 0.190 with above-average volume. This confirms the N-wave is fully in motion toward the higher targets. Stop Loss (SL): Strict SL: 0.165. Place the stop loss just below the Wave (C) pivot low and the lower ascending blue trendline. If the price drops below this level, it prints a lower low, completely invalidating the bullish N-wave thesis. Notes: 1. Analysis for education purpose only. 2. Trade at your own risk.
MYX:GFMLong
by mg6112
Updated
MRCB: Upcoming project Entry: 0.290 and above SL: 0.280 and below If price go down beyond 0.280, then we shall wait until the trend change from downtrend to uptrend. One of the best chart for year end 2026 until early 2027 #TAYOR
MYX:MRCB
by RAR-BSJ
VANTRIS Entry: 0.290 - 0.30 SL: 0.285 and below If price go down beyond 0.285, then we shall wait until the trend change from downtrend to uptrend. Good luck #TAYOR
MYX:VANTNRG
by RAR-BSJ
MNHolding performing Ascending triangle and breakout expectedPattern components visible Flat resistance: The horizontal red line around 2.95–3.00 has been tested multiple times on the right side of the chart, with candles compressing just under it rather than breaking through cleanly. Rising support: The yellow trendline connecting the higher lows continues to slope upward, converging toward that flat resistance — classic ascending triangle geometry (higher lows + flat highs). Apex forming: Price is getting squeezed into a tightening range, which is consistent with the pattern nearing resolution. Supporting signals Price remains above both the 50 EMA (red) and 200 EMA (blue), so the broader structure still favors bulls — ascending triangles are typically continuation patterns in an uptrend, which fits here. RSI sitting around 50–55, neutral-to-mild-bullish, gives room to run higher without being overbought if a breakout occurs. What's missing for confirmation Volume is the weak link right now — it's contracted noticeably during this consolidation phase. A textbook ascending triangle breakout ideally comes with a volume surge on the breakout candle; without that, a "breakout" can be more prone to failing or faking out (a false break followed by a pullback into the range). The pattern isn't confirmed until price actually closes convincingly above the 2.95–3.00 resistance — right now it's still forming, not resolved. If it plays out as a textbook breakout Measured move target is typically the height of the triangle's base added to the breakout point. Eyeballing the base (roughly from ~1.60–1.70 up to ~2.95), that's a fairly large projected move if it triggers — but wider/lower-probability the taller the base, so treat that math as illustrative, not a forecast. Failure case: a false breakout or rejection at resistance would likely see price fall back toward the rising trendline (~2.60–2.70 currently) or the 50 EMA as next support. So the pattern is real and the setup is textbook-shaped, but the low volume into resistance is the flag that would make me want to see a strong-volume close above 2.95–3.00 before treating a breakout as confirmed rather than assumed.
MYX:MNHLDGLong
by chongchanyau
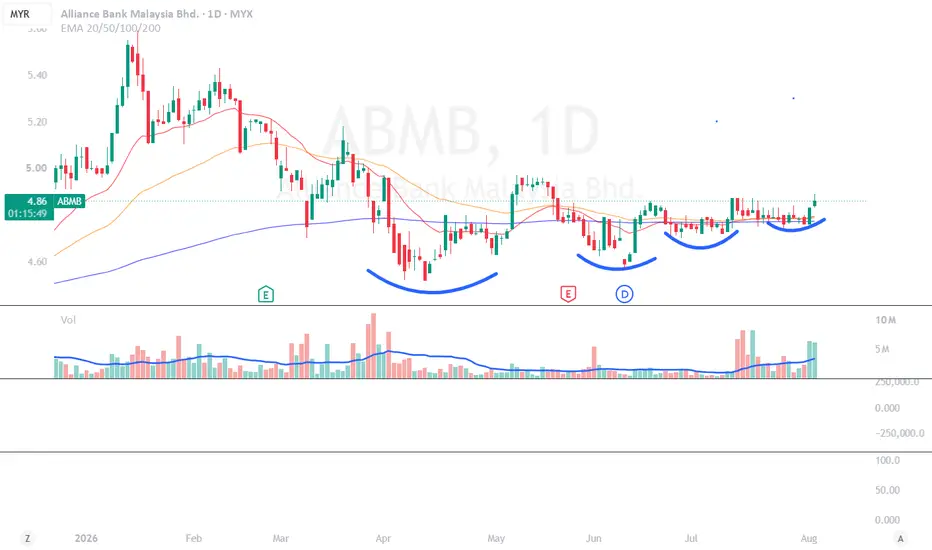
ABMB VCP PatternMYX:ABMB VCP Pattern Keep forming high low Time to enter?
MYX:ABMBLong
by SuperTrader_K
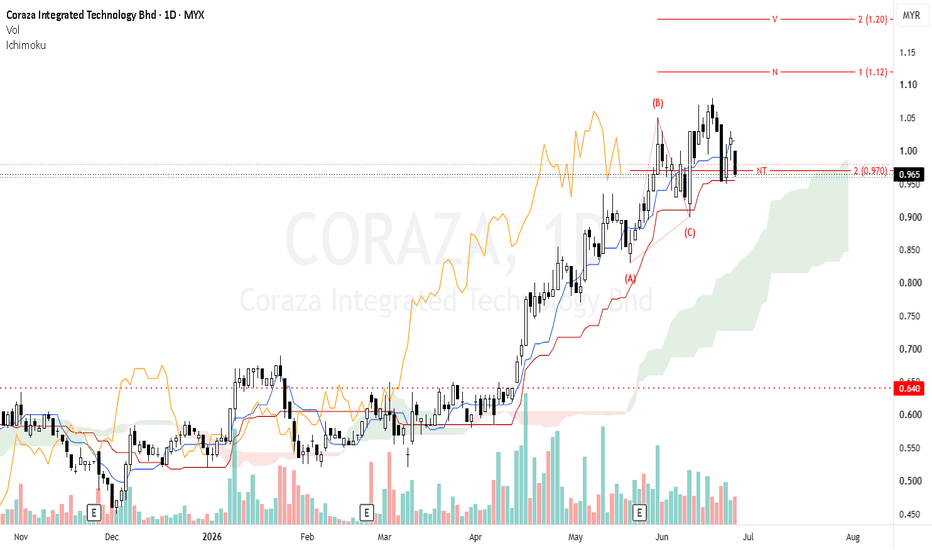
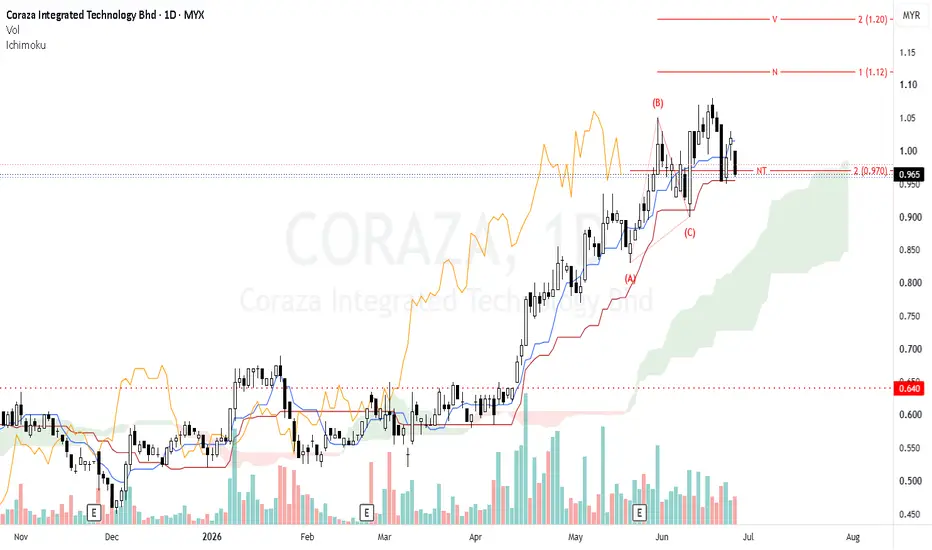
CORAZA - BULLISH CONTINUATIONThe medium-term trend remains bullish, although the stock is currently undergoing a healthy pullback after failing to sustain above the psychological RM1.00 level. Price remains above the Kumo, indicating the primary trend is still bullish. Kijun-sen as immmediate support. Price to stay above NT level to confirm the bullish sentiment. RM1.00 psychological resistance RM1.05–1.07 (recent swing high) string resistance. Recent candles show rejection from the highs around RM1.05–1.07, suggesting profit-taking. Conditions: Price successfully defends RM0.97. Bullish reversal forms with stronger buying volume. Break above RM1.00 followed by RM1.05. Targets: Target 1: RM1.05 Target 2: RM1.12 (N Projection) Target 3: RM1.20 (V Projection) CORAZA remains in a medium-term bullish trend, with the current weakness appearing to be a corrective pullback toward the NT projection at RM0.97, a key support level. Holding above this level would preserve the bullish structure and offer an attractive risk-to-reward setup for a continuation move. A rebound from RM0.97 followed by a breakout above RM1.05 would increase the probability of reaching the N projection at RM1.12, with the V projection at RM1.20 serving as the extended upside target. Traders should monitor price action and volume closely around RM0.97, as a decisive break below this support would shift the outlook toward a deeper correction into the RM0.90–0.86 region. Notes: 1. Analysis for education purpose only. 2. Trade at your own risk.
MYX:CORAZALong
by mg6112
Updated
11
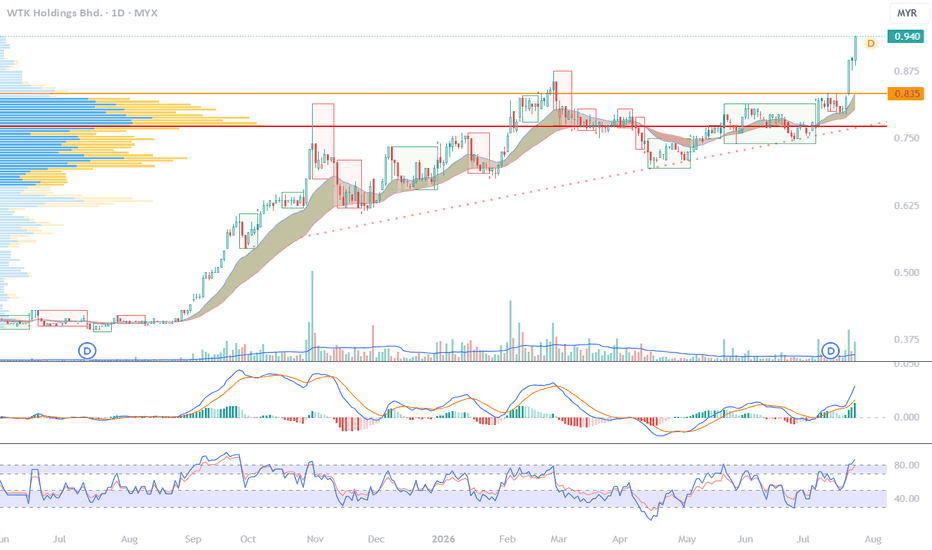
WTK breakout sustainable?MYX:WTK Price chart looks solid breakout after consolidate. Fundamental change convert from wood business to oil palm. Expected stable and consistent revenue in palm oil business, can support for share price keep moving north.
MYX:WTKLong
by Tsunami_Wave_rider
ECOSHOP (30th week, 2026)ECOSHOP (30th week, 2026)23/7/2026 - Volume will reduce in forming handle - price will break the handle trendline with volumes. - to monitor and to enter at RM1.545 if the breakout with volumes (3% abv rim of RM1.50)
MYX:ECOSHOP
by FikriSooudin2
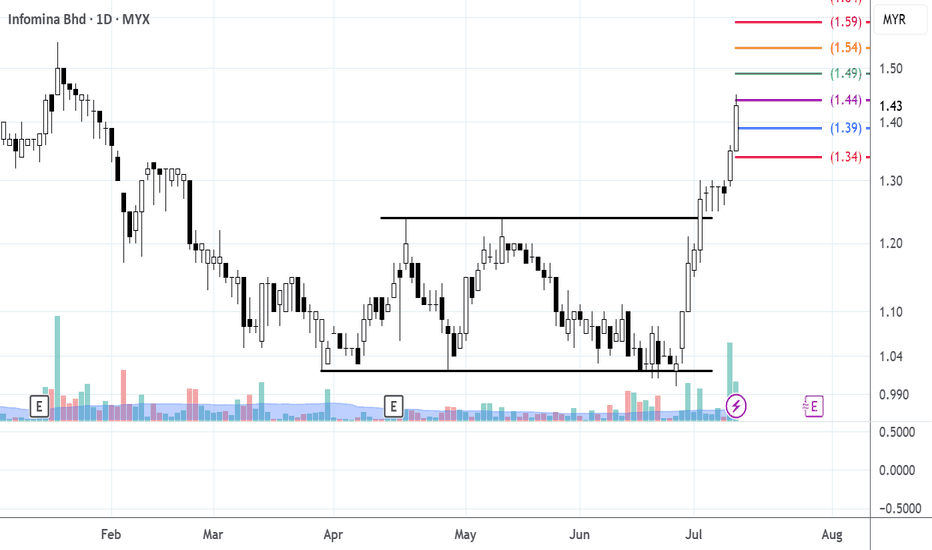
BREAKOUTStrong setup confirmed with BO above 4%, ER above 0.3, volume expansion above 2×, and ADR at 5.03%, indicating good momentum and trading potential.
MYX:INFOMLong
by yttrium7
Updated
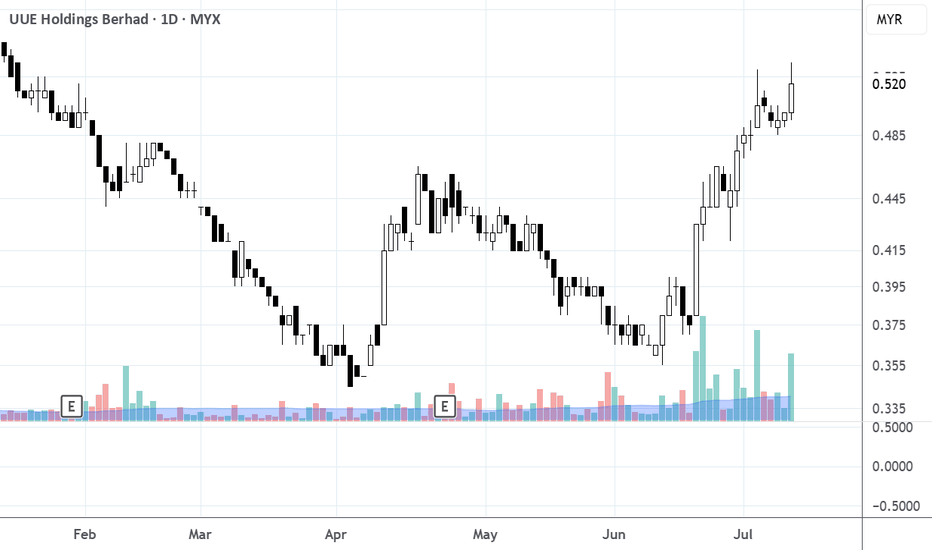
BREAKOUTStrong setup confirmed with BO above 4%, ER above 0.3, volume expansion above 2×, and ADR at 5.87%, indicating good momentum and trading potential.
MYX:UUELong
by yttrium7
Updated
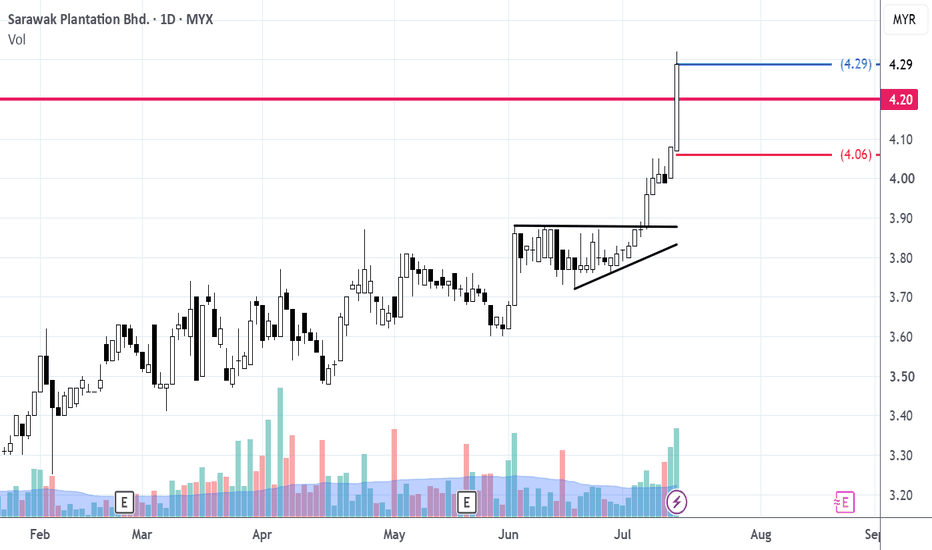
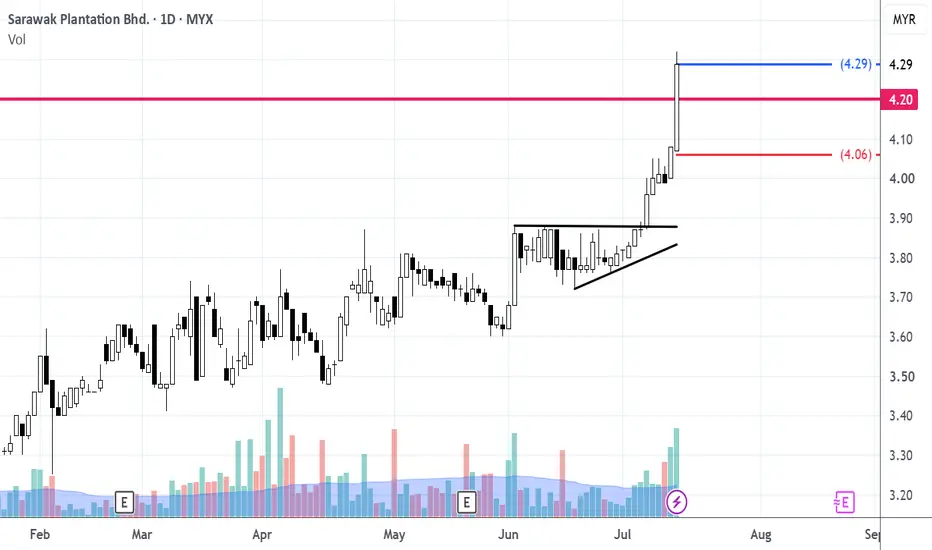
ATH BREAKOUTMeet all the Momentum Burst criteria except for the ATR requirement — it needs to be >3%, but this one is only 1.92%. Also, it may already be extended since the ATR extension has reached 7%. The consolidation before the breakout is not very clear either, so it might not qualify as a proper Momentum Burst setup. I would classify this more as an ATH breakout setup rather than a Momentum Burst setup.
MYX:SWKPLNTLong
by yttrium7
112233445566778899101011111212131314141515161617171818191920202121222223232424252526262727282829293030313132323333343435353636373738383939404041414242
…999999

Made by humans

Select market data provided by ICE Data Services. Select reference data provided by FactSet. Copyright © 2026 FactSet Research Systems Inc.Copyright © 2026, American Bankers Association. CUSIP Database provided by FactSet Research Systems Inc. All rights reserved. SEC filings and other documents provided by Quartr.© 2026 TradingView, Inc.

More than a product
  • Supercharts
Screeners
  • Stocks
  • ETFs
  • Bonds
  • Crypto coins
  • CEX pairs
  • DEX pairs
  • Pine
Heatmaps
  • Stocks
  • ETFs
  • Crypto coins
Calendars
  • Economic
  • Earnings
  • Dividends
  • IPOs
More products
  • Portfolios
  • Fundamental Graphs
  • Yield Curves
  • Options
  • Macro Maps
  • Pine Script®
  • MCP Server
Apps
  • Mobile
  • Desktop
Community
  • Social network
  • Wall of Love
  • Refer a friend
  • Creator program
  • House Rules
  • Moderators
Ideas
  • Trading
  • Education
  • Editors' picks
Pine Script
  • Indicators & strategies
  • Wizards
  • Freelancers
  • Marketplace
Tools & subscriptions
  • Features
  • Pricing
  • Market data
  • Gift plans
Trading
  • Overview
  • Brokers
  • Brokers comparison
  • The Leap
Special offers
  • CME Group futures
  • Eurex futures
  • US stocks bundle
About company
  • Who we are
  • Space mission
  • Blog
  • Help Center
  • Careers
  • Media kit
Merch
  • TradingView store
  • Tarot cards for traders
  • The C63 TradeTime
Policies & security
  • Terms of Use
  • Disclaimer
  • Privacy Policy
  • Cookies Policy
  • Accessibility Statement
  • Security tips
  • Bug Bounty program
  • Status page
Business solutions
  • Widgets
  • Charting libraries
  • Lightweight Charts™
  • Advanced Charts
  • Trading Platform
Growth opportunities
  • Advertising
  • Brokerage integration
  • Partner program
  • Education program
Community
  • Social network
  • Wall of Love
  • Refer a friend
  • Creator program
  • House Rules
  • Moderators
Ideas
  • Trading
  • Education
  • Editors' picks
Pine Script
  • Indicators & strategies
  • Wizards
  • Freelancers
  • Marketplace
Business solutions
  • Widgets
  • Charting libraries
  • Lightweight Charts™
  • Advanced Charts
  • Trading Platform
Growth opportunities
  • Advertising
  • Brokerage integration
  • Partner program
  • Education program
Look FirstLook First