Long
Long
AGX GROUP BERHADAGX GROUP BERHAD
Trend: The stock has shown a strong upward trend recently, with a significant price increase from late July to early August.
Support and Resistance: The current price seems to be encountering resistance around the 0.545 level (marked as "High" on the chart). Support levels could be around 0.480-0.500, based on recent price action.
Moving Averages: Two moving averages are visible on the chart. The shorter-term MA (likely 20-day) has recently crossed above the longer-term MA (possibly 50-day), which is typically a bullish signal.
Volume: There's been a notable increase in trading volume accompanying the recent price surge, indicating strong buying interest.
Volatility: The stock has experienced increased volatility in recent days, with larger price swings and longer candlesticks.
Candlestick Patterns: The most recent candle shows a bearish pattern, possibly indicating a short-term pullback or consolidation.
Momentum: Despite the recent pullback, the overall momentum appears bullish based on the steepness of the recent uptrend.
Bollinger Bands: While not explicitly shown, the recent price action suggests the stock may have been trading above its upper Bollinger Band, indicating overbought conditions.
Overall, the stock shows a strong bullish trend but may be due for a short-term pullback or consolidation. Traders should watch for support levels holding and potential continuation of the uptrend, while also being cautious of potential reversals given the rapid recent gains.  Long
Long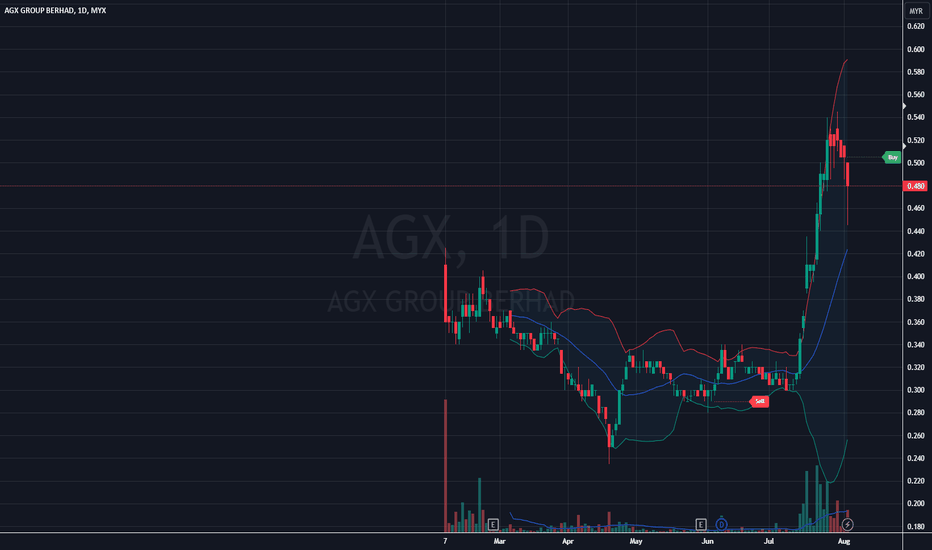
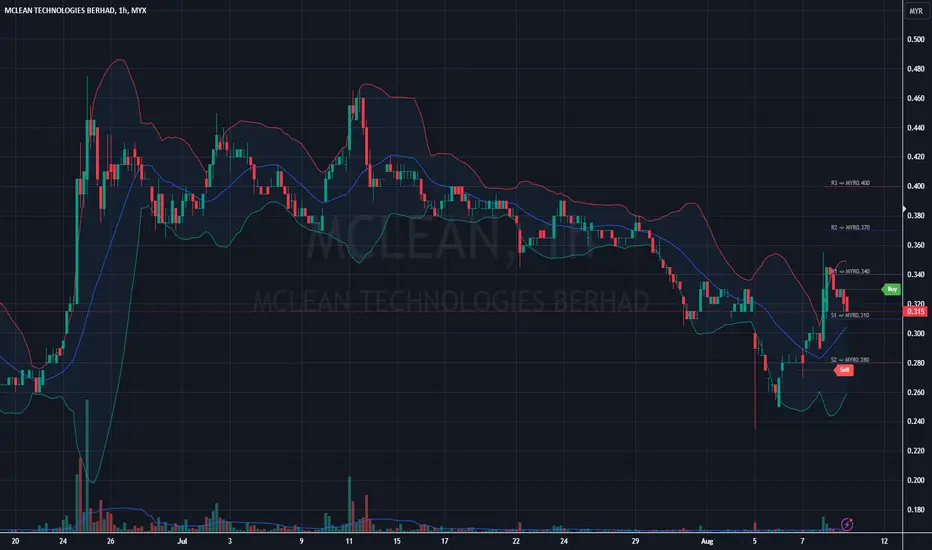
MCLEAN TECHNOLOGIES BERHAD - [MCLEAN]Mclean Technologies Berhad
Trend : The overall trend appears bearish in the medium term. The price has been making lower highs and lower lows since mid-July.
Support and Resistance :
###Key support level around 0.235-0.240 MYR
###Resistance levels at around 0.360 MYR and 0.420 MYR
Moving Averages : The stock is trading below both the short-term (likely 20-day) and long-term (likely 50-day) moving averages, indicating bearish sentiment.
Volume : There are sporadic volume spikes, particularly noticeable in late July and early August, which could indicate increased interest or significant events.
Price Action : The stock has shown high volatility, with sharp drops followed by quick rebounds. Most recently, there was a significant drop to the support level around 0.235 MYR, followed by a sharp rebound.
Bollinger Bands : The price has been touching the lower Bollinger Band frequently, suggesting oversold conditions at times.
Recent Movement : There's been a recent upward movement from the support level, but it's encountering resistance around the 0.340-0.360 MYR range.
Potential Patterns : There might be a potential double bottom forming at the 0.235-0.240 MYR level, which could indicate a possible trend reversal if confirmed.
Overall, the stock appears to be in a downtrend but showing signs of potential stabilization or reversal. Traders should watch for a confirmed break above resistance or a breakdown below support for clearer directional signals.  Long
Long
 Long
Long
 Long
Long
 Long
Long
 Long
Long
CABINET HOLDINGS BERHADCabnet Holdings Berhad
Trend: The overall trend appears bearish in the medium term, with the stock price declining from highs around 0.80 MYR to current levels around 0.55 MYR.
Moving Averages: The price is currently below both the short-term (likely 20-day) and long-term (likely 50-day) moving averages, indicating bearish sentiment. However, the price has recently crossed above the short-term MA, which could signal a potential reversal.
Support and Resistance: A key support level appears to be around 0.48 MYR, which the price recently bounced off. Resistance levels can be seen around 0.60 MYR and 0.72 MYR.
Volume: Trading volume has been relatively low recently, with some spikes coinciding with price movements.
Bollinger Bands: The price recently touched the lower Bollinger Band and has started moving back towards the middle band, suggesting a potential short-term bullish move.
Recent Price Action: There's a small bullish candle forming, with a "buy" indicator visible, suggesting a possible short-term upward movement.
Indicators: While not all indicators are visible, the price action suggests oversold conditions may have been reached, prompting a potential bounce.
Chart Patterns: There's a possible double bottom formation around the 0.48 MYR level, which could indicate a trend reversal if confirmed.
Overall, while the medium-term trend is bearish, there are some short-term bullish signals that traders might consider. However, it's crucial to combine this technical analysis with fundamental analysis and risk management strategies before making any trading decisions.  Long
Long
 Long
Long
 Long
Long
Long 
 Long
Long
 Long
Long
 Long
Long
 Long
Long
 Long
Long