Short
Short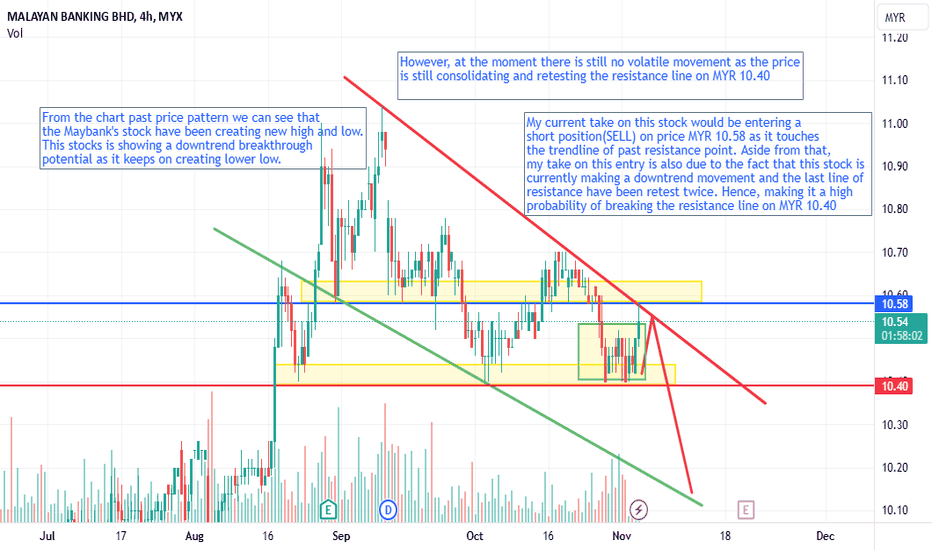
 Long
Long
 Long
Long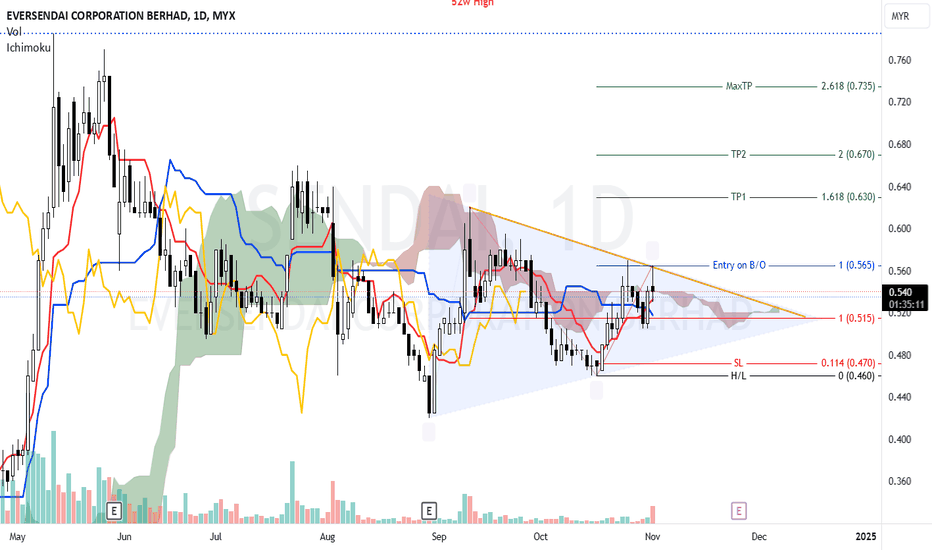
KITACON - Looking for potential price targetN wave with E, V, N & NT projection.
Price is above the Kumo, suggesting bullish sentiment, though the cloud is still thin, indicating some level of uncertainty.
The price is slightly above Tenkan-Sen, suggesting short-term bullish momentum.
Chikou-Span positioned above the price, further confirming bullishness.
Wave Structure: We see the classical A-B-C correction pattern completing around point (C), and the price has started moving upwards towards the NT level (0.775). If the price can successfully break and close above 0.775, it would likely confirm the next wave towards the N (0.845), V (0.860), and E (0.915) levels.
52-week high: 0.785, a key resistance level to monitor.
A potential entry can be taken once the price breaks above the NT level of 0.775, confirming bullish continuation.
Stop-Loss: Below the recent low around 0.740, providing a good risk-to-reward ratio.
Given the bullish signs from the Ichimoku indicators and the N wave projection, a breakout above NT (0.775) could indicate further upside movement. However, watch for a rejection at this level, which may result in price consolidation or a pullback.
Note:
1. Analysis for education purposes only.
2. Trade at your own risk.  Long
Long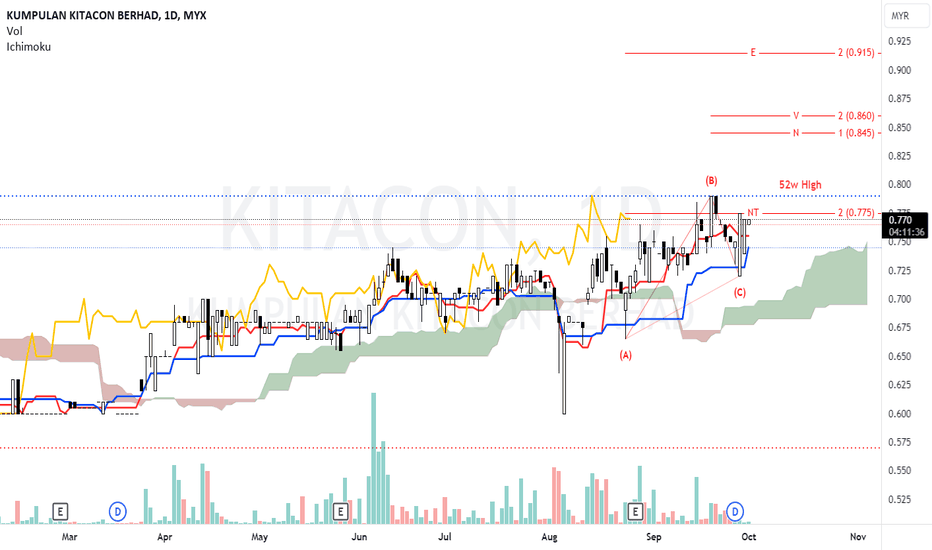
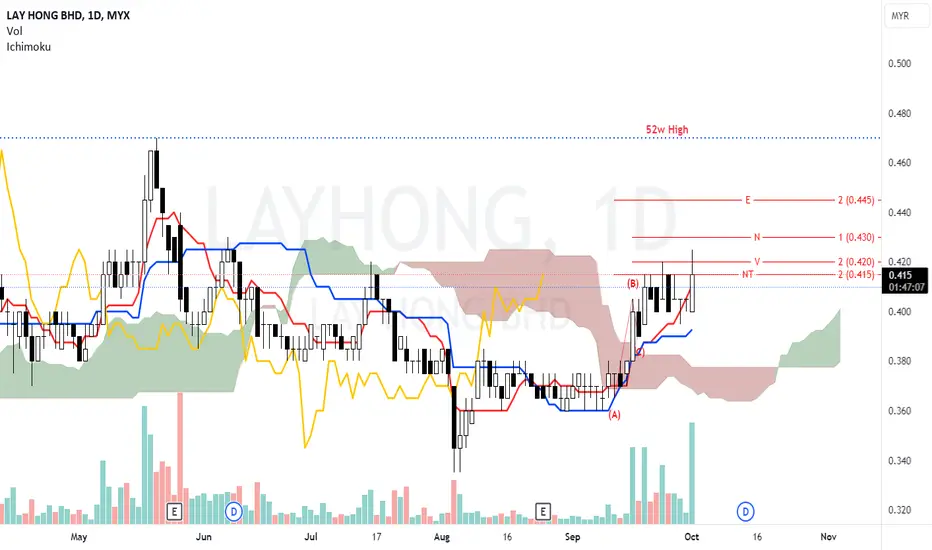
LAYHONG - Analysis on potential of price targetN wave with E, N, V & NT projection.
The price has moved above the Kumo, indicating bullish momentum, but the cloud is still quite thin, suggesting caution.
Price is currently above the Tenkan-Sen, suggesting bullish momentum is building up.
Chikou-Span is above the price, confirming the potential for bullish continuation.
NT level 0.415, which serves as immediate resistance.
The price has broken past point (B) and is currently testing the NT level (0.415). A successful break above NT would likely confirm further upside potential towards the N (0.430), V (0.420), and E (0.445) projections.
A potential long entry could be placed above the NT level of 0.415, confirming bullish continuation.
Stop-Loss: Below the Kumo or the recent low around 0.400 to manage downside risk.
If the price sustains above the NT level, the bullish momentum may carry it toward the higher projection levels. However, if there's a rejection at these levels, consolidation may occur. Keep an eye on volume to confirm breakout strength.
Note:
1. Analysis for education purposes only.
2. Trade at your own risk.  Long
Long
 Long
Long
lancaustudy("Serangkai", overlay=true)
msr = input(title="MSR" , type=input.bool, defval=false)
milo = input(title="MILO", type=input.bool, defval=false)
m3 = input(title="3M", type=input.bool, defval=true)
sma10 = sma(close,10)
sma20 = sma(close,20)
sma50 = sma(close,50)
sma200 = sma(close,200)
msrbar = open= open and sma10 <= close and msr==true
barcolor(color=msrbar ? color.blue : na, show_last=3)
plot(msr ? sma10 : na, title="MA10", color=color.blue, transp=0, linewidth=2)
plot(milo ? sma50 : na, title="MA50_milo", color=color.orange, transp=0, linewidth=2)
plot(m3 ? sma50 : na, title="MA50", color=color.orange, transp=0, linewidth=2)
plot(m3 ? sma20 : na, title="MA20", color=color.green, transp=0, linewidth=2)
plot(m3 ? sma200 : na, title="MA200", color=color.red, transp=0, linewidth=2)
// ichimoku ///  Short
Short
 Short
Short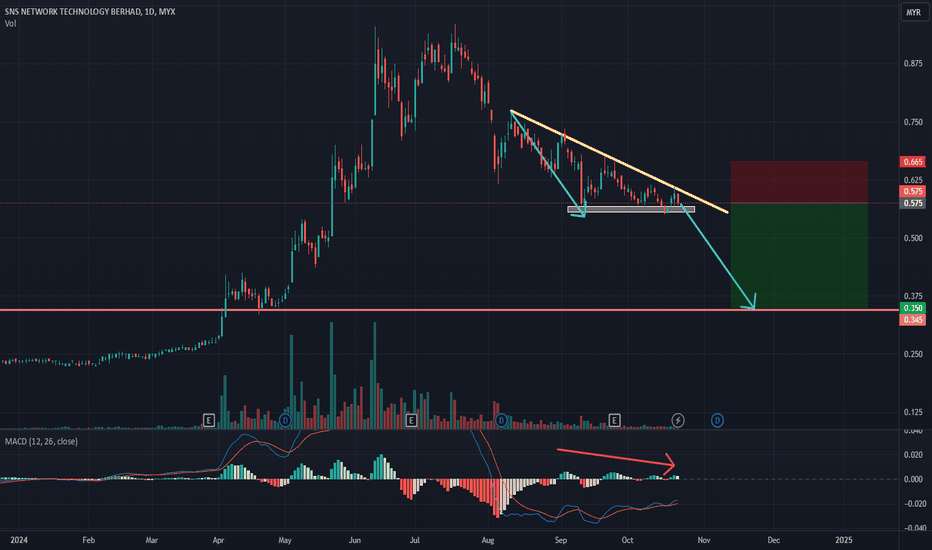
SPSETIA - Analysis on potential price movementN wave with E, N & NT projection.
The price is currently above the Kumo, indicating a bullish trend, but it's near a potential resistance zone (NT level).
The cloud (future Kumo) is flat and thin, showing weak support in the future, which could lead to a reversal if momentum weakens.
Tenkan-Sen is above the Kijun-Sen, confirming bullish momentum.
The price has recently broken out from the consolidation, and this cross suggests bullish continuation.
The Chikou Span is slightly above the price, further supporting the bullish momentum.
NT level (0.149): This is the immediate resistance level. A successful close above this could signal continuation towards higher targets.
Immediate support is around 1.30, which aligns with the top of the Kumo. If the price falls below this, the bullish scenario would be invalidated.
Further support can be found around 1.20, the base of the previous consolidation zone.
A breakout and close above the NT level (1.49) could provide a good entry for a long position, targeting the N level (1.62).
Since the price is near a key resistance (NT level), ensure proper risk management by placing a tight stop-loss in case of a false breakout.
Monitor volume closely; a bullish breakout should ideally be accompanied by a spike in volume.
Bullish Scenario: A breakout above NT (1.49) could signal a move toward the N (1.62) and E (1.75) levels.
Bearish Risk: If the price rejects the NT level and falls below the Kumo (1.30), it could invalidate the bullish outlook, potentially triggering a downward move.
Note:
1. Analysis for education purposes only.
2. Trade at your own risk  Long
Long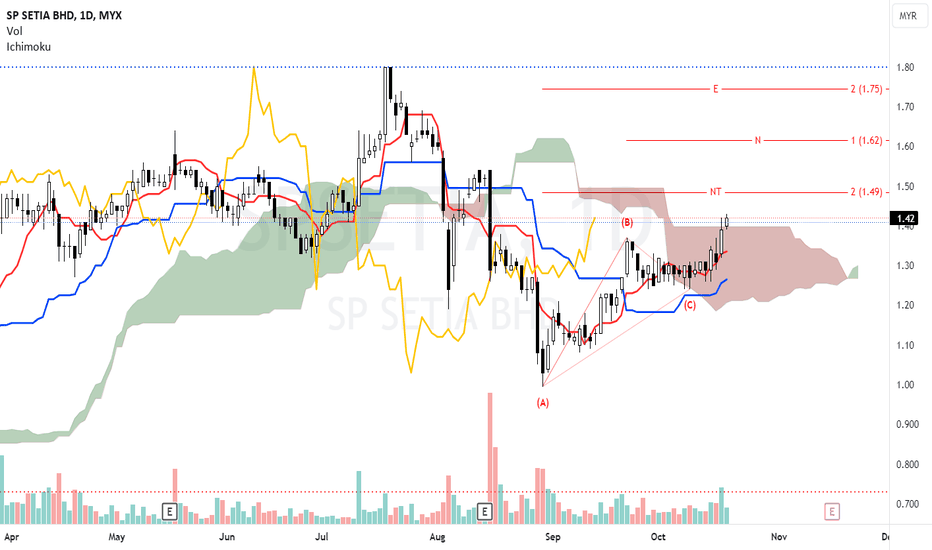
ORGABIO - Proposed Bonus Issue (Free Warrants)ORGABIO - Current price RM0.375
An analysis on price action without using any indicator.
On 21 May 2024 the stock made a significant Rising Window (Breakaway Gap) and closed at RM0.405. From there, the share price made a rally until 11 July 2024, hit an intraday high at RM0.520 (surge 28% from RM0.405) and closed at RM0.475 - lower than previous session closing price. Based on JAPANESE CANDLESTICK CHARTING TECHNIQUE , it made a BEARISH ENGULFING pattern which indicates potentially a decline is coming. As expected, from that BEARISH ENGULFING pattern, price falls until 12 Sept 2024, an intraday low at RM0.325 (strong support level of RISING WINDOW zone) and bounced back higher to closed at RM0.335. As such, the support level made on 21 May 2024 is still intact. At this point, traders may view this as an opportunity to buy on support.
On 02 Oct 2024, the company made an announcement to proposed BONUS ISSUE of up to 61,967,000 FREE WARRANTS in ORGABIO ("WARRANT(S)") on the basis of 1 WARRANT for every 4 existing ordinary shares in ORGABIO held on an entitlement date to be determined and announced later.
After that announcement, on 03 Oct 2024 the stock made a small rising window and closed higher at RM0.360. Then for 4 days the stock test the resistance RM0.360 and finally made a breakout to closed higher at RM0.370 on 17 Oct 2024. This price action added more the BULLISH scenario for this stock.
In my view, the stock may extend its uptrend as supported by :
i) SUPPORT LEVEL OF RISING WINDOW 21 MAY 2024 STILL INTACT - RM0.325
ii) GOOD NEWS OF BONUS ISSUE (FREE WARRANT)
Lets monitor closely !
 Long
Long
 Long
Long
 Long
Long
 Long
Long
 Long
Long
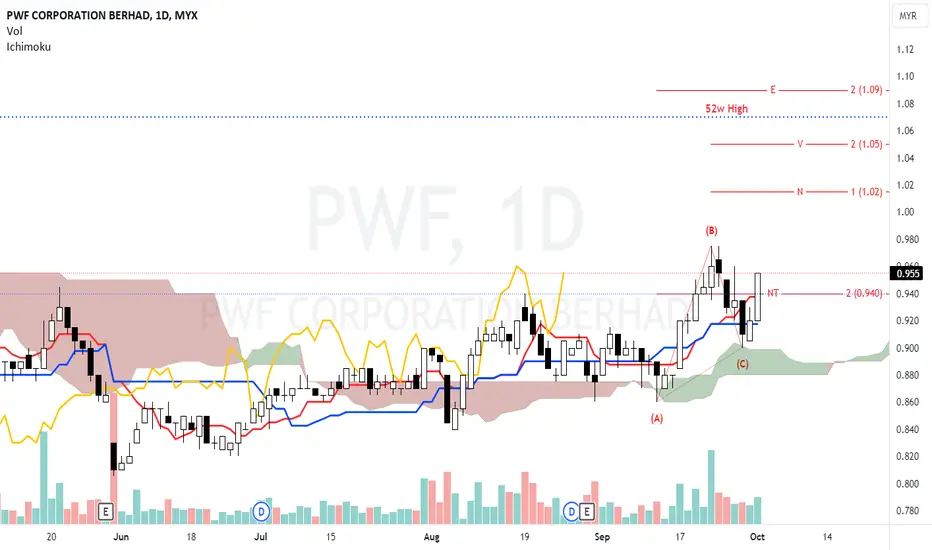
PWF - Analysis on potential price movementN wave with E, V, N & NT projection.
The price has broken above the Kumo, which indicates a bullish sentiment, as the candle closed above both the Tenkan-Sen and Kijun-Sen. The Kumo is acting as support now, with bullish momentum.
The Chikou-Span is above the price action, further confirming bullish momentum.
A potential entry around the current price of 0.955, especially given that the price has broken above the NT resistance of 0.94.
Consider placing a stop-loss slightly below the Kumo or the recent low around 0.90 to manage risk.
Watch for pullbacks, especially near 0.94 MYR (NT level), which could turn into support after being broken.
The Kumo cloud should act as dynamic support, and as long as the price stays above it, the bullish outlook remains intact.
Note:
1. Analysis for education purposes only.
2. Trade at your own risk.  Long
Long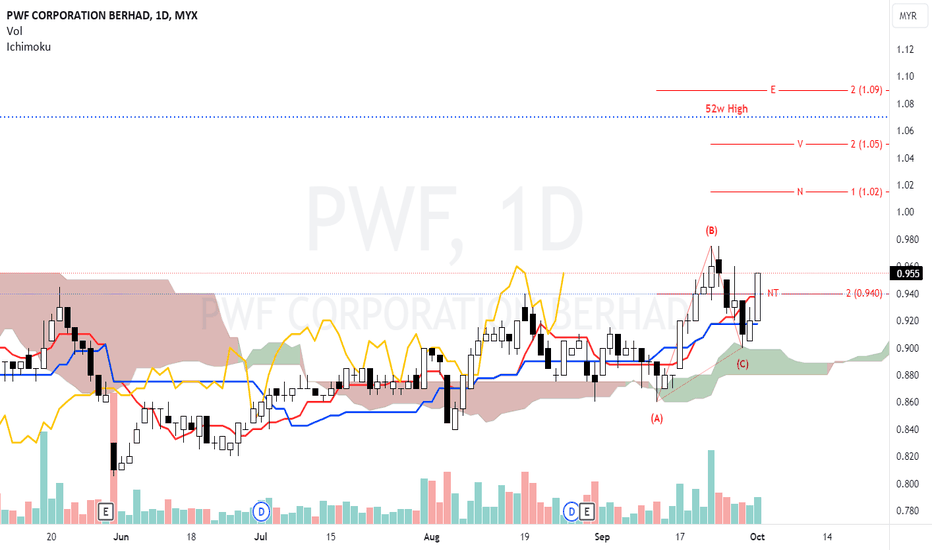
 Long
Long