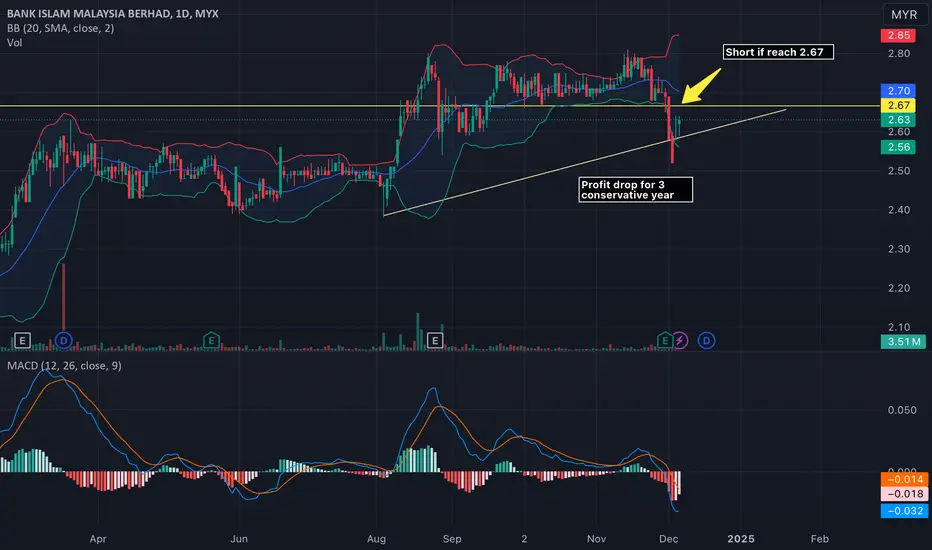
Long
Long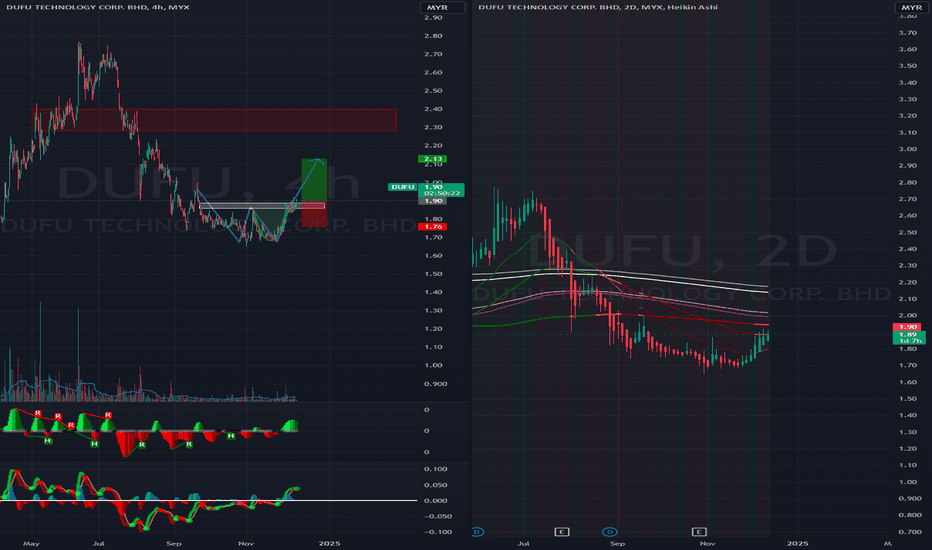
IFCAMSC - Analysis for potential price movement N wave with E, V, N & NT projection.
The price is above the Kumo, indicating a bullish trend.
The Tenkan-sen is above the Kijun-sen, signaling bullish momentum.
Chikou Span is above the price candles and the Kumo, supporting the bullish bias.
The price has closed above a critical resistance zone (gap closure region), confirming bullish progress.
The price is at 0.685, moving into the gap closure area, which could serve as a magnet for price action.
Breakout above 0.720 (NT level) is critical for further bullish momentum.
Immediate resistance levels: 0.720 (NT), 0.745 (V), 0.775 (N), and 0.840 (E).
Immediate support levels: 0.660 (gap support) and 0.640 (upper Kumo edge).
Enter a long position if the price breaks above 0.720 (NT level) with strong volume.
Alternatively, wait for a pullback near 0.660–0.670 (gap support zone) for a better risk-reward setup.
Place a stop-loss below 0.640 (upper Kumo edge) to manage downside risk.
Volume Confirmation: Ensure the breakout above 0.720 (NT) is supported by significant volume.
Risk Management: Adjust position size according to the stop-loss distance and ensure the reward-to-risk ratio is favorable.
52-Week High: Monitor price action if it approaches the 52-week high, as this could act as psychological resistance.
Note:
1. Analysis for education purposes only.
2. Trade at your own risk.  Long
Long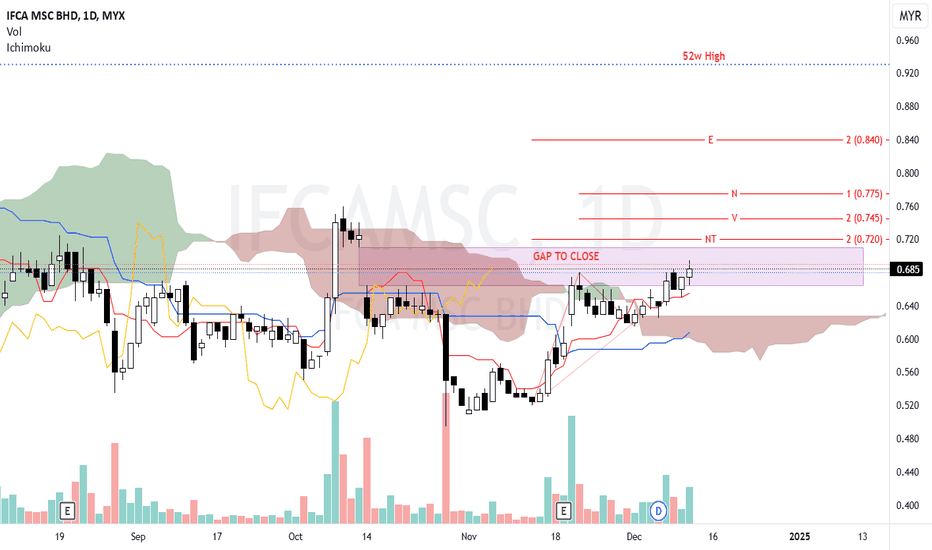
MNHLDG - Which sentiment is stronger, Bullish or Bearish?The chart presents two potential outcomes depending on the current market sentiment. The candle is below the Kumo, suggesting bearish momentum, but both bullish and bearish scenarios are possible:
N wave with E, V, N & NT projection.
The price is below the Kumo, indicating a bearish trend. However, a break above the NT level and Kumo could trigger a bullish shift.
The Chikou-Span is below the price action, which confirms the bearish trend, but a breakout above the Kumo would reverse this sentiment.
A buy signal could be confirmed with a close above 0.935 (NT level) and ideally above the Kumo.
Watch for a Kumo breakout to validate this bullish outlook. Failing to break above NT could invalidate the bullish scenario.
Wait for a breakout above the Kumo and NT (0.935) to confirm a bullish move towards 1.02, 1.05, and 1.10.
Y wave, target (E) within stipulated range.
The corrective Y wave formation is seen with the potential to continue downwards if the price fails to break above the NT level and remains under the Kumo.
The price is below the Kumo, and the Chikou-Span is also confirming bearish sentiment. If the price stays below NT (0.935) and continues its downward path, the bearish outlook strengthens.
If the price rebounds at (E) in the bearish scenario (Y wave), it could signal the end of the corrective phase and the potential for a new bullish wave to begin. Here's how you can approach the situation:
E (0.820 - 0.835): This zone represents the final target of the bearish Y wave. If the price reaches this level and shows signs of support or bullish reversal patterns (e.g., bullish engulfing, hammer), it could signal the beginning of a bullish recovery.
Look for candlestick patterns like a bullish engulfing or a hammer around the E (0.820 - 0.835) level.
If the price moves above the Kumo after a rebound from E, it will further confirm the bullish reversal.
A cross of the Tenkan-Sen over the Kijun-Sen below the Kumo could signal early bullish momentum.
After the rebound, the price could start a new N wave pattern with an upward trend.
New projections for N, V, and E targets can be calculated based on the rebound.
If a strong rebound is confirmed near 0.820 to 0.835 with bullish price action and Ichimoku alignment, consider entering a long position.
Place a stop-loss slightly below the E level (0.820) to minimize downside risk.
First target: Near previous resistance levels, likely around 0.94 (NT level).
Subsequent targets: 1.02 (N), 1.05 (V), and 1.10 (E) from the potential new N wave.
This would offer a good risk-to-reward setup, assuming the price respects the E level and bullish momentum follows.
Note:
1. Analysis for education purposes only.
2. Trade at your own risk. BNASTRA - Just a 2-cent ideaN wave with E, V, N & NT projection.
NT Projection (1.52): This level is the immediate resistance. The price recently tested this level but was unable to close above it, pulling back slightly to 1.42. If the price breaks and closes above this NT level, it could indicate a continuation of the bullish trend.
The price is above the Kumo, suggesting an overall bullish trend. The Chikou-Span remains above the price, supporting the current bullish outlook. However, the price is testing the lower boundary of the Kumo, so a breakout or rejection in the coming sessions will be important.
The stock recently tested its 52-week high around 1.52, coinciding with the NT level. A breakout above this high would be a strong bullish signal.
Recent price action has seen a slight increase in volume, indicating buyer interest, especially after the pullback to 1.37.
Entry: Enter above the NT level at 1.52 on a breakout confirmation.
Stop-Loss: Set the stop-loss around 1.38, below the recent low and Kumo support.
If the price fails to break above NT (1.52), it may lead to further consolidation or a re-test of lower support levels.
Ascending Triangle
The NT level at 1.52 acts as the horizontal resistance. The price has tested this level multiple times, forming the flat upper boundary of the triangle. This is also close to the stock's 52-week high, reinforcing the significance of this resistance.
The ascending trendline can be drawn from the recent lows at points A and C. This rising support line connects the higher lows, creating the lower boundary of the triangle.
The price is moving within the triangle, getting squeezed between the rising trendline and the horizontal resistance, indicating increasing pressure for a breakout.
An ascending triangle suggests a bullish breakout is likely if the price can close above the 1.52 resistance level with strong volume. The measured move (potential target after breakout) is typically calculated by taking the height of the triangle and projecting it upward from the breakout point.
Entry: Enter on a breakout above 1.52, with a strong daily close confirming the move.
Stop-Loss: Place the stop-loss below the rising trendline support, around 1.38 (or slightly below the recent lows).
Target: The expected move can be projected by measuring the height of the triangle, which is approximately 0.15 (1.52 - 1.37). This would give a target of around 1.67, which aligns with the N and V projections (1.73).
If the breakout is strong, the price may move towards the final E projection of 1.90 in the longer term.
Note:
1. Analysis for education purposes only.
2. Trade at your own risk.  Long
Long
 Long
Long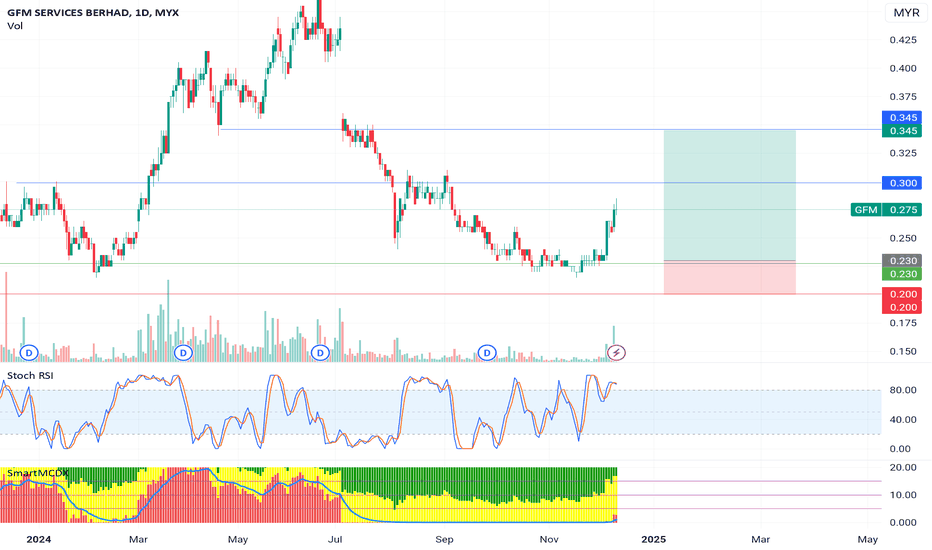
 Long
Long
 Long
Long
 Long
Long
Case Study - EVERSENDAI CORPORATION BERHADCase Study - EVERSENDAI CORPORATION BERHAD
Eversendai Corporation Berhad (ECB), formerly Eversendai Corporation Sdn. Bhd is an investment holding company.
The Company's principal activity is the provision of management services. ECB's subsidiaries include EV Abu Dhabi, EV Dubai, EV India, EV Qatar, EVSC, EV Saudi, EV Sharjah, EV Singapore and SEVM. The Company owns 49% interest in EV Abu Dhabi, EV Dubai, EV Qatar and EVSC.
ECB provides some technical services, such as Structural design, Detailing works, Unfolding drawings and Value engineering services. It provides complete design services ranging from conceptual stage design to connection design for a range of structures using appropriate software.
ECB also provides structural detailing works services and services in unfolding drawings with 3-D curvatures for complex structures. The Company has completed over 100 projects, including projects in 10 countries, such as Malaysia, Thailand, Philippines, Indonesia, Hong Kong, Oman, Saudi Arabia, Bahrain, Qatar and UAE.
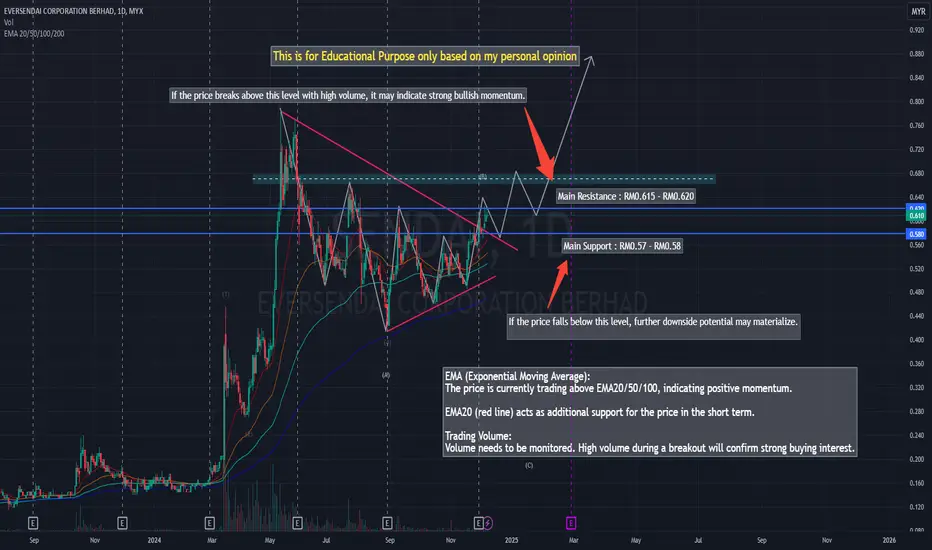
Analysis of Eversendai Corporation Berhad (SEND) Chart
1. General Trend Overview:
SENDAI 's stock price is showing a symmetric triangle pattern, which is a consolidation pattern.
A breakout above the resistance line may signal an upward movement, while a breakdown below the support line could lead to further price declines.
2. Key Support and Resistance Levels:
Main Resistance: The upper line around RM0.615-RM0.620.
If the price breaks above this level with high volume, it may indicate strong bullish momentum.
Support Level: The ascending lower trendline around RM0.57-RM0.58.
If the price falls below this level, further downside potential may materialize.
3. Technical Indicators:
EMA (Exponential Moving Average):
The price is currently trading above EMA20/50/100, indicating positive momentum.
EMA20 (red line) acts as additional support for the price in the short term.
Trading Volume:
Volume needs to be monitored. High volume during a breakout will confirm strong buying interest.
4. Stock Price Direction:
Positive Scenario:
If the price breaks above RM0.620 with high volume, the next target could be around RM0.65 or higher.
Negative Scenario:
If the price fails to hold above the support level of RM0.57, the stock may decline to lower levels, such as RM0.55 or below.
5. Recommendations:
Buy After Breakout:
Wait for the price to break above RM0.620 with significant volume before entering.
Monitor Support:
If the price drops below RM0.57, consider exiting to avoid further losses.
Set a Stop-Loss:
Place a stop-loss below the support level of RM0.57 to manage risk.
Conclusion: The SENDAI price is in a consolidation phase.
Wait for confirmation of a breakout above resistance or a breakdown below support before making a decision.
The short-term direction depends on how the price behaves around the RM0.620 resistance and RM0.57 support levels.
 Long
Long
Case Study - Bursa - QL Resources BhdCase Study - Bursa - QL Resources Bhd
Fundamental and Historical Analysis:
Business Diversification:
Starting as an agribusiness and fisheries company, QL has expanded into the food, retail (FamilyMart), and green energy sectors.
The introduction of FamilyMart in 2016 was a pivotal move, strengthening QL’s presence in the retail and fast-food sectors, making it a key revenue source alongside agribusiness.
Green Energy:
The renewable energy initiative highlights QL’s commitment to sustainable development, making it appealing to ESG (Environment, Social, Governance) investors.
Stable Profitability:
Financial data indicates overall revenue growth, but profit margins (PBT) require attention, especially in FY24 and FY25 Q2.
Key Challenges:
Declining margins in FY25 Q2 and the need to compete in a highly competitive retail market may challenge future performance.
Technical Analysis Based on the Chart:
Main Trend:
The chart indicates a strong upward trend with consistent support lines, signaling investor confidence in QL shares.
Critical Levels:
Major Resistance: RM4.90 – this is a key level that needs to be breached to confirm upward momentum.
Major Support: Uptrend line – a breakdown below this trendline could indicate a reversal in momentum.
Zig-Zag Pattern:
The price correction in a zig-zag pattern is healthy and suggests consolidation before the next significant move.
Trading Strategy:
Wait for a breakout above RM4.90 with high volume as a sign of buyer strength.
Ensure a stop-loss plan below the support trendline to manage risk.
Insights and Recommendations:
Long-Term Growth Potential:
Diversification into green energy and FamilyMart's dominance in the local market provides positive growth prospects.
Risks:
Declining profit margins in future financial reports should be monitored.
If competition in the retail sector intensifies, QL will need to enhance operational efficiency to maintain profitability.
Smart Investment Steps:
Short-Term Investors: Focus on the RM4.90 level and use a "pullback entry" after a breakout.
Long-Term Investors: Focus on the company’s fundamentals, particularly developments in green energy and FamilyMart expansion.
 Long
Long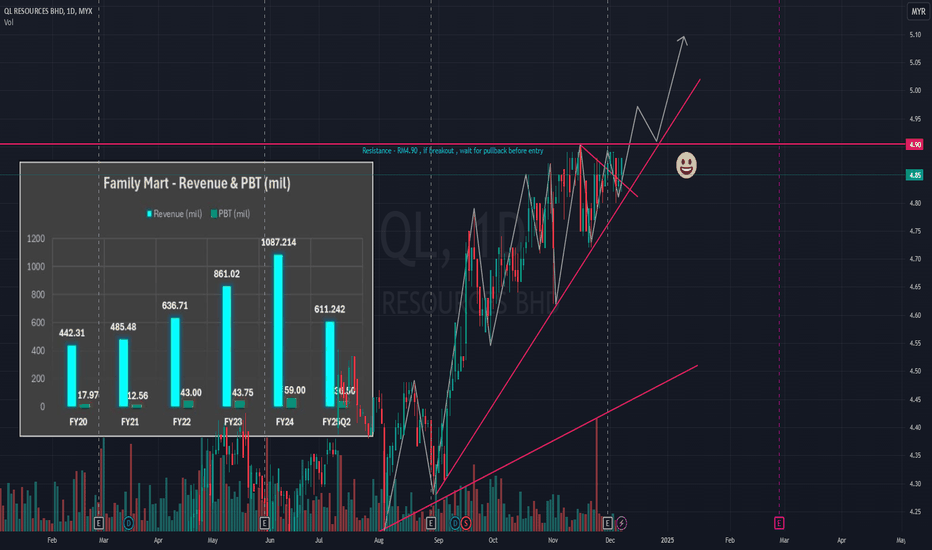
 Long
Long
 Short
Short
 Long
Long
 Long
Long
 Long
Long
 Long
Long
 Long
Long
 Long
Long
 Long
Long
 Long
Long
 Long
Long