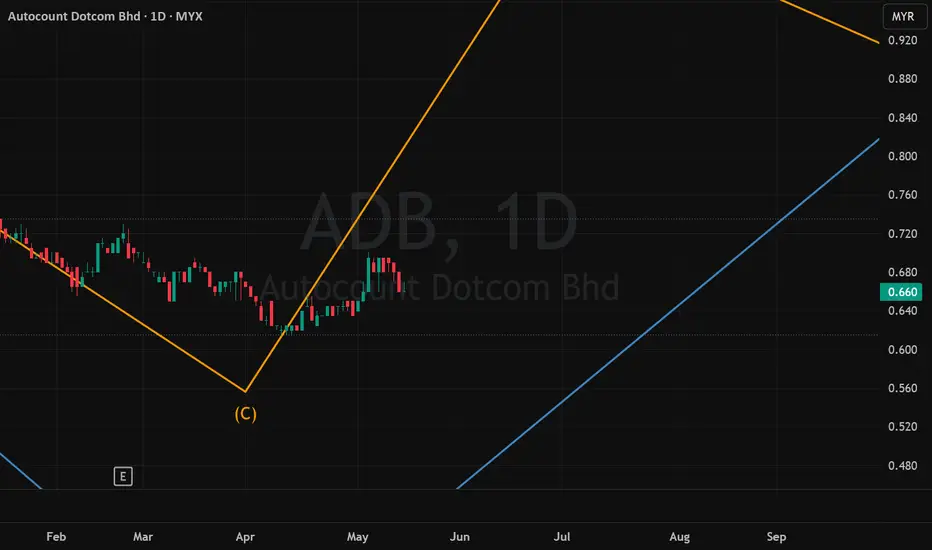
ADB (17/05/2026)Key Observation ADB (17/05/2026):-
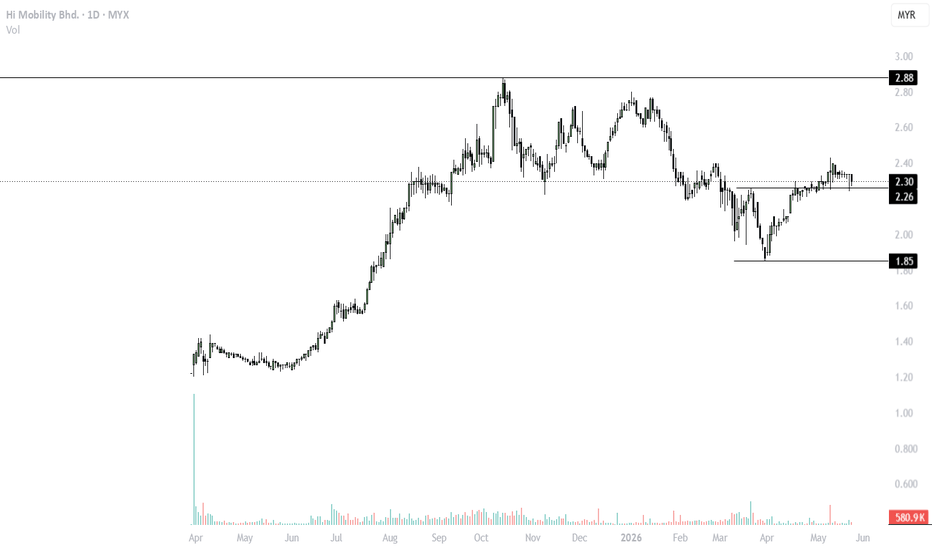
1. Major trend structure remains bullish.
2. Strong support established after Wave (2) correction -0.615
3. Early impulsive movement suggests Wave (3) initiation.
4. Higher highs and higher lows beginning to form.
if
1. A breakdown below the Wave (2), 0,615, the trend will invalid.
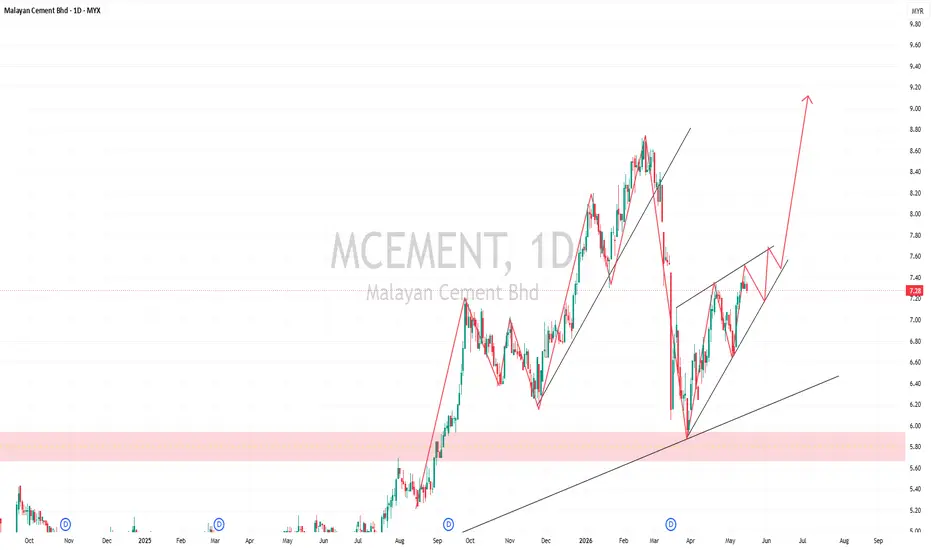
Technical Analysis — (MCEMENT) - 17 May 2026Overall Market Structure
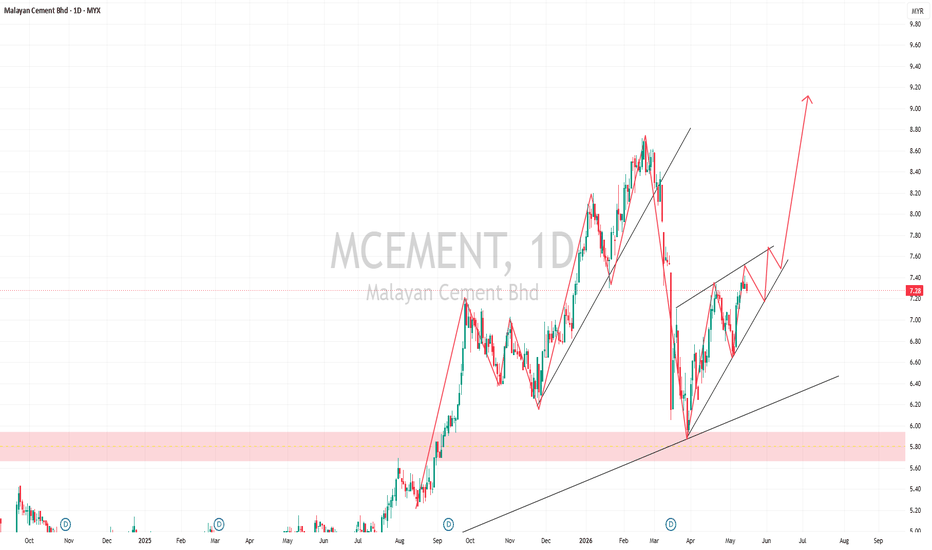
Based on the chart provided, MCEMENT remains in a medium-term bullish structure despite recent volatility. The stock has successfully rebounded from the major support zone around RM5.80–RM6.00 and is currently forming a higher low + ascending channel pattern.
The current setup suggests:
The market is attempting another bullish continuation wave.
Bullish Recovery Structure
The chart clearly shows:
Higher lows being formed
Recovery from strong support
Ascending price channel
Momentum stabilization after correction
This indicates:
Buyers are gradually regaining control.
If price respects the lower trendline support:
continuation toward RM7.60
then RM8.20–RM8.60 becomes increasingly possible.
Breakout Confirmation
A strong breakout above:
RM7.40–RM7.60
with volume expansion could trigger:
momentum buying
institutional participation
trend continuation
Potential upside targets:
RM8.20
RM8.60
RM9.00+
The projected structure on your chart suggests a possible acceleration phase if breakout confirmation occurs.Fundamental & Sector Narrative
MCEMENT benefits from several macro themes:
1. Infrastructure & Construction Cycle
Malaysia’s infrastructure spending remains supportive for:
cement demand
construction materials
industrial projects
Potential beneficiaries include:
highways
data centers
industrial parks
public infrastructure developments
2. Pricing Power Improvement
Cement players have recently shown:
stronger pricing discipline
improving margins
better cost management
If energy costs stabilize:
earnings recovery may strengthen further.
Risks & Threats
1. Resistance Zone Still Active
RM7.40–RM7.60 remains a critical resistance area.
Failure to break this zone may lead to:
sideways consolidation
short-term pullback
profit-taking pressure
2. Construction Sector Volatility
The stock remains sensitive to:
government project execution
economic slowdown
raw material cost fluctuations
diesel & energy prices
Any slowdown in infrastructure spending could affect sentiment.
3. Breakdown Risk
If price fails to hold:
RM7.00
then RM6.60
the bullish channel structure may weaken significantly.
Major downside support remains:
RM5.80–RM6.00
For Investors
MCEMENT appears suitable as:
a construction/infrastructure recovery play
medium-term cyclical exposure
trend-following setup
Current structure suggests:
accumulation may still be ongoing before the next expansion phase.
Conclusion
MCEMENT currently displays:
✅ Bullish recovery structure
✅ Ascending channel support
✅ Higher low formation
✅ Potential breakout setup
However, confirmation is still needed above RM7.60 before stronger upside momentum toward RM8.50–RM9.00 can develop.
At the current stage:
The stock remains in a constructive bullish setup, but still within a confirmation zone.
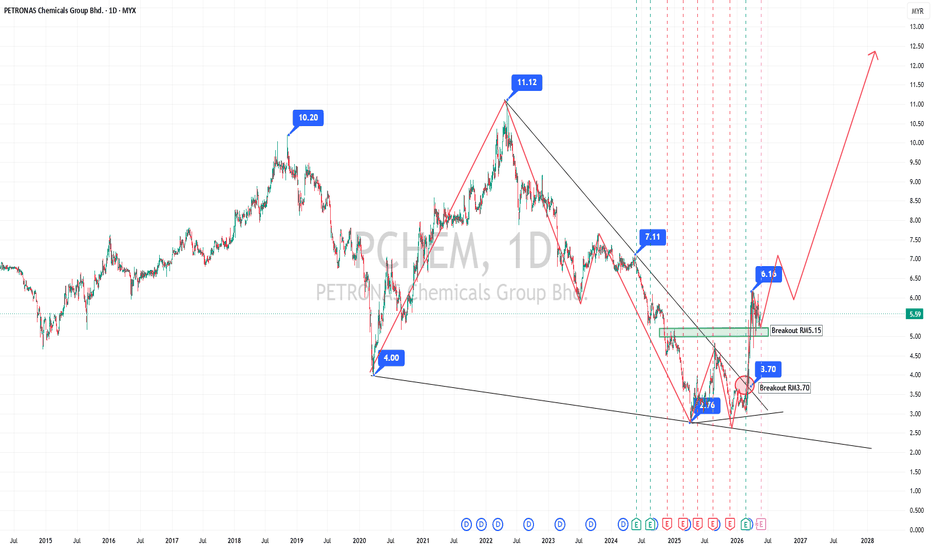
PCHEM Technical & Fundamental Analysis (17 May 2026)Based on the chart provided, PETRONAS Chemicals Group Berhad (PCHEM) appears to be entering a potential long-term recovery and trend reversal phase after experiencing a prolonged bearish cycle from its all-time high near RM11.12.
The stock has shown strong rebound characteristics from the RM2.76–RM3.00 bottom region and is currently attempting to establish a new bullish structure.
Current Technical Outlook
PCHEM has successfully:
Broken above RM3.70
Formed higher lows
Reclaimed the RM5.00 region
Created early signs of bullish momentum recovery
This suggests:
The stock may be transitioning from a long-term downtrend into an accumulation and recovery phase.
arnings Recovery Narrative
Several analysts expect PCHEM’s earnings to improve in FY2026 after a weak FY2025. Key recovery drivers include:
Better petrochemical selling prices
Improved plant utilization
Margin normalization
Recovery in global industrial demand
Some projections suggest FY2026 profitability could improve substantially if chemical spreads stabilize.
Energy & Oil Price Support
PCHEM remains highly correlated with:
Crude oil prices
Petrochemical spreads
Methanol and olefins pricing
If oil prices remain firm and global energy demand improves, sentiment toward petrochemical counters may strengthen further.
Bullish Scenario
If PCHEM:
Holds above RM5.15
Breaks RM6.16 with volume
Sustains higher lows
Then momentum could accelerate toward:
RM7.11
RM8.00+
RM10–RM12 longer term
Bearish Scenario
If price fails to defend:
RM5.15
RM3.70 support
Then downside retracement risk increases toward:
RM3.00
RM2.76 support zone
This would invalidate the current recovery structure
PCHEM may suit investors looking for:
Recovery plays
Cyclical turnaround opportunities
Medium to long-term capital appreciation
However, position sizing and patience remain important due to sector volatility.
Key focus areas:
Breakout confirmation above RM6.16
Volume expansion
Momentum continuation candles
Institutional buying activity
Current setup can be classified as:
“High-risk, high-reward recovery setup.”
MISC TRADE
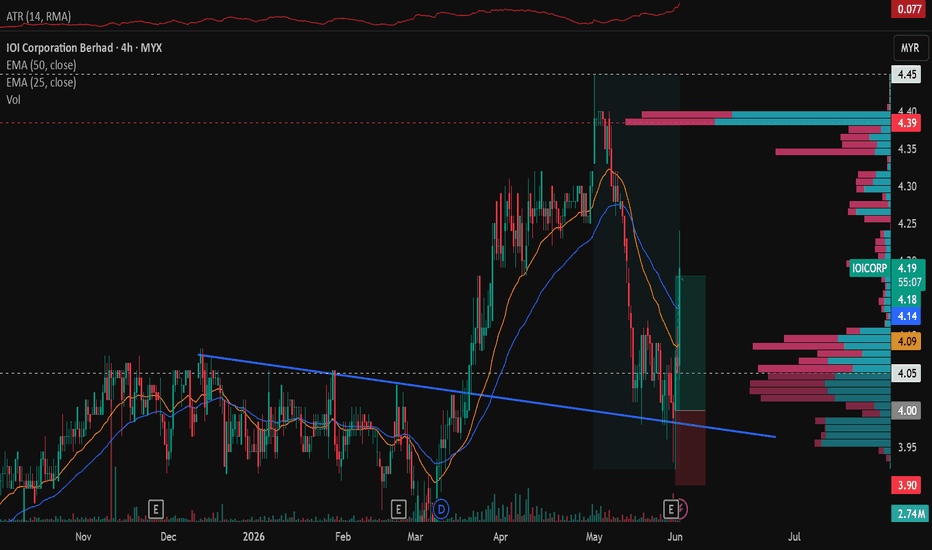
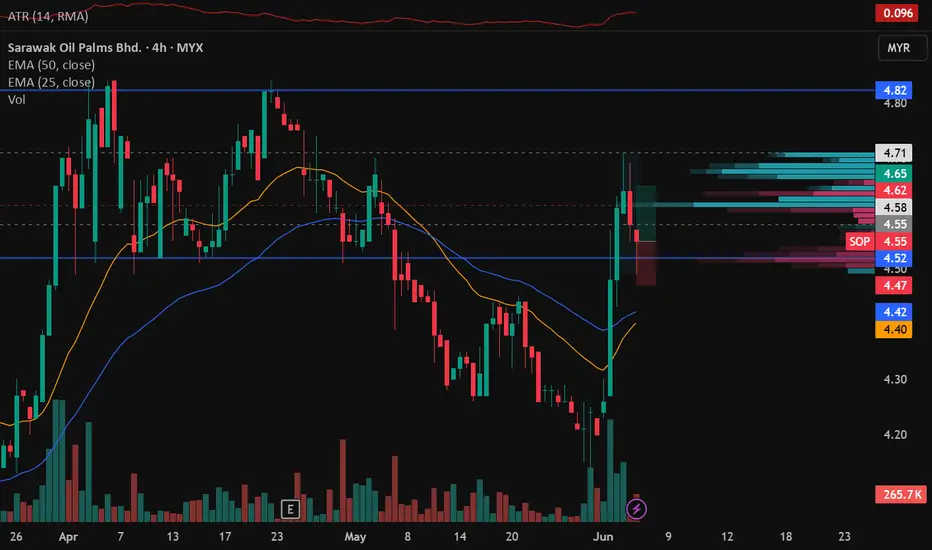
Price broke a multi-month level with high volume on the move leading towards the breakout on the 4hr chart. Then on the pullback, big large candles formed but with low volume signalling the strength during the move down wasn't because of the bearish volume but lack of buying pressure. On the 1hr chart, a double bottom formed and entry is on the green candle at the second bottom. Stops is below the lows and tp is before the next resistance level.
MNHLDG TO CONTINUE MARK UPThis is an atypical type of Re-Accumulation Schematic # 1
- Spring setup
For the context, at the moment, im pressing my throttle at the max.
my US portfolio gives me lots of buffer to press harder
This is my 3rd position for Malaysian Stock market
*kpj (profit booked) - refer link
back to MNhldg, today Bar seems like a Trigger Bar although still incomplete.
With the feather's weight prior that (Red Arc drawn),
along with influx of demand (green arrow),
position as attached
**i think MNHLDG would make 1 or 2 feather's weight or springboard before shooting up.
not sure. will add more
** this is a staggered stop loss .
back in 2025, MNHLDG was one of my pareto trade, that contributed much to tripple digit return.
Reversal IHNS for KheesanPossible reversal to bullish for kheesan as per monthly TF found inverted head and shoulder pattern. As this is monthly TF so patient is key for the profit to come. Perfect ratio is 33 sen or within the big blue box for 1st TP (beware small blue box is lower TF perfect ratio) which is 100% profit in the long run. Might take a year or two to reach that. May entry within the current price since it might just at the end of bearish retracement. For indicator RSI already display bullish divergence. May check weekly/daily TF for better entry. Just my opinion. We will see.
Possible minor bullish rejection for GCB.If the price maintain at the current price which is above 71 sen, there is a possibility to go higher to 86sen or much higher which is 96sen for perfect ratio or near the perfect ratio. As for RSI also shows divergence on previous lower low and current lower low. Just my 2 sen opinion. Also keep in mind this is weekly TF, so patient is key here.
KPJ MIGHT CONTINUING MARK UP PHASEI have been following kpj for quite some time
Kindly refer link attached
This looks like a Typical Re-Accumulation Type 2
With demand influx (green arrow),
position initiated at the BUEC area, which coincided with SpringBoard
Beautiful Feather's weight pattern here (Formed since december 2025 until february 2026)