AXIATA - Trend reversal?Y Wave with target (E) within stipulated time.
Price breakout above the downtrend line – this suggests a potential bullish reversal.
Price is approaching the Kumo – breaking into or above the Kumo will strengthen the bullish signal.
Chikou Span is still below candles but starting to rise – watch for a cross above the price line as confirmation.
1.63 is marked as the 52-week low, a strong psychological and technical support level.
Price to maintain above Kijun-Sen and close inside Kumo with golden cross, that would further confirm trend reversal.
Support at 1.76 and 1.73. Set a stop loss when close below this level.
Note:
1. Analysis for education purposes only.
2. Trade at your own risk.
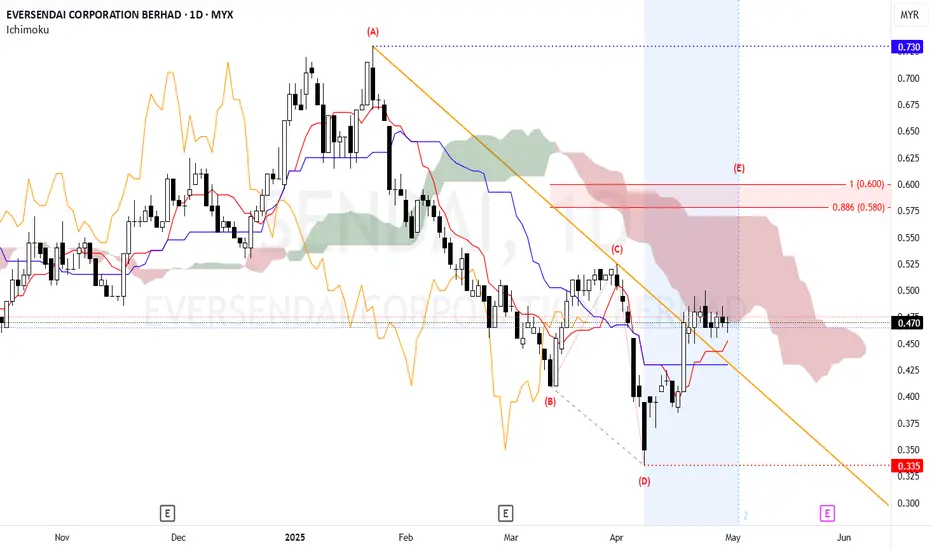
ECA - Looking for bullish momentumY wave with target (E) within stipulated time.
Price has just broken above the major downtrend line.
This breakout is a bullish signal, indicating a potential reversal or at least a corrective rally.
Tenkan Sen has crossed above Kijun Sen recently, which is a bullish crossover.
Price is near the lower boundary of the Kumo, which currently serves as resistance.
The cloud ahead is bearish, implying potential strong resistance to overcome before a sustained uptrend can form.
Chikou Span positions closer to price highs, suggesting increasing momentum.
Immediate support at 0.165.
Stronger support at 0.130.
Resistance near the cloud.
Entry: Consider entering a long position now or on a minor retracement near 0.170–0.175 after confirming support.
Stop Loss: Place stop loss below support around 0.160 or more conservatively below 0.150 to manage risk.
Target: Primary target towards the wave (E) at around 0.210 – 0.220.
Note:
1. Analysis for education purposes only.
2. Trade at your own risk.
GAMUDA MARK UP CAMPAIGN
So, a rare schematic of wyckoff spotted. Finally.
A Type #1 Schematic of Accmulation
I have been started my position as attached, along with my clients (Red Line)
Technically :
1/ The Spring is very nice, Textbook Classic as mentioned by David Weiss
2/ The Feather's weight along with SpringBoard (Yellow LIne) prompted us to add position
With the QR, released yesterday showing an increase profit margin + revenue + earning.
PureWyckoff
Natgate to start a reversal patternDaily (1D)
Slow but steady bottoming pattern since early April.
Today’s candle: inside bar, resting above EMA20.
Price still below Ichimoku cloud — so this is early reversal, not full breakout yet.
Volume building up, consistent over past few sessions.
🔹 30M / 5M
Price holding above VWAP zone intraday.
Intraday retracement happened, but buying resumed with small-bodied candles → possible absorption zone.
RTECH the top gainer on Wednesday After yesterday's pullback, price managed to rally over 20%, showing strong short-term momentum.
However, MACD now appears to be losing steam, signaling a potential slowdown or consolidation phase ahead.
If already in profit, it's wise to monitor closely... especially if the price nears resistance or fails to form a strong continuation pattern. Traders may consider tightening stops or locking in gains while momentum remains.
Disclaimer: This post is for discussion and study purposes only. Not a buy/sell recommendation. Always trade based on your own strategy and risk management.
KOPI still kaw.kaw?Price is currently trading below key trend lines, indicating possible weakness. Some traders may begin locking in profits at this stage.
Planning to enter? Maybe some will, but personally, I won’t... as the setup now looks more like a profit-taking zone rather than a fresh entry. Entering here might mean I become exit liquidity for others.
Disclaimer: This post is for sharing and discussion purposes only. It does not constitute buy/sell advice. Please trade based on your own analysis and strategy.
THETA, looking for buying interest?Price is hovering around the oversold zone.... a potential setup for rebound if buying interest steps in. However, oversold doesn’t always mean reversal. If momentum stays weak, price may continue sliding further.
Watch for confirmation signals before acting. Oversold can stay oversold longer than expected in a strong downtrend.
Disclaimer: This is for sharing and discussion only. Not a buy/sell call. Please trade according to your own analysis and risk tolerance.
Penta, near resistance?Once one of the hottest stocks during the bull run... but that’s history now. From its all-time high of 6.740, it's down nearly 65%.
Currently, the price is in the overbought zone and approaching a key resistance area. Despite the recent rebound, MACD remains below the zero line, suggesting the overall momentum still lacks strength.
Should we keep an eye on it? Maybe, but not for entry at this stage. If you're in profit, consider securing some. Better to wait for a healthy setup than chase a tired rally.
Disclaimer: This is not a buy or sell call. Just sharing for study and discussion purposes. Always do your own analysis before making any trading decisions.
PECCA MARKING UPPecca, an Atypical Type of Schematic #2 Wyckoff Re-Accmulation
Why Pecca?
technically =
1. Feather's Weight (red crescent)
2. Absoprtion (Red arrow)
3. fulfilling Wyckoff 9 Buying point
TriggerBar today, as a test, for a follow through in the upcoming days.
Position initiated as attached
PureWyckoff
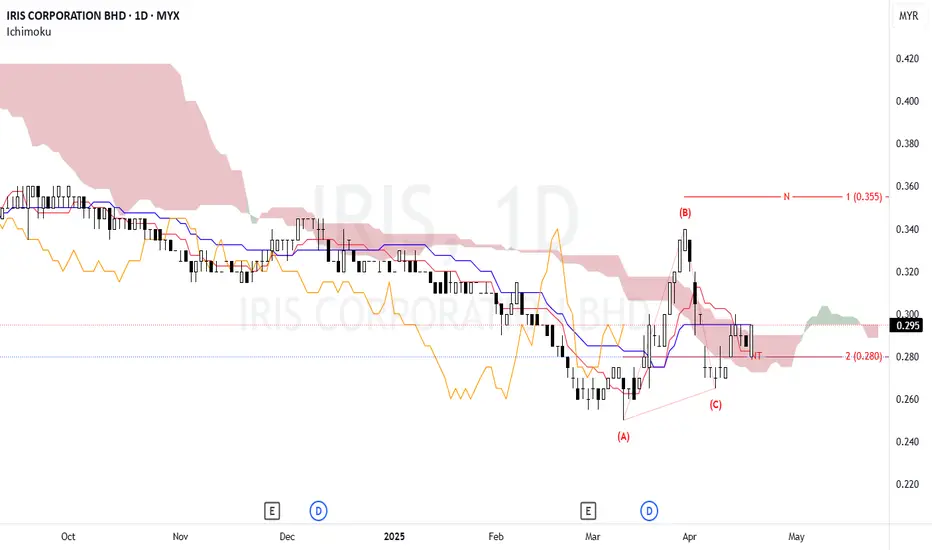
IRIS - Looking for bullish momentumN wave with N & NT projection.
NT as immediate support.
Price to maintained above NT level for bullish continuation.
Price is testing the bottom edge of the Kumo, suggesting a possible breakout.
Thin cloud ahead indicates less resistance—bullish potential.
Tenkan-Sen crossing above Kijun-Sen confirming bullish momentum.
Chikou span has crossed above the price candles and approaching the cloud—neutral to slightly bullish signal.
Bullish Bias, if the price can:
Hold above 0.280 (NT projection / Kijun-sen support).
Break and close above 0.300 (cloud resistance).
Stop-loss: Below 0.280 (under NT level and Kijun-sen).
Note:
1. Analysis for education purposes only.
2. Trade at your own risk.
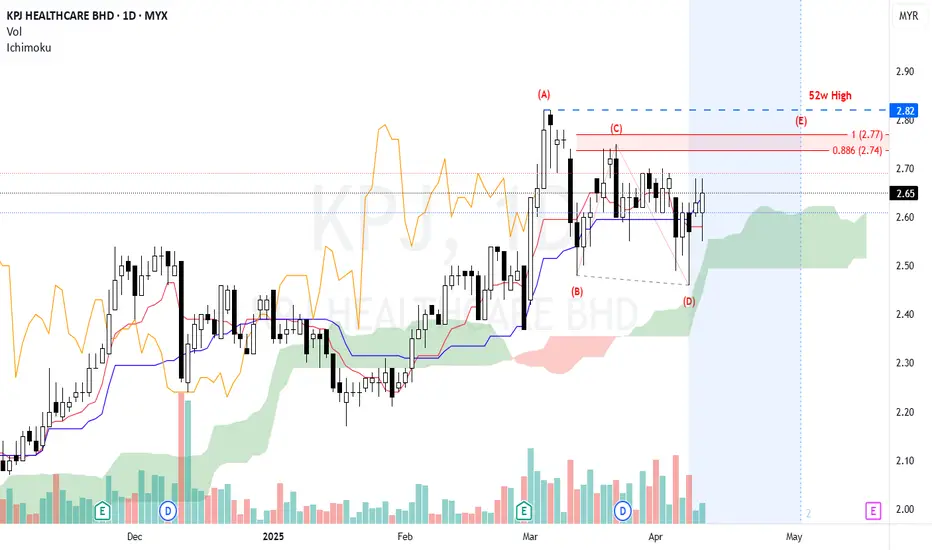
KPJ - Analysis of potential market movementY wave with target (E) 2.74-2.77 within selected time range.
Price is hovering near above Kumo and Tenkan-Sen as immediate support.
Watch for the golden cross to confirm bullish momentum.
Immediate resistance at 2.68. A close above this level could trigger a move toward target price.
Stop loss: Place below 2.55 (recent swing low) to limit downside risk.
A bullish bias is valid if the price sustain above the Kumo and 2.68.
Note:
1. Analysis for education purposes only.
2. Trade at your own risk.
MYEGThis Week FORECAST
Opportunity for MYEG. This setup trading idea is for intraday. >> TAYOR
Risk Factors:
1. Market conditions, unexpected news, or external events could impact the trade.
2. Always use risk management strategies to protect your capital.
MLong