MAHSING On 24/12/2024,
it is still seen in phase 2 and there is an increase after breaking the support at 1.49.
The EMA 10, 30, 50, 100, and 200 are well-aligned.
good to watch


TSHThis Weekly FORECAST
Opportunity for TSH. This setup is my trading idea/plan, if you want to follow: trade at your own risk (TAYOR).
Risk Factors:
1. Market conditions, unexpected news, or external events could impact the trade.
2. Always use risk management strategies to protect your capital.
 Long
Long
GENETECThis Weekly FORECAST
Opportunity for GENETEC. This setup is my trading idea/plan, if you want to follow: trade at your own risk (TAYOR).
Risk Factors:
1. Market conditions, unexpected news, or external events could impact the trade.
2. Always use risk management strategies to protect your capital.
 Long
Long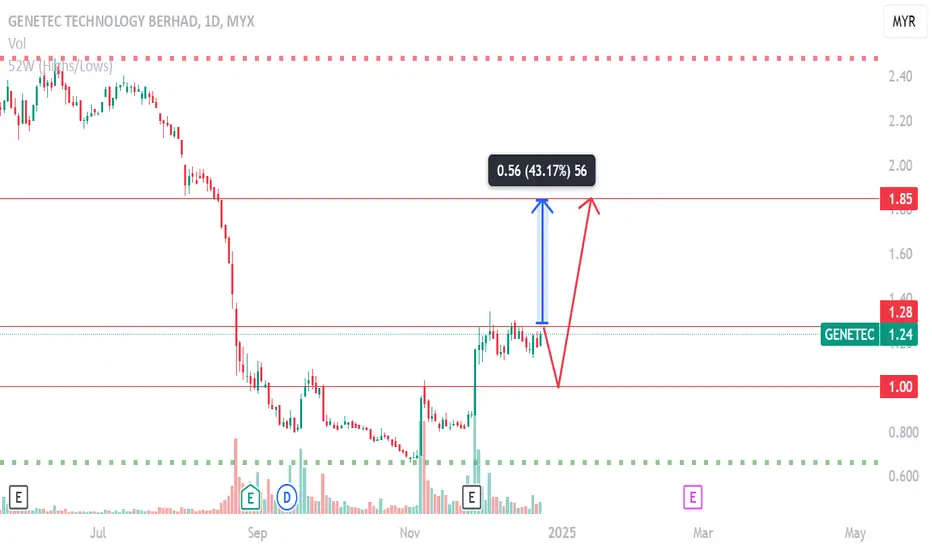
MI - sector TECHNOLOGY may be moving upExpect a deep wave 2 retracement, but for now seems like small retracement, rebound at MA 200
Current price shows MYR 2.24 (+3.23%) with key support at MYR 2.01 and resistance at MYR 2.67. The stock has formed a bullish trend since October 2024, showing higher lows and higher highs.
Technical indicators show:
Price trading above both short-term and long-term moving averages, indicating bullish momentum
Strong volume activity supporting recent price movements
Green momentum bars in the lower indicator suggesting positive sentiment
Upward trend channel formation with price respecting the lower trendline as support
Key levels to watch:
Immediate resistance: MYR 2.67
Current support: MYR 2.01
Price currently consolidating near MYR 2.24
The stock has recovered from its September 2024 lows and appears to be in a recovery phase with improving technical indicators. The presence of higher lows and sustained trading above moving averages suggests continued bullish sentiment in the near term.
Volume analysis indicates strong participation on upward moves, lending credibility to the current recovery. Traders should watch for a potential breakout above MYR 2.67 for further upside momentum.
 Long
Long
 Long
Long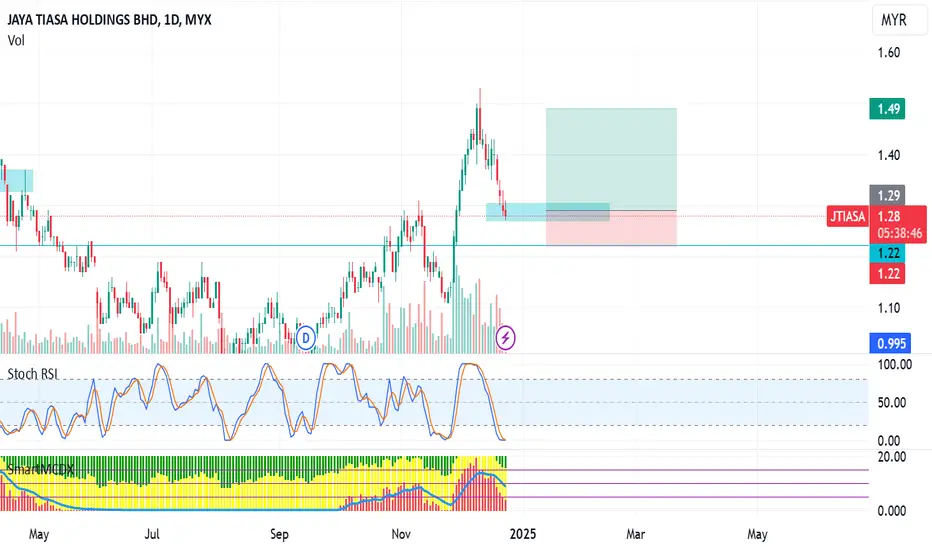
GDB - to continue its uptrend ?1. GDB - according to the theory is in a real uptrend (MA50 over MA200 Weekly)
2. Make a Double Bottom with accumulation for 570 days
3. Rebound from minor support (0.295) with volume that is larger than average
4. Interesting to follow if BO 0.355/0.360 Minor Resistance, which is also AVWAP line
TAYOR.. Kajian ini untuk pembelajaran diri sendiri sahaja
 Long
Long
GENTM still in sideway
GENM downtrend now from monthly chart.
Weekly chart, I can see the price movements have become slow and in a sideway
Daily Chart - I think i can have a small investment in the sideway box.
To be safe, i put my SL and TP and RR is 1.5:3?


TTVHB making 3rd wavei put stoploss below the horizontal level of peak 1st wave, as i feel this is impulse wave
wave 3 will go up, and even if it retrace as wave 4, it will not move below peak of wave 1
 Long
Long
SAMAIDEN poised for next uptrend wavecorrrection at 0.382
risk reward ratio is good
Here are the key elements I observe:
1. Price Movement:
- The chart shows candlestick patterns with both red and green candles
- Current price appears to be around 1.03 MYR (Malaysian Ringgit)
- There are multiple price levels marked with Fibonacci retracement levels (shown as horizontal lines)
2. Technical Indicators:
- Moving averages shown as curved lines in different colors
- Volume bars at the bottom of the chart (green and red bars)
- Various numbered points (1-5) marking significant price levels or movements
- Wave patterns labeled with roman numerals (iii, iv, v)
3. Trading Information:
- Buy level marked at 1.16
- Sell level marked at 1.15
- Target price shown as 0.09 (7.76%)
- Stop loss level appears to be set at 0.04 (3.45%)
- Risk/Reward ratio indicated as 2.25
4. Time Frame:
- The chart appears to be showing recent price action with data points marked for September 2024
- Volume analysis indicates varying levels of trading activity throughout the period
5. Market Status:
- The stock appears to be in a corrective phase after reaching a peak marked by point 5
- Multiple support and resistance levels are clearly marked on the chart
The overall chart seems to be a detailed technical analysis setup used for trading decisions with multiple indicators and price levels to guide entry and exit points.
 Long
Long
THPLANT will retrace another B and C then continue uptrendwave 4 minor for wave 1 have been formed
wave 1 completed its 5 moves, now making A correction, seems to end because of hammer formation
 Long
Long
gcapital will retrace at 0.618 and reboundcurrently wave 2, abc correction, will make major wave 3 soon
 Long
Long
TECHNICAL ANALYSIS - E&OTechnical analysis based on Elliot Wave + Moving Average. Elliot wave to provide analysis on current wave and anticipate next wave.
 Long
Long
Cresndo Buy CallChart have developed double uptrend bar. PE = 2.7. MACA uptrend indicator. EBITDA is above positive level for QR and AR too.
 Long
Long
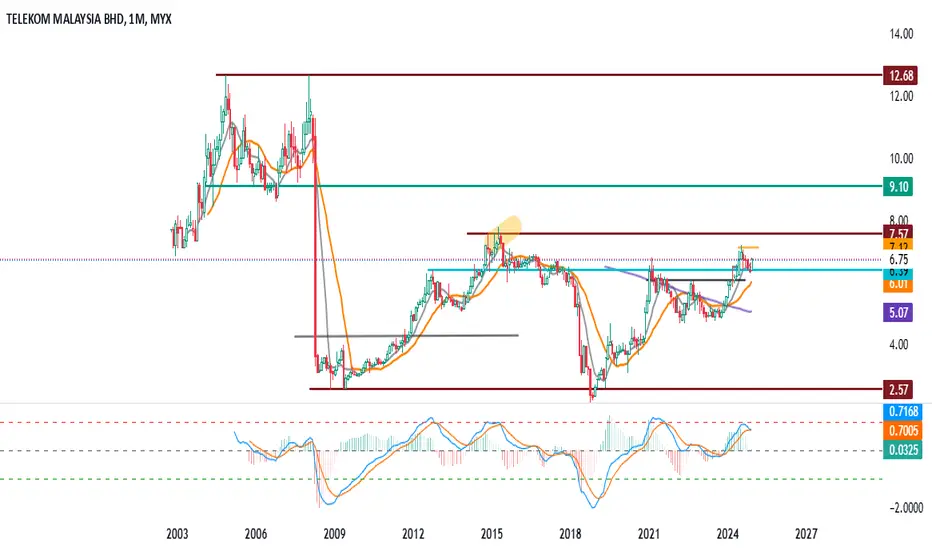
Daily - Telekom - Breakout Yearly High
Technical Analysis:
1) All MA200 below prices
2) Price breakout RM6.39 and heading to RM7.57
3) If price stand firmed above RM7.57, might MIGHT head to RM9.10
Do I have patient to wait for it? Without chasing the price?
We shall see
I like to use 3 windows to view it on monthly, weekly and daily. Easier for me to recall what was my strategy for this chart.
www.tradingview.com

Daily - SASBADI can be a rocket?
Technical Analysis:
1) Price breakout the MA200,and wait for pullback to entry
2) Been consolidation quite some time in weekly chart
3) Guess hit the lower low in yearly chart, time to bounce back?
Aim for R&R 1:3
 Long
Long
Buy signal prices touch support lineAutomotive part supplier. Mainly EV part supply. Healthy financial report. EBITDA in yearly and quarterly although in a min level. PE = 12.78. Quarterly result soon. Buy at 1.50 . Cut lost prices =1.45.. Day trade
 Long
Long
Sealink International Bhd Bullish Trend Still Intact1. Key Levels & Context:
Range: Price is rebounded from Higher Low for External Structure and MA200 at 0.265 and it is noticeable that the during the pullback, the volume is drying out.
2. Resistance Zone: Strong resistance at 0.340 - 0.360 and 0.365 - 0.380, influenced by:
a) Previous Lower Highs acting as dynamic resistances.
b) Bearish weekly candle.
c) Overlapping supply zone.
3. Short-Term Bias:
a) In H2 (Lower Timeframe):
- Change of Character (ChoCh) at 0.305 indicates a reversal in the Internal Structure for bullish trend to continue supported with the Gap and New Volume.
b) Validation & Invalidation:
- Bullish Validation: A daily close above 0.340 confirms upward momentum, targeting the next levels around 0.380 and 0.420 as the for the new 52 weeks High.
- Bearish Invalidation:
Break below psychological level 0.300 signals the bullish momentum is weakening, suggesting ongoing correction.
0.265 is the last defense for bulls. Breaching this level negates the bullish setup entirely.
4. Summary for Actionable Trade Setup:
a) Bullish Entry:
- EP : 0.275 - 0.290.
- TP : 0.340, 0.360, 0.380, 0.425, 0.500
b) Bearish Bias:
If price breaks 0.290, anticipate a deeper pullback.
A break below 0.265 confirms a reversal for bearish trend.
 Long
Long
Simple13 Trading IdeaCurrent Price: RM 1.23
The stock rebounded from a double bottom around RM 1.15, confirming a bullish reversal after breaking above the neckline at RM 1.20. However, the price encountered resistance near RM 1.30 and is now in a pullback phase.
Technical Analysis
Fibonacci Retracement Support:
The price has pulled back to the 50% Fibonacci retracement level, a key support zone where buying interest typically re-emerges.
Double Bottom Confirmation:
The break above the neckline at RM 1.20 validated the double bottom pattern. As long as the price stays above this level, the uptrend remains intact.
Resistance and Target:
The next major resistance is RM 1.30, followed by the target price of RM 1.50, aligning with the pattern’s projected move.
Trading Plan
Entry Area: RM 1.20 (near Fibonacci and neckline support)
Target Price: RM 1.50 (based on price projection from the double bottom breakout)
Cut Loss Level: RM 1.14 (if the stock closes below this level, invalidating the double bottom pattern)
Risk-to-Reward Ratio: 5:1
Summary
This setup leverages the double bottom breakout and Fibonacci support for a potential upside target of RM 1.50, while maintaining a tight stop-loss at RM 1.14 for risk management.
Disclaimer: This is not financial advice. Conduct your own research before making investment decisions.
MYX:CTOS


UWC earnings report release next weekPrices above support line & MACD indicate up trend as bar turning white. But P/E ratio is high. Earning report release next week. Share prices will drop after earnings report release.
 Short
Short
JCY Target 0.55/0.625/0.695Based on trend the price first target 0.55. Volume accumulationg now, Break 0.55 it would be lead to 0.625/0.695.
 Long
Long
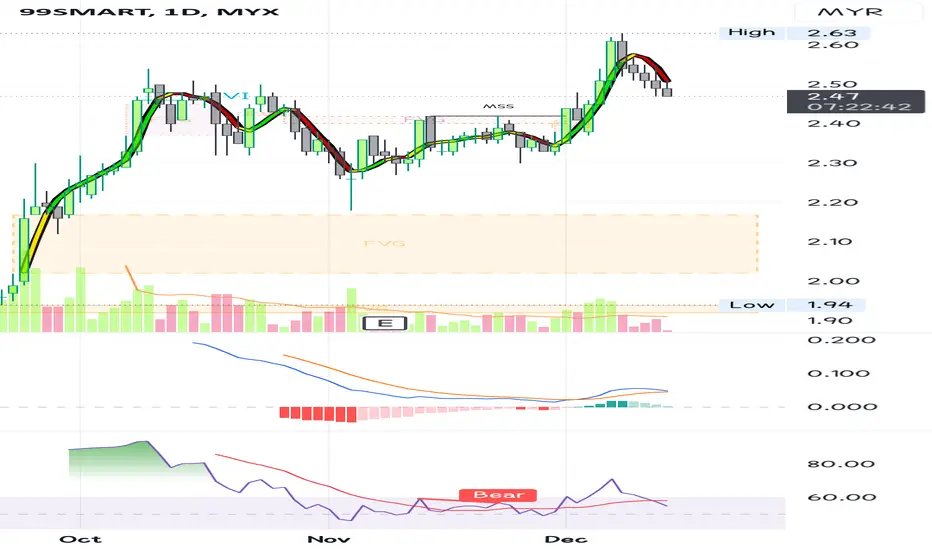
99SMART: A Potential Rebound Next Week?It experienced a significant decline of nearly 6% from its recent high of 2630.
If it further drops below the 2470 could dampen the stock's outlook.
For those who acquired the stock below the current price, there's still an opportunity for profit.
While uncertainty looms over the weekend, it's important to remember to enjoy the investment journey. By maintaining a positive outlook and making informed decisions, investors can navigate market fluctuations and maximize their returns.
We only profit when successfully sell. Otherwise it's merely a paper gain.
Disclaimer: Please be informed that all stock picks are solely for educational and discussion purposes; they are neither trading advice nor an invitation to trade. For trading advice, please consult your remisier or dealer representative.