• Products
  • Community
  • Markets
  • Brokers
  • More
Get started
  • Markets
  • /Malaysia
  • /Stocks
  • /Ideas
IJM, at bottom? Or ...The stock continues to decline, showing no clear signs of a reversal yet. The price remains in a downtrend, with each move lower reinforcing the bearish momentum. At the moment, 2.10 serves as the key support level, where buyers may attempt to defend the price. On the upside, the nearest resistance zone is around 2.40 – 2.55, which must be cleared for any meaningful recovery. To break out of this downtrend, the stock needs to establish a more structured pattern, essentially building a "stairca
MYX:IJM
by DSELE99
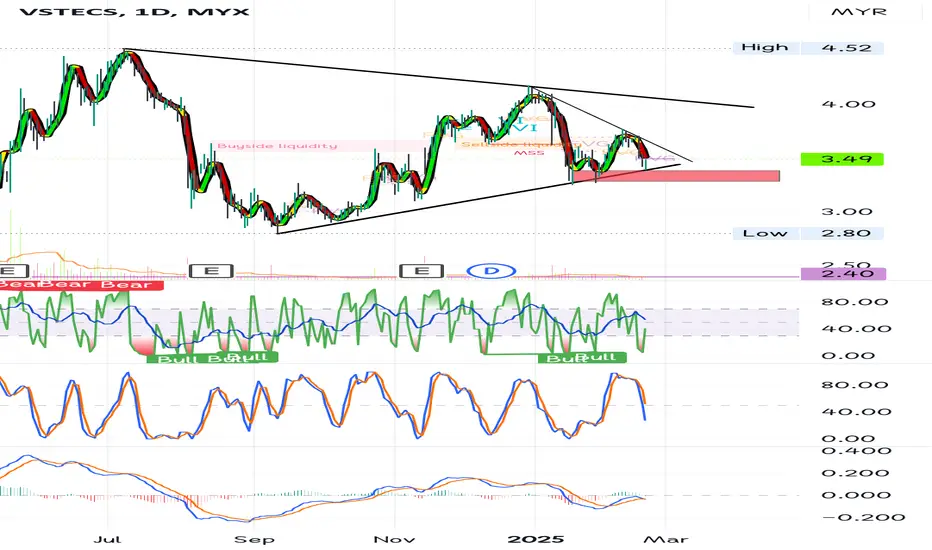
VSTECS, looking for next support?The price has closed below the moving average (MA) line, signaling potential weakness in the trend. Additionally, the MACD indicator is below zero, reinforcing a bearish sentiment. However, a key downtrend line remains in play, and a breakout above this resistance level could shift momentum. On the downside, strong support is seen around the 3.35 area, which coincides with an uptrend line acting as a crucial support level. A break below this zone may lead to further downside pressure, while a r
MYX:VSTECS
by DSELE99
HARTA, near support?The price is currently testing the support level around the 2.38 area. The key question now is whether this level will hold and trigger a short-term rebound or if the selling pressure will persist, leading to a breakdown below support. Several factors will determine the next move: market sentiment, trading volume, and broader trend direction. A strong bounce with increasing volume could signal a temporary reversal, while a decisive break below 2.38 might indicate further downside ahead. Trader
MYX:HARTA
by DSELE99
Eastern & Oriental Bhd - Potential Bullish Reversal Pattern# Technical Analysis: Eastern & Oriental Bhd (E&O) - Potential Bullish Reversal Pattern Looking at the E&O chart (ID: MYX), I can see that the stock is currently trading at 0.845 MYR, up 0.030 (+3.68%). The chart shows several key technical patterns and trade setups: ## Current Position Analysis - Trading near support at 0.845 MYR - Open position: 2,105 shares - Target price: 1.105 MYR (+30.18%) - Stop loss: 0.755 MYR (-11.24%) - Risk/Reward ratio: 2.68 (favorable) ## Technical Indicators The
MYX:E&OLong
by pengamalgelombang
CHB Support and ResistanceThe stock is currently trading at 0.845 MYR, up 0.010 (+1.64%). Key technical indicators visible: Moving averages (multiple SMAs: 10, 20, 50, 200) Trading volume (Vol 20: 631.7K) Several buy/sell signals on the chart The chart shows a recent trading range with: Current price: 0.845 Target price appears to be 0.955 (+29.6%) Stop loss set at 0.755 (-11.6%) Risk/Reward ratio: 2.68 There's an open position with quantity of 2,105 shares. The chart displays price action over several months from ap
MYX:CHBLong
by pengamalgelombang
CMSB - Breakout Down Trendline ?CMSB - CURRENT PRICE : RM1.10 CMSB had broken down trendline on high trading volume - indicating strong buying interest. This is possible beginning of trend changing from downtrend to uptrend. Furthermore, the reading in RSI crosses above 50 added more bullish outlook for this stock. Technically i would buy on this breakout point as it suggest an attractive RISK to REWARD ratio. ENTRY PRICE : RM1.10 TARGET : RM1.20 , RM1.29 , RM1.42 STOP LOSS : RM1.00 Notes : There is a catalyst for this sto
MYX:CMSBLong
by IMRAN_96
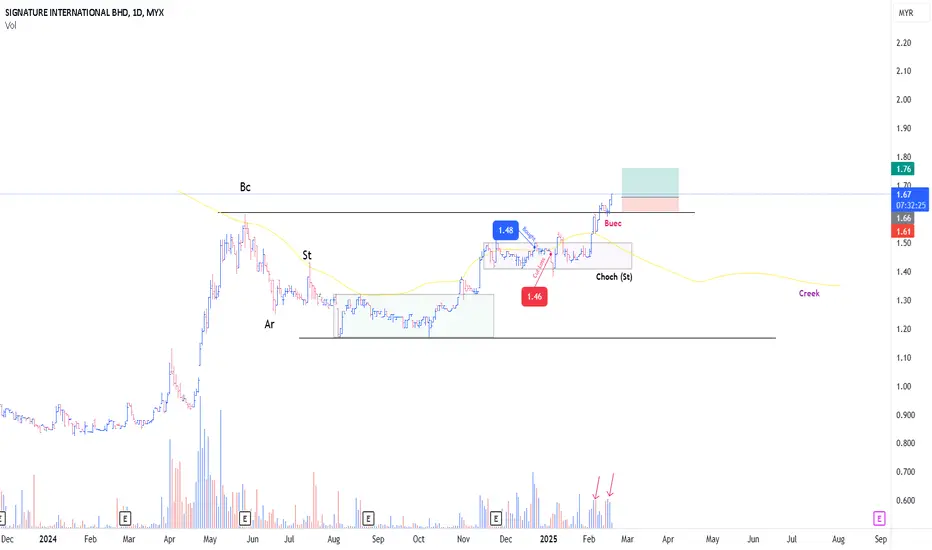
WILL SIGNATURE MARKING UP?A typical Rising Bottom (Re-Accmulation Schematic #2) Despite huge supply on 6th & 14th February, price still trending Up (Red Arrow) In terms of price action, nothing to be pointing as it is very obvious to Wyckoffian So, Based on presumption of BUEC : Tried to get in around 1.63-1.64 , failed Bursa Malaysia has been experiencing a very tough environment past few months, With Foreign Inst became Net Sellers (Consecutively) Ep with SL as attached, Tight Risk Pure Wyckoff
MYX:SIGNLong
by drsyariz
Updated
1
ITMAX GOING FOR MARKUPIt is really difficult to find a setup with Spring A typical Re-Accmulation of Schematic #1 In the background of evaporating supply Combination with SpringBoard Very good setup EP, SL As attached
MYX:ITMAXLong
by drsyariz
Updated
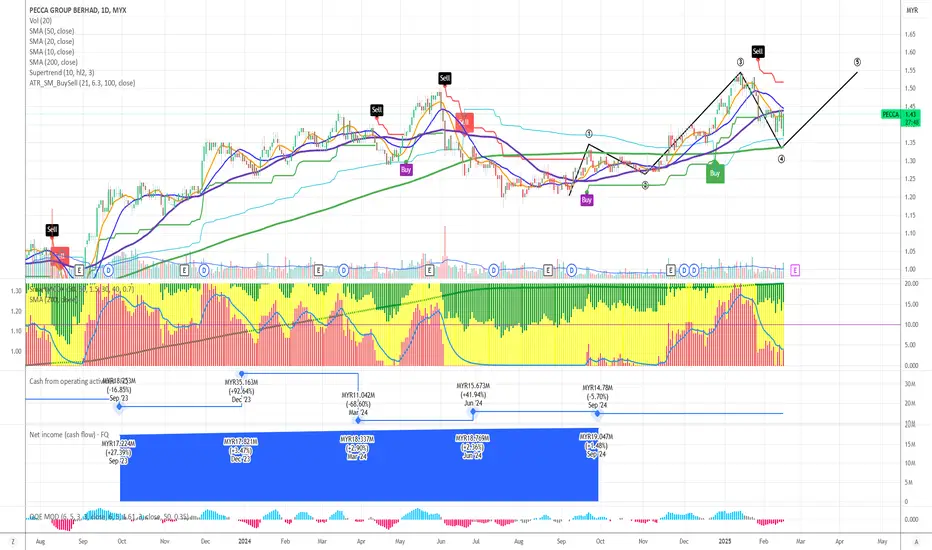
PECCA will create 5th WAVE The current price is 1.43 with a gain of 0.04 (+2.88%). The stock is currently trading at 1.43, up from an earlier value of 1.42. Key technical indicators visible include: Volume (Vol 20): 4.94M shares with 2.89M average Multiple moving averages: SMA 50 (1.44), SMA 20 (1.45), SMA 10 (1.42), and SMA 200 (1.34) Supertrend indicators with values 1.92 and 1.39 The chart shows several buy and sell signals marked throughout the price history, with the most recent being a "Sell" signal near the curre
MYX:PECCALong
by pengamalgelombang
OMESTI - Bullish sentimentThe price has broken above the Kumo, signaling a shift to a bullish trend. Tenkan-sen > Kijun-sen indicates short-term bullish momentum. Chikou Span is above the price, confirming bullish sentiment. The Kumo ahead is thin and turning green, suggesting a potential continuation of the uptrend. NT Level (0.125) held as support, and the price has bounced. Entry: Above 0.150, confirmation if the price closes above with volume. Stop-Loss: Below 0.140. Price may retest 0.140 (support zone). Re-entry op
OLong
by mg6112
SCGBHD - Looking for bullish continuation The price is trading above the Kumo, indicating a bullish bias. Chikou Span is approaching price candles, and a bullish confirmation will occur if it crosses above them. If Golden cross occur, Tenkan-sen (red) crosses above Kijun-sen (blue) confirming a bullish continuation. The price has reached 1.30, which aligns with 0.886 Fibonacci retracement. A temporary rejection at 1.30 suggests that sellers are defending this level. The next key resistance is at 1.33 (Y wave target E). A 52-week high is
MYX:SCGBHDLong
by mg6112
“High-Potential Stock with Strong Growth Catalysts”“Overall, this stock has strong potential. Currently, the price is below the target range, with a low of 0.715. Based on my analysis, I anticipate it will rise to 0.86–0.95. Additionally, key stakeholders, including U Mobile, play a significant role in its growth. With U Mobile’s IPO planned for the end of Q1, I am confident in the current trend and its upward potential.”
MYX:REDTONE
by jimmykok8128
1
Bullish rebound to the upside continuation!MYX:LHI has completed its short-term bearish correction after breaking strongly above the overhead resistance. Short-term bullish momentum is confirmed after 23-period ROC rose sharply above the zero line and formed a bullish divergence. To add on, the stock's major uptrend remain intact since 2022 Oct. Initiate a buy at 0.630 or limit buy at 0.545
MYX:LHILong
by William-trading
GADANG - Turning BULLISH based on ICHIMOKU CLOUD ?GADANG - CURRENT PRICE : RM0.355 GADANG is changing trend from sideways to UPTREND. Take note that the high is getting higher and the low is getting higher. The stock is BULLISH based on ICHIMOKU CLOUD because : i) CHIKOU SPAN is above candlestick ii) Price is above CLOUD iii) CHIKOU SPAN is above CLOUD iv) There is a bullish crossover (TENKAN SEN crosses up KIJUN SEN) - Personally i don't use TENKAN SEN and KIJUN SEN to trading or analysing. ENTRY PRICE : RM0.355 TARGET : RM0.385 , RM0.410
MYX:GADANGLong
by IMRAN_96
Updated
THIS FORECAST FOR SCGBHD COUNTERThis WEEK FORECAST Opportunity for SCGBHD. This setup is my trading idea/plan, if you want to follow: trade at your own risk (TAYOR). Risk Factors: 1. Market conditions, unexpected news, or external events could impact the trade. 2. Always use risk management strategies to protect your capital.
MYX:SCGBHDLong
by TREND-TITAN
TANCO FORECAST THIS WEEK, REENTRY ZONEThis Week FORECAST Opportunity for GOLD. This setup is my trading idea/plan, if you want to follow: trade at your own risk (TAYOR). Risk Factors: 1. Market conditions, unexpected news, or external events could impact the trade. 2. Always use risk management strategies to protect your capital.
MYX:TANCOLong
by TREND-TITAN
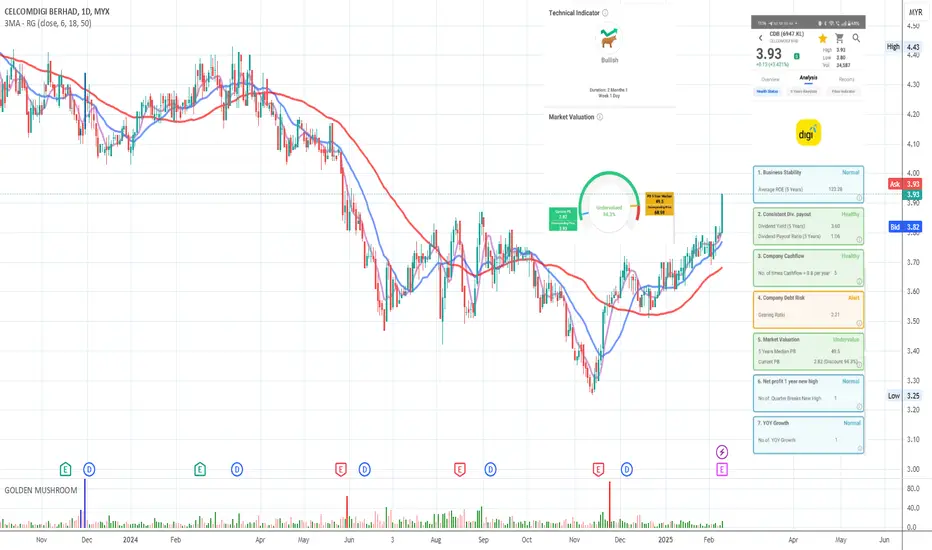
CELCOMDIGI - Under Value !!!!Under Value by 94%. Target TP Fair Value @ RM8.00 Price above EMA 6, EMA 18 & EMA 50 - All Ducks are lining up. Trend Indicator is Bullish.
MYX:CDBLong
by shahmustapha
Supermx, will it be Superman?The resistance around the 1.27 level is quite evident. Currently, the stock appears to be in an overbought condition, with the price closing below its moving average. This raises the possibility of a healthy pullback, but there's also a chance that selling pressure could intensify soon. While others may be focusing on potential dividends and bonus issues, I personally prefer to capitalize on price movements for profits. It's important to invest and trade based on your own strategy and preferenc
MYX:SUPERMXShort
by DSELE99
WILL AUMAS MARKING UP?Based on the context of setup Aumas probably in Phase B I dont see any active Change of Character (Choch) yet However im expecting Choch soon With a Springboard in action (Black circle color) : -A trigger bar today prompted me to intiate position (as attched) -Supply evaporating (reducing vol) Tight SL Pure Wyckoff
MYX:AUMASLong
by drsyariz
Updated
WILL GCB MARKING UP?This is An Atypical Type Of Re-Accumulation Trading Range - ReAccmulation Schematic #2 (Rising Bottom) Blue box : A change of character (Choch) of the stock from Non trending -> Trending environment I bought this stock on 6 & 8 of Jan 2025 however the position ended up cut loss Poor timing Since then, the price action from 21-28/1/25 brought my attention **Red Line (Spring Board Schematic #2) 1st position intiated : 31/1/25 @ 4.26 2nd position added : 5/2/25 @ 4.33 Purewyckoff Sl
MYX:GCBLong
by drsyariz
Updated
KENERGY, what next?Price might just touch the gap and continue to decline. The MACD is still showing a downward trend, indicating further potential downside. Stocks are like mangoes, while you are waiting for them to be ripe, others are eating them with salt. Disclaimer: The mentioned stocks are based solely on personal opinions for educational and discussion purposes only. There are no buy or sell recommendations. Trading involves financial risk, and you are responsible for your own decisions. The author shall
MYX:KENERGYShort
by DSELE99
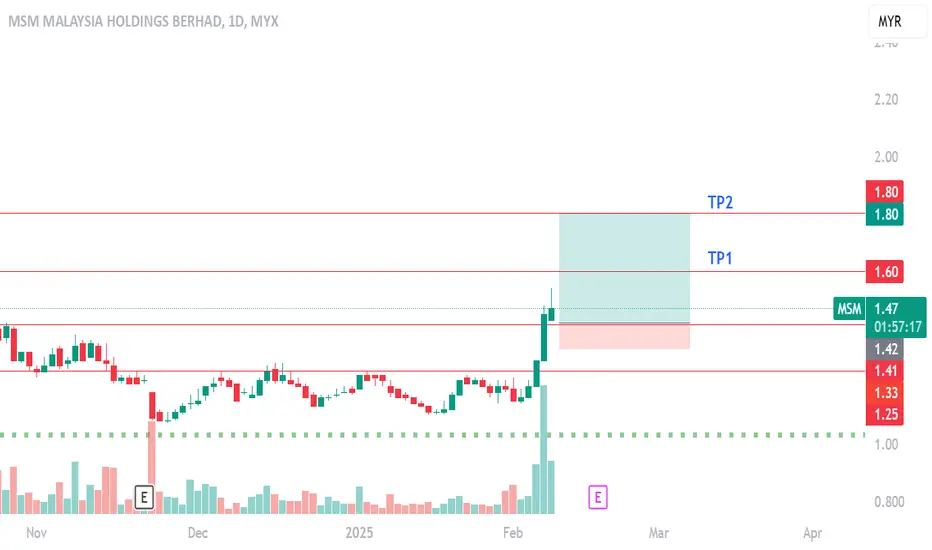
MSM FORECASTThis Weekly FORECAST Opportunity for MSM. This setup is my trading idea/plan, if you want to follow: trade at your own risk (TAYOR). Risk Factors: 1. Market conditions, unexpected news, or external events could impact the trade. 2. Always use risk management strategies to protect your capital.
MYX:MSMLong
by TREND-TITAN
BAUTO, a Purebear stage... The downtrend has been ongoing since mid-July 2024, and while the market has shown persistent bearish pressure. Although the downtrend has been prolonged, these early signs of change could suggest that the market is ready for a shift. It’s important to monitor key support levels and price action closely, as this could be the beginning of a turnaround. While caution is still necessary, the emerging reversal signals could present an opportunity for those watching closely. Patience will be key a
MYX:BAUTO
by DSELE99
MSM, got power or not?There's a potential that the price could simply close the gap and continue its downward movement, especially if it fails to hold key support levels. For the bullish trend to stay intact, the price needs to stay above 1.50. If there’s a pullback and it fails to challenge this level, it could signal further downside. Traders should remain cautious and be prepared for the next move. If the price struggles to maintain 1.50, further downside pressure could follow, so keeping a close eye on price
MYX:MSMShort
by DSELE99
123456789101112131415161718192021222324252627282930313233343536373839404142
…999

Made by humans

Select market data provided by ICE Data Services. Select reference data provided by FactSet. Copyright © 2026 FactSet Research Systems Inc.Copyright © 2026, American Bankers Association. CUSIP Database provided by FactSet Research Systems Inc. All rights reserved. SEC filings and other documents provided by Quartr.© 2026 TradingView, Inc.

SOC 2 CompliantGDPR Compliant
More than a product
  • Supercharts
Screeners
  • Stocks
  • ETFs
  • Bonds
  • Crypto coins
  • CEX pairs
  • DEX pairs
  • Pine
Heatmaps
  • Stocks
  • ETFs
  • Crypto coins
Calendars
  • Economic
  • Earnings
  • Dividends
  • IPOs
More products
  • News Flow
  • Portfolios
  • Fundamental Graphs
  • Yield Curves
  • Options
  • Macro Maps
  • Pine Script®
  • MCP Server
Apps
  • Mobile
  • Desktop
Community
  • Social network
  • Wall of Love
  • Refer a friend
  • Creator program
  • House Rules
  • Moderators
Ideas
  • Trading
  • Education
  • Editors' picks
Pine Script
  • Indicators & strategies
  • Wizards
  • Freelancers
  • Marketplace
Tools & subscriptions
  • Features
  • Pricing
  • Market data
  • Gift plans
Trading
  • Overview
  • Brokers
  • Brokers comparison
  • The Leap
Special offers
  • CME Group futures
  • Eurex futures
  • US stocks bundle
About company
  • Who we are
  • Space mission
  • Blog
  • Help Center
  • Careers
  • Media kit
Merch
  • Tarot cards for traders
  • The C63 TradeTime
Policies & security
  • Terms of Use
  • Disclaimer
  • Privacy Policy
  • Cookies Policy
  • Accessibility Statement
  • Trust Center
  • Security tips
  • Bug Bounty program
  • Status page
Business solutions
  • Widgets
  • Charting libraries
  • Lightweight Charts™
  • Advanced Charts
  • Trading Platform
Growth opportunities
  • Advertising
  • Brokerage integration
  • Partner program
  • Education program
Community
  • Social network
  • Wall of Love
  • Refer a friend
  • Creator program
  • House Rules
  • Moderators
Ideas
  • Trading
  • Education
  • Editors' picks
Pine Script
  • Indicators & strategies
  • Wizards
  • Freelancers
  • Marketplace
Business solutions
  • Widgets
  • Charting libraries
  • Lightweight Charts™
  • Advanced Charts
  • Trading Platform
Growth opportunities
  • Advertising
  • Brokerage integration
  • Partner program
  • Education program
Look FirstLook First