• Products
  • Community
  • Markets
  • Brokers
  • More
Get started
  • Markets
  • /Malaysia
  • /Stocks
  • /Ideas
Sarawak Oil Palms Bhd (MYX: SOP)Current Price: 2.93 MYR The stock has recently shown a strong upward movement, breaking above the 50-day and 100-day moving averages. Consider entering a position if the price stays above the 3.00 MYR level with confirmation from volume. Primary Target: 3.30 MYR (short-term) based on the next resistance level. Stop Loss: 2.75 MYR, slightly below the 100-day moving average to protect against downside risk. Short-Term: (1-3 weeks) — This plan is focused on capturing the immediate price movement
MYX:SOP
by apisjay
SHH Resources Holdings Bhd (MYX: SHH),The stock is trading at 1.33 MYR, it’s above both the short-term and long-term moving averages (as suggested by the red and blue lines). This is generally considered a bullish signal. Confirmation: Ensure the price holds above 1.28 MYR, as it’s the recent low. A further confirmation would be if the stock breaks above the recent resistance level near 1.35 MYR with good volume. Primary Target: 2.10 MYR based on the projected price target from the chart. Partial Profit Target: Consider taking pa
MYX:SHH
by apisjay
MY: AbleGlob Analysis 30.8.24Looking for long position with key level entry at the marked box when pullback happens. Target price at 2.20 And place the SL when price drop below 1.68. Plan your entries with proper management to minimise risk.
MYX:ABLEGLOBLong
by nares85
BERMAZ AUTO BERHAD - [BAUTO]Price Action The stock price is at MYR2.51, showing a gain of +0.07 or +2.87% for the day. The recent price action indicates an uptrend, with the price rising from a recent low near MYR2.38 to its current level of MYR2.51. Bollinger Bands Upper Band: The price is approaching the upper band, which could indicate an overbought condition. Middle Line (SMA): Price is above the middle line, indicating a bullish trend. Lower Band: The lower band remains distant from the current price act
MYX:BAUTOLong
by Sahrin
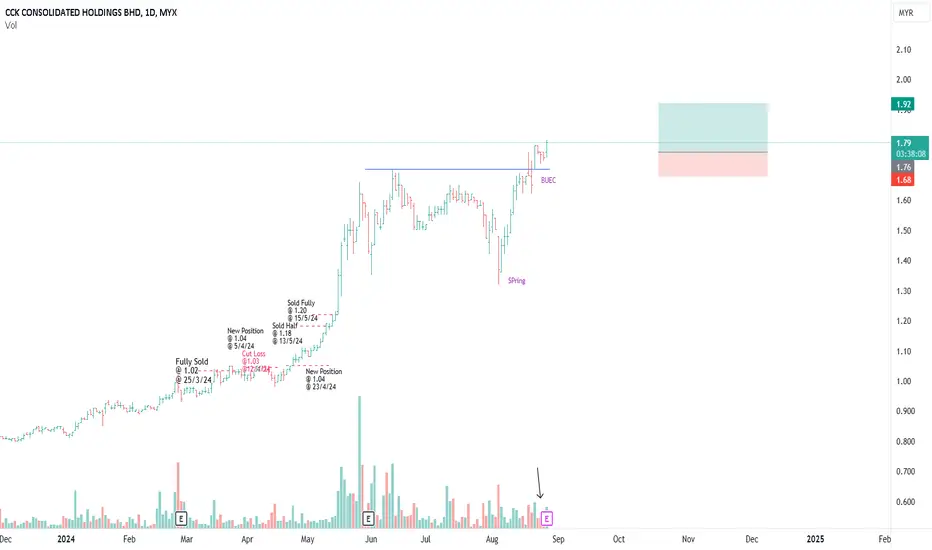
CCK MARKING UPClassic wyckoff Re-Accumulation of Schematic #1 With spring in the house What attracted me the most, is that, there was an absoprtion past 2 days as evidence by the volume (Black Arrow) With breakout today accompanied with huge vol, this is a sBar (Siginificant Bar) as mentioned by Prof Roman in his teaching. I called it Timing Bar Thus, i went with a heavyweight position on this one Risk is always respected in view of that, i humbly initiated position as attached
MYX:CCKLong
by drsyariz
Updated
MRCB - Require an aggressive bullish momentum.N wave with E, V, N & NT projection. Currently price and Chikou Span still below Tenkan Sen, Kijun Sen & down Kumo, considering the market still in bearish position. Require an aggressive bullish momentum to push the price upward with Tenkan Sen as an immediate resistance. if the price breaks above the Kumo and the Chikou Span confirms the breakout, the trade might develop into a stronger bullish trend and towards the completion of the Y wave. R1 - 0.550 (Tenkan Sen) R2 - 0.570 S1 - 0.520 S2 - 0
MYX:MRCBLong
by mg6112
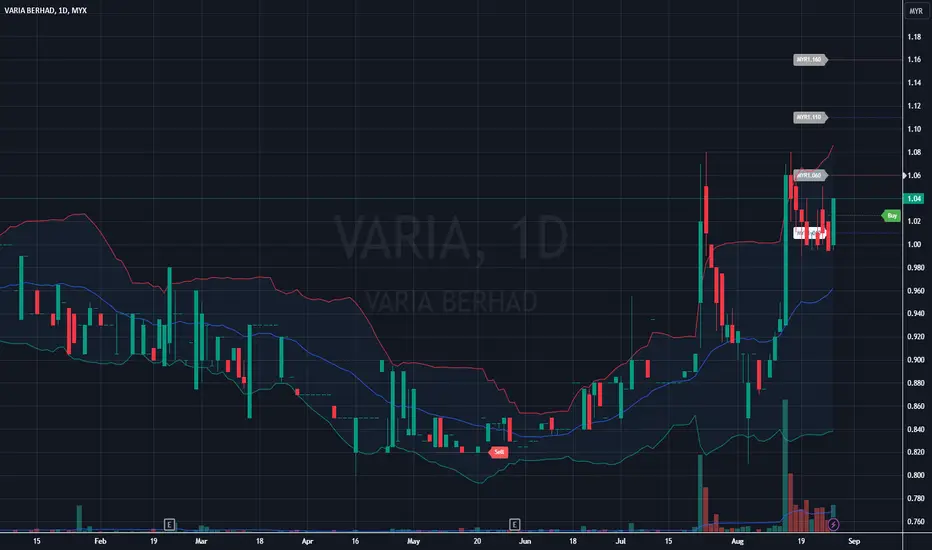
VARIA BERHAD - [VARIA]Overall Trend : The stock has shown a strong bullish trend since mid-June, with the price rising from around MYR0.84 to current levels above MYR1.00. Price Action : The stock experienced a significant spike in mid-July, reaching a high around MYR1.08. After a pullback, it has recently made another strong move upward in August. Current price is hovering around MYR1.04, showing continued bullish momentum. Volume : Volume spikes coincide with major price movements, particularly
MYX:VARIALong
by Sahrin
Updated
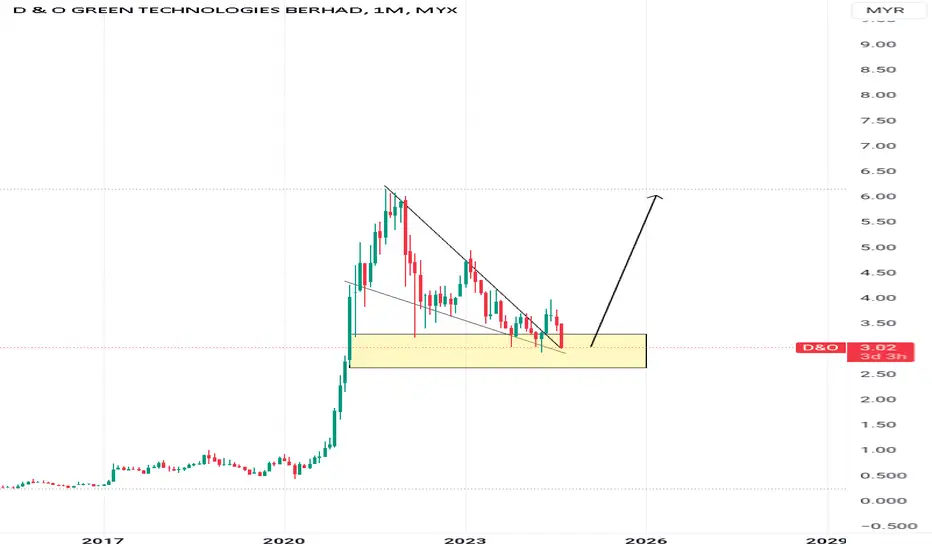
POSSIBLE 100% MOVEMENTThis stock currently on clear uptrend. Now making a pattern called bullish pennant. Price now at 0.5 - 0.618 fibbonaci level from starting price that make them move aggressively upward. Target now at RM6.00 with suitable risk reward ratio. Drop below fibbonaci level could be failed setup
MYX:D&OLong
by haikalbakri
1
PGLOBE - Analysis on price movementN wave with NT & N projection. The current price is at MYR 0.315, which is just above the Kumo. The price recently tested the Senkou span B, finding support at this level. This positioning suggests a neutral to slightly bullish outlook, with the potential for a rebound if the price continues to stay above the Kumo. The Kumo is bullish ahead, albeit thin, indicating that while there may be a slight upward momentum, it’s not strongly supported. The cloud's future projection is bullish, providing
MYX:PGLOBELong
by mg6112
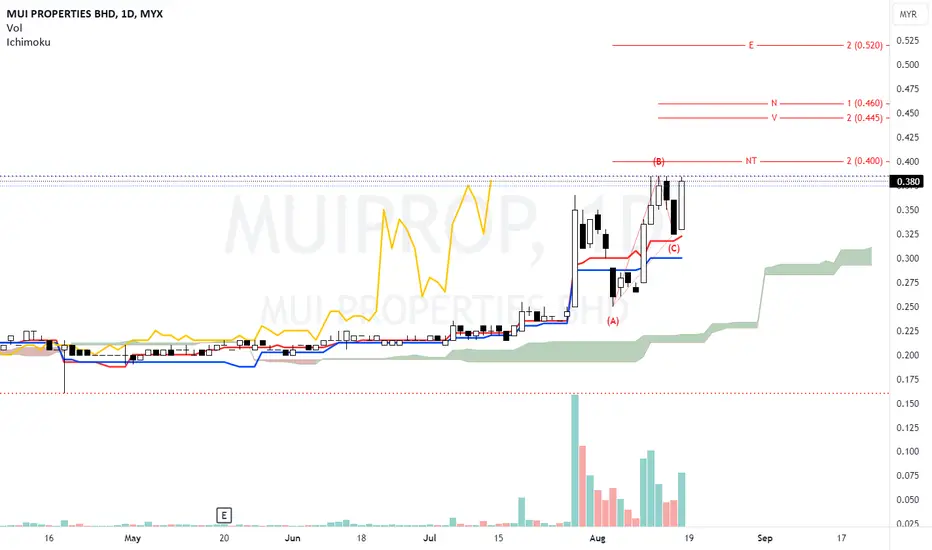
MUIPROP 1D - Potential price targetN wave with E, N, V & NT projection. 4 times hit 52w high but failed to break the line. Is there a strong momentum to break 52w high and then push the price to the target price. R - 0.385 (52w high) S - 0.325 Note: 1. Analysis for education purposes only 2. Trade at your own risk
MYX:MUIPROPLong
by mg6112
Updated
PERDANA - Analysis on price movementY wave, target (E) with Entry & Exit strategy. A golden cross has occurred but price dropped into up Kumo. R - 0.475 S - 0.415 (Senko span B) Note: 1. Analysis for education purposes only. 2. Trade at your own risk.
MYX:PERDANALong
by mg6112
Updated
CUSCAPI - Potential target analysis for price movementN wave with E, N & NT projection. The current price is at MYR 0.270, sitting below the Kumo, which suggests bearish momentum. The price recently attempted to break above the Kumo but was rejected, indicating the cloud is acting as a significant resistance level. If the price breaks above the 0.285 level with strong volume. This would indicate the price has the potential to reach the N and E targets. R - 0.285 S1 - 0.25 S2 - 0.23 Note: 1. Analysis for education purposes. 2. Trade at your own r
MYX:CUSCAPILong
by mg6112
SDS PROBABLY MARKING UPAs plotted, This looks like Typical Re-Accmulation (Rising Bottom, Schematic #2) What interesting to me, is that the incoming supply is reducing and evaporating as evidence by vol @ 29/7/24 (Black Arrow) -As mentioned by David weiss : Probably this is The Contraction Thus i humbly initiated my position as attahced Pure Wyckoff, Anything can happen
MYX:SDSLong
by drsyariz
Updated
YTLPOWR, the DC theme still on?The stock remains below the downtrend line, and the MACD is still in a bearish crossover. While both the MACD and RSI are showing positive divergence, the strength of this signal remains uncertain. For a sustained move, the price needs to break out of the current downtrend; otherwise, it may just be suitable for a quick FIFO trade. It's essential to seek at least three confirmations before making a move—anything less is simply gambling. Disclaimer: The mentioned stocks are based solely on
MYX:YTLPOWR
by DSELE99
GENETEC, what next?Despite the bearish signals, many are still attempting to catch the falling knife that is GENE. The MACD first registered a downward crossover at the end of June 2024, and the RSI is currently in the oversold zone. However, it's crucial to remember that an oversold condition doesn't automatically make the stock a good buy. Oversold and overbought levels don't always signal an imminent reversal; sometimes, they reflect the underlying strength of the current trend. Disclaimer: Please be infor
MYX:GENETECShort
by DSELE99
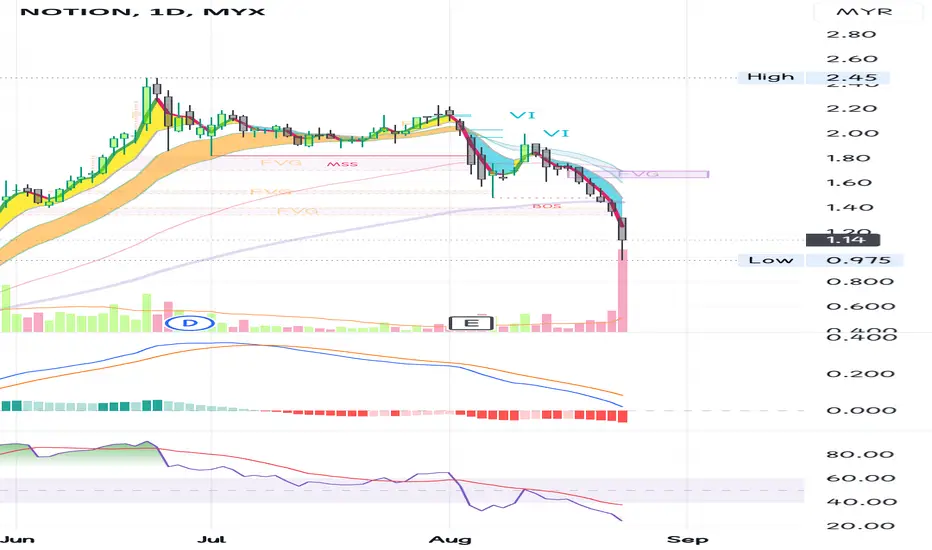
NOTION the end game?The stock has encountered a MACD bearish crossover and has dipped below the most of the EMA lines. These indicators suggest a bearish trend, making it prudent to avoid this stock for the time being. Make sure you're in the RIGHT SECTOR (right place at the right time) like FengShui 🤩 When the wind is not blowing, no point sitting there waiting, position ourselves in place of most opportunities. When the tide comes in, all the boat will rise (unless that boat is a sinking boat - poor quality s
MYX:NOTIONShort
by DSELE99
MITRA - Potention on price movement analysisMITRA 1D Y wave, target (E) within stipulated time. Reaching this target is require a bullish momentum strong enough to break 52w high. N wave with N, V & NT projection. Price is currently inside up Kumo, indication a consolidation phase with potential for a breakout. A golden cross has occurred which is generally a bullish signal, though slightly weaker since it occurs within the cloud. This signal is stronger if price manages to break above the up Kumo. R1 - 0.345 (senko span A) R2 - 0.36 R3
MYX:MITRALong
by mg6112
AZRB - Potential price movement analysisAZRB 1D, Y wave, target (E) within stipulated time. The price must break 52w high to reach this target (E), indicating the potential bullish breakout. N wave with E, N, V & NT projection. Since the price is below up Kumo, a strong bullish momentum is required to break through identified resistance levels. R1 - Tenkan sen R2 - Kijun Sen R3 - 0.295 (Senko span B S - 0.23
MYX:AZRBLong
by mg6112
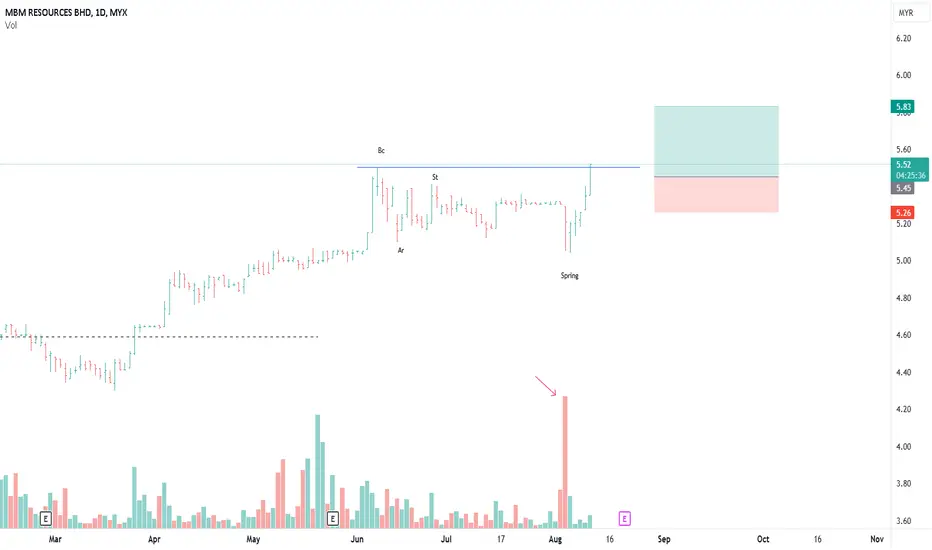
MBMR GOING FOR MARK UP In the background of plummeting KLCI (Bursa Index), this stock rising above Classic Type 1 Re-Accmulation Price succesfully overcome the suply on 5/8/24 (red arrow) -Wyckoffian call it 'COMPOSITE OPERATOR ROTATION' Plus, with the 'Spring' ! I put my trust on the setup position as attached PureWyckoff Anything can happen
MYX:MBMRLong
by drsyariz
Updated
PERDANA PETROLEUM BERHAD - [PERDANA]Bollinger Bands : Upper Band: The price recently touched the upper Bollinger Band, indicating that the stock might be overbought in the short term. Middle Band (SMA): The price is currently above the middle band, which typically acts as a support during an uptrend. Lower Band: The price has moved away from the lower Bollinger Band, indicating a reversal from recent lows. Volume Analysis : There's been an increase in volume on the latest green candlestick, which is a bullish sign, as it
MYX:PERDANALong
by Sahrin
Updated
1
SKBSHUT 1D - Potential price movement analysisY wave, target (F) within stipulated range. Price still above up Kumo, if there is a strong momentum and the occurrence of a golden cross, then the potential for the price to continue upward will occur. The price needs to break turning point (B) and 52w high to reach the target price. R1 - 1.00 (Kijun sen) R2 - 1.06 R3 - 1.20 (52w high) S1 - 0.915 (Senko span A) Note: 1. Analysis for education purposes only. 2. Trade at your risk.
MYX:SKBSHUTLong
by mg6112
UNIQUE - Analysis on price movementN wave with E, N & NT projection. A golden cross just occurred above up Kumo and if the strong momentum keep continue, the price shall break 52w high R - 0.455 (52w high) S - 0.39 Note: 1. Analysis for education purposes only 2. Trade at your own risk
MYX:UNIQUELong
by mg6112
SEALINK 1D - Potential price targetN wave with E, N, V & NT projection. Price need to break 52w high to reach all target. A golden cross just occurred above up Kumo and may a good sign to have momentum to push the price upward. R - 0.415 (52w high) S- 0.345 Note: 1. Analysis for education purposes only 2. Trade at your own risk
MYX:SEALINKLong
by mg6112
ATAIMS - Potential on price movementY wave targeted (E) within stipulated time. A death cross has occurred and need strong momentum to breakout minor downtrend line if price need to continue upwards. Expected golden cross to be happen if momentum keep upward and price must breakout 52w high to reach (E) and complete the Y wave. R1 - Senkou Span B R2 - Tenkan Sen S - 0.34 Note: 1. Analysis for education only 2. Trade at your own risk
ALong
by mg6112
Updated
123456789101112131415161718192021222324252627282930313233343536373839404142
…999

Made by humans

Select market data provided by ICE Data Services. Select reference data provided by FactSet. Copyright © 2026 FactSet Research Systems Inc.Copyright © 2026, American Bankers Association. CUSIP Database provided by FactSet Research Systems Inc. All rights reserved. SEC filings and other documents provided by Quartr.© 2026 TradingView, Inc.

SOC 2 CompliantGDPR Compliant
More than a product
  • Supercharts
Screeners
  • Stocks
  • ETFs
  • Bonds
  • Crypto coins
  • CEX pairs
  • DEX pairs
  • Pine
Heatmaps
  • Stocks
  • ETFs
  • Crypto coins
Calendars
  • Economic
  • Earnings
  • Dividends
  • IPOs
More products
  • News Flow
  • Portfolios
  • Fundamental Graphs
  • Yield Curves
  • Options
  • Macro Maps
  • Pine Script®
  • MCP Server
Apps
  • Mobile
  • Desktop
Community
  • Social network
  • Wall of Love
  • Refer a friend
  • Creator program
  • House Rules
  • Moderators
Ideas
  • Trading
  • Education
  • Editors' picks
Pine Script
  • Indicators & strategies
  • Wizards
  • Freelancers
  • Marketplace
Tools & subscriptions
  • Features
  • Pricing
  • Market data
  • Gift plans
Trading
  • Overview
  • Brokers
  • Brokers comparison
  • The Leap
Special offers
  • CME Group futures
  • Eurex futures
  • US stocks bundle
About company
  • Who we are
  • Space mission
  • Blog
  • Help Center
  • Careers
  • Media kit
Merch
  • Tarot cards for traders
  • The C63 TradeTime
Policies & security
  • Terms of Use
  • Disclaimer
  • Privacy Policy
  • Cookies Policy
  • Accessibility Statement
  • Trust Center
  • Security tips
  • Bug Bounty program
  • Status page
Business solutions
  • Widgets
  • Charting libraries
  • Lightweight Charts™
  • Advanced Charts
  • Trading Platform
Growth opportunities
  • Advertising
  • Brokerage integration
  • Partner program
  • Education program
Community
  • Social network
  • Wall of Love
  • Refer a friend
  • Creator program
  • House Rules
  • Moderators
Ideas
  • Trading
  • Education
  • Editors' picks
Pine Script
  • Indicators & strategies
  • Wizards
  • Freelancers
  • Marketplace
Business solutions
  • Widgets
  • Charting libraries
  • Lightweight Charts™
  • Advanced Charts
  • Trading Platform
Growth opportunities
  • Advertising
  • Brokerage integration
  • Partner program
  • Education program
Look FirstLook First