• Products
  • Community
  • Markets
  • Brokers
  • More
Get started
  • Markets
  • /Malaysia
  • /Stocks
  • /Ideas
BDTLEntry: RM0.275–0.31 | SL: RM0.25 (below ATL = abort) T1: RM0.395 (52W high) | T2: RM0.50 | T3: RM0.69 (analyst TP) Near ATL with improving earnings. EPF/Tabung Haji as floor. HV transmission segment = data centre pipeline. YTD −22.4% = laggard reversion. Next QR 1 Jun = catalyst.
MYX:MRCBLong
by amirulshah
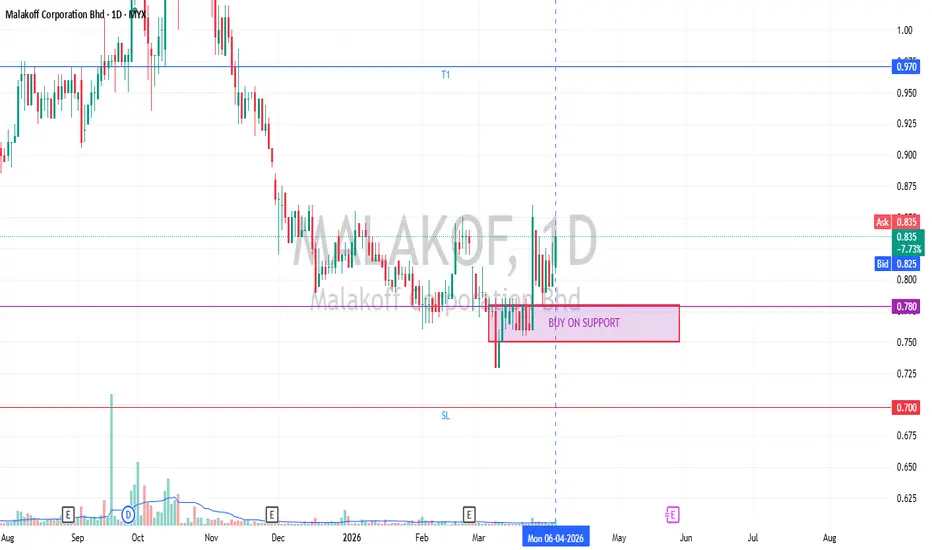
BDTLEntry: RM0.75–0.80 | SL: RM0.70 T1: RM0.97 (analyst consensus TP) | T2: RM1.10 Income + recovery. Q loss is likely one-off; EBITDA solid RM1.57B. Data centre power demand secular. Div yield 4.59% provides income floor. Next QR 26 May = catalyst check.
MYX:MALAKOFLong
by amirulshah
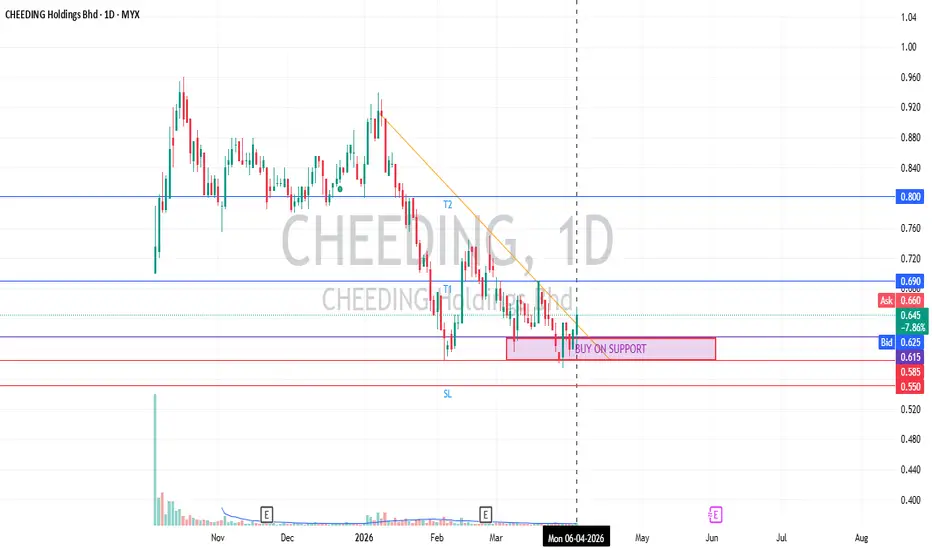
BDTLEntry: RM0.585–0.615 (support zone) SL: RM0.550 | T1: RM0.69 (52W high) | T2: RM0.80+ (analyst initiation re-rate) Analyst Buy initiation Apr 6 = fresh catalyst. TNB contract pipeline steady. Data centre substation demand structural. Add on confirmed new contract announcements.
MYX:CHEEDING
by amirulshah
UPTRENDEntry: RM0.33–0.35 (at support = 52W high area consolidation) SL: RM0.30 (daily close below; Iran peace = exit catalyst) T1: RM0.40 (+14%) | T2: RM0.50 (+43%) if oil sustains >USD100
MYX:VELESTO
by amirulshah
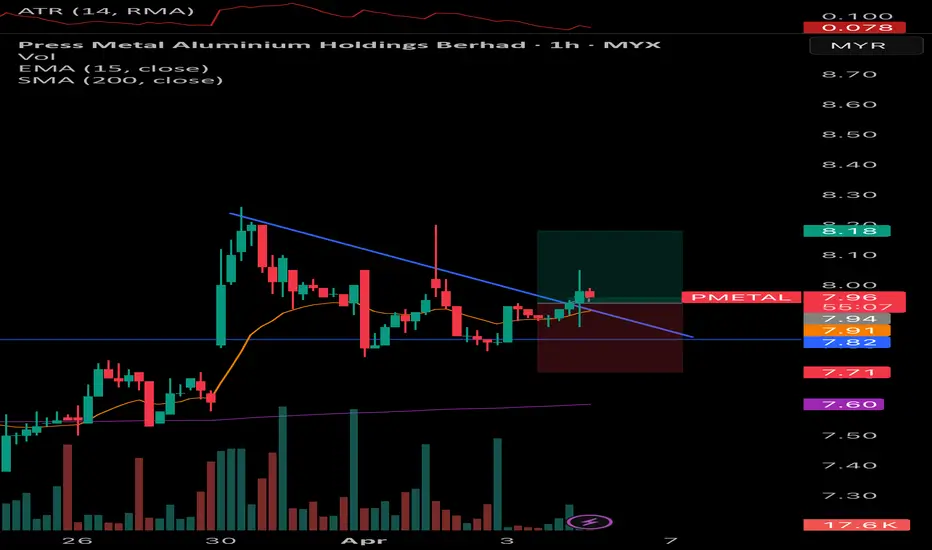
PMETAL TRADE Price recently broke a multi-week resistance. We could see there’s a big red candle but very low volume on the first rebound. On the second rebound, there’s a doji candle with very high volume indicating that bulls are trying to push the price higher. The next candle is a big bullish engulfing candle with low volume indicating that sellers are out of the market and unwilling to push the price lower. Stops is 1 atr below and tp is before the highs.
MYX:PMETALLong
by ikafrs
Elliott Wave Analysis: VELESTO Stock Price MovementVELESTO has completed wave (II) or wave B. It currently appears to be forming wave 1 of wave (III) or wave C. For VELESTO to retrace to wave 2 of the wave (III) uptrend, wave 1 must first be completed, which is currently in progress. Wave 2 may retrace to the Fibonacci level of wave 2, potentially falling below 50% of wave 1, and may conclude with a zigzag pattern. Wave (III) or wave C may complete with five minor waves or, alternatively, wave C may conclude with an ending diagonal pattern. This analysis is provided solely for Elliott Wave learning purposes and does not constitute a recommendation to buy or sell. Please perform your own technical analysis.
MYX:VELESTO
by AdamIdris2
Elliott Wave Analysis: IJM Stock Price MovementIJM has completed wave (1). Currently, it appears to be completing wave C of wave (2) with an ending diagonal pattern. For IJM to continue the uptrend, it must first break Resistance 1. Wave (2) of IJM may dip below the discounted zone but should not fall beyond wave 'e' in the circle. This analysis is intended solely for Elliott Wave learning purposes and is not a recommendation to buy or sell. Please conduct your own technical analysis.
MYX:IJM
by AdamIdris2
TOP GLOVE EW analysisTOPGLOV maybe completed the wave (V) and now in progress to complete wave 1. I want to see the price retrace to wave 2 and reverse to continue the uptrend to go for wave 3. This is just for EW learning. Not recommended to buy or sell. Do you own TA.
MYX:TOPGLOV
by AdamIdris2
SDG TRADE IDEA Price broke a multi week resistance. With high volume on the breakout and decreasing volume as it pullbacks to the level, there’s a possibility to rebound from the area. On the last candle price formed a hammer candle. A bullish engulfing candle would mark our entry. Stops is 1 atr below the lows and tp is just before the resistance giving us a pretty decent rr ratio.
MYX:SDGLong
by ikafrs
zone sauk - predict price direction only zone sauk - predict price direction only rbs naked chart pva duration to close monitor - 2 to 4 weeks
A
by habb288
Predict price direction only ......naked chart pva rbs zone sauk time duration to monitor 2 - 4 week
MYX:CAPITALA
by habb288
99SMART TRADE IDEA Price came back to a multi-month level. On the 4hr chart, there's a double bottom which is a bullish reversal pattern. The red candle with a long wick and bullish engulfing candle further reaffirms the potential reversal to the upside and that marks our entry. Looking at the fundamentals, 99SMART is a defensive stock since it's in the consumer staples industry. People can stop buying the latest Iphone etc but they cant stop buying essentials like rice and eggs. With the geopolitical events that are unfolding right now, this is a pretty good and safe bet especially with the fact that they support SARA offered by the Msian government. They also have a high inventory turnover ratio supported by their own distribution center which is good for a company like 99SMART that plays the volumes game. However thin margins and rising oil prices are the risk worth noting although that could be solved by the fact that 99SMART probably buys in large volumes from suppliers thus getting more rebates and discounts.
MYX:99SMARTLong
by ikafrs
MNHLDG TRADE I already closed this trade so i'll just treat it as a trade journal instead of idea. On the 4hr chart price broke a multiday resistance level with high volume. Price pulled back and at the bottom there's a red candle with quite high volume but has a long wick. This indicates that while sellers are trying to pushing the price down, buyers are absorbing every sell order refusing to let price go down even further which means there's a potential upside. The next candle is a bullish engulfing candle which indicates our entry. Stops is 1 ATR below the low and tp is right before the next resistance.The RR ratio is only 1:1 which is not good so i'll look into and re-analyse where i put my stops after this.
MYX:MNHLDGLong
by ikafrs
Accumulation or re-distribution?Lets see if the price touching RM0.620 as last support area.
MYX:MBSB
by RAR-BSJ
PULLBACKExpected pullback at area RM0.560. If rebound, then it is one of the best entry. #TAYOR
MYX:THPLANT
by RAR-BSJ
VSTECS LIKELY CONT ITS MARK UPThis is an Atypical Reaccmulation pattern of Schematic #2 (Need to zoom out the chart) 1/ Influx of demand (Green Arrow) 2/ Bar 9march26 shows dysharmony between effort & result , someone had bought loads of shares during that day Chart is too straightforward tight risk, might be adding if things BO here onwards
MYX:VSTECSLong
by drsyariz
Updated
Artroniq possible uptrend months to comeJust my 2 sen opinion, this counter already touch golden fibo on 2.618 and now it's consolidate and creating double top and possible ascending triangle (bullish). Might be possible to enter when touch lower trend line of the ascending triangle or just wait for confirmation once confirm breakout the double top line with volume. Reminder at E wave there are 3 possible path whether will break out the top or rebound make retracement and continue push higher or will touch lower trend line and break the lower trend line. Regards
MYX:ARTRONIQLong
by Measat
DAYANG Risk-Reward Attractive For Position TradersDAYANG - CURRENT PRICE : RM1.85 DAYANG is showing an improving position trading setup as momentum begins to shift after a prolonged downtrend. The RSI (21-day period) is now spending more time above the 50 level (highlighted in the orange rectangles), which previously led to a significant bullish expansion. A similar scenario may be developing again, suggesting the downtrend phase has likely ended and accumulation is underway. From a trend perspective, EMA 50 has crossed above EMA 200, forming a golden cross — a strong medium-term bullish signal. The last golden cross in August 2022 (look at orange circle) preceded a sustained uptrend, and the current structure appears to be mirroring that behavior. Price is also holding above the rising trendline, reinforcing the bullish bias. Technical risk-reward remains attractive for position traders as price consolidates near the moving averages with limited downside. Trading Plan (Position Trade): 🔥Buy Zone: Current levels / minor pullback 🔥TP1: RM2.25 (21.62%) 🔥TP2: RM2.55 (37.84%) 🔥Support / Invalidation: 1.67 (-9.73%) --- (February 2026 bullish harami pattern low) As long as price holds above 1.67, the structure favors trend continuation higher, with momentum expected to expand similar to previous RSI (21) above 50 phases.
MYX:DAYANG
by IMRAN_96
DIALOG MYX - TRADE IDEADialog opens this week with a huge gap up to the upside with significant volume and simultaneously broke the 4hr resistance. Price pulled back and filled the gap. Dropping to the 1hr chart there's a double bottom with an engulfing candle on the second bottom that marks our entry. stops is 1 atr below lows and tp is around 1.3 rr. late post so already got out of the trade.
MYX:DIALOGLong
by ikafrs
MN HOLDINGS - Selling Pressure Exhausted?MN HOLDINGS - CURRENT PRICE : RM1.52 Company profile : MN Holdings Bhd is a competent solution provider specializing in infrastructure utilities construction, with a primary focus on the power industry in Malaysia. It offers engineering services and solutions, supported by the necessary machinery, labor, and expertise for successful project execution. The Group mainly serves customers in the power, gas, sewerage, and telecommunications sectors within Malaysia. Its operations are organized into main reportable segments, including underground utilities engineering services and solutions; substation engineering services and solutions, including trading and supplying; and investment holding and management services. The majority of revenue is generated from the substation engineering segment. TECHNICAL VIEW : MN Holdings is currently in a healthy medium-term uptrend and has pulled back to a high-probability support zone. Why this setup looks attractive: 1️⃣ EMA 200 Reversal Zone Price is trading near the EMA 200, which has acted as a strong dynamic support previously (green highlighted area). Past pullbacks to this level have led to rebounds. 2️⃣ Volume Expansion Recent candles show higher trading volume (look at red arrow), suggesting institutional interest / strong participation near support — often seen before a price rebound. 3️⃣ RSI at Oversold Area (~30) RSI is currently in the oversold zone. Historically, every time RSI reached this level, price rebounded higher (look at orange circles). This increases the probability of a technical bounce. Trade Plan (Swing Setup): 🟢 ENTRY PRICE : RM1.50 - RM1.52 🎯 Target 1: EMA 50 around RM1.66 🎯 Target 2: Previous resistance near RM1.80 🛑 Invalidation / Support: RM1.40 (strong horizontal support) Summary : Price is resting near strong support (EMA 200 + horizontal support), selling pressure looks exhausted (oversold RSI), and buyers are stepping in (high volume). This creates a favourable risk–reward setup for a technical rebound. 📌 Always manage risk and follow your trading plan. This is a technical view, not financial advice.
MYX:MNHLDGLong
by IMRAN_96
Updated
ANNJOO new trading planCurrent price:RM0.60 Entry zone:RM0.595–0.615 (accumulate at current level) Add position:RM0.63 on confirmed breakout with volume Target 1:RM0.65 (immediate resistance — +8%) Target 2:RM0.76 (analyst consensus target — +26%) Target 3:RM0.85–0.90 (infrastructure super cycle re-rating — +42–50%) Stop loss:RM0.555 (below RM0.565 key support — -7.5%) Risk/Reward~1:3.5Timeframe4–8 weeks swing trade ⚡ Key Adjustments vs Previous Plan Strong momentum confirmation. At RM0.60, ANNJOO has already broken above the earlier resistance zones of RM0.565 and RM0.595 — those levels now flip to support. The stock has re-rated from RM0.44 to RM0.60 — a 36% move — suggesting institutional buying is already in play, likely front-running the Penang LRT contract and infrastructure newsflow. Don't chase the spike — at RM0.60, the stock has already made a significant run. Wait for either a shallow pullback to RM0.595 or a confirmed breakout above RM0.63 before adding new positions. Stop loss adjusted upward — set at RM0.555, just below the RM0.565 former resistance-turned-support. A close below this level on volume signals the breakout has failed. 📌 Tactical Notes Scale in carefully — buy first tranche at RM0.595–0.610, second tranche only on RM0.63 breakout Volume is key — any breakout above RM0.63 must be accompanied by above-average volume to be valid; low-volume breakouts tend to fail Penang LRT catalyst — any Bursa announcement linking ANNJOO to the Penang LRT steel supply contract would be an immediate re-rating event. Set a Bursa alert now Steel price tracker — monitor China HRB400 rebar prices daily. ANNJOO's margins move directly with regional steel prices Book partial profits at RM0.65 — sell 30% of position at Target 1, hold the rest for RM0.76 and beyond Post-results play — next quarterly results release is a key binary event. If losses narrow significantly or a return to profit is announced, expect a gap-up 📊 Revised Risk/Reward Summary Stop loss hitRM0.555-7.5% Target 1 (near-term)RM0.65+8.3% Target 2 (analyst target)RM0.76+26.7% Target 3 (infrastructure re-rating)RM0.85–0.90+41–50% Bull case (contract wins + profitability)RM1.00++66%+ 🔑 Key Catalysts to Watch Penang LRT steel contract win🔺Strong immediate re-rating Q3 2025 loss narrowing🔺 Positive earnings momentum Government local steel mandate🔺 Structural demand floor China rebar price surge🔺 Margin recovery Power tariff increase🔻 Key downside risk Chinese steel dumping escalation🔻 Margin compression
MYX:ANNJOOLong
by amirulshah
THPLANT is breaking the channelTH Plantations Berhad is an investment holding company under Lembaga Tabung Haji that cultivates oil palm in Malaysia and Indonesia, processes fresh fruit bunches, and markets crude palm oil, palm kernel, and FFB. It also operates a Forestry segment engaged in rubberwood harvesting. The fundamental picture is genuinely improving after years of earnings pressure. Net income surged 270% quarter-on-quarter to RM27.08 million in the most recent quarter, versus RM7.32 million the quarter before, with EBITDA standing at RM300.64 million and an EBITDA margin of 32.60%. Valuation is attractive. Simply Wall St estimates the stock is trading at 75.1% below their estimate of fair value TradingView, making it one of the most undervalued pure-play plantation stocks on Bursa. The forward P/E is approximately 4.42x — deeply cheap relative to regional and global peers. The company owns approximately 38 estates and six mills across Terengganu, Pahang, Johor, Negeri Sembilan, Sabah, Sarawak, and Indonesia Yahoo Finance — a large and diversified asset base. The key risk is debt load tied to Tabung Haji's historical restructuring, and any future CPO price reversal would directly compress earnings. THPLANT is currently priced at RM0.555, with a beta of 1.11 and weekly volatility of 1.80% — relatively low volatility compared to the broader market, suggesting institutional accumulation rather than speculative trading. Investing.com Key technical levels: Three near-term catalysts that could re-rate the stock higher: Dividend play — ex-date April 8, 2026. TH Plantations announced on February 26, 2026 a final single-tier dividend of 3.00 sen per share for FY2025, with ex-date April 8, 2026, entitlement date April 9, and payment on April 30, 2026. This creates an immediate buy window — investors will accumulate before the ex-date to qualify. Growing dividend trend. The dividend has been progressively increased from 1.5 sen in 2022, to 2 sen in 2024, and now 3 sen for FY2025 — translating to a forward yield of approximately 5.0–5.7% at current prices. Forum discussions highlight the possibility of a 4–5 sen dividend for FY2026 if CPO prices remain elevated. FCPO surge tailwind. With FCPO at RM4,657–4,774 per tonne and analysts forecasting an average of RM4,200/tonne for 2026, THPLANT's upstream-focused business model means every RM100/tonne increase in CPO directly translates into meaningful earnings uplift given its 38 estates. Current price:RM0.66 Entry zone: RM0.655–0.670 (current level, accumulate on dips) Add position: RM0.68 on confirmed breakout with volume Target 1: RM0.70 (immediate psychological resistance) Target 2: RM0.75 (short-term swing target) Target 3: RM0.80–0.85 (if FCPO sustains above RM4,500 + dividend momentum) Stop loss: RM0.625 (below RM0.63 support zone) Risk/Reward~1:2.5 Timeframe3–6 weeks (dividend ex-date April 8 + FCPO tailwind)
MYX:THPLANTLong
by amirulshah
Will ANNJOO change to Uptrend?Ann Joo Resources Berhad is Malaysia's leading steel producer specialising in long steel products for the construction and infrastructure sectors, operating through an integrated Blast Furnace–Electric Arc Furnace (BF-EAF) hybrid technology — the first and only such combination in Southeast Asia — giving it a structural cost advantage over pure EAF peers. The fundamentals are currently a turnaround story rather than a stable earner. Net losses deepened to RM54 million in Q2 2025 and cumulative losses for the first half of FY2025 reached RM132.9 million, with revenue falling 13.55% year-on-year, primarily due to lower selling prices across upstream and downstream steel divisions. However the recovery thesis hinges on two things. First, Malaysia's rebar prices staged a significant rebound from late July 2025 onwards, tracking Chinese steel price movements. Bursa Malaysia Second, ANNJOO secured a major RM297.9 million contract from Tenaga Nasional Berhad for the design and build of ECRL feeder station electrification works — marking its entry into the utility-infrastructure sector, with TA Securities maintaining a Buy call and a target price of RM1.64. As of March 5, 2026, the stock was trading at RM0.44 TRADING ECONOMICS, suggesting the market is still pricing in uncertainty, which creates potential upside if the recovery materialises. ANNJOO is currently trading at RM0.675, having fallen 3.60% week-on-week and 4.29% month-on-month, with a one-year decline of 29.30%. The stock's beta coefficient stands at 1.99 — meaning it is nearly twice as volatile as the broader market. Key technical levels to watch: Support levels: RM0.605 and RM0.645 . Resistance levels: RM0.725 and RM0.765 , with Mercury Securities noting that a breakout above the 50-day EMA triggered a bullish signal when volume surged. The all-time low was RM0.40, recorded on March 19, 2020, which acts as the deepest structural support. The all-time high was RM4.335. Analyst consensus target: RM0.76 per share based on current analyst estimates. Three near-term newsflow drivers that could re-rate the stock: Penang LRT — analysts highlight that ANNJOO is ideally positioned to supply steel for the Penang LRT project, given its main steel plant in Prai, Penang — just 6km from the project hub and 4 minutes from Penang Port. Infrastructure supercycle — Malaysia's construction market is being driven by major government investments in highways, rail networks, ports, and airports, with Kuala Lumpur, Penang, and Johor Bahru attracting significant infrastructure spending in 2026. Localisation policy — the government is actively working with the Construction Industry Development Board and Works Ministry to mandate greater use of local steel in government projects FinancialContent — a direct tailwind for ANNJOO as the dominant domestic long-steel producer. Risk: The increase in power tariffs announced in late 2024 remains a burden on the iron and steel sector , as EAF-based steelmaking is electricity-intensive. This is the key headwind to watch. Entry zone: RM0.67–0.69 (on breakout + volume) Add position: RM0.72 if breakout confirms Target 1: RM0.76 (analyst consensus) Target 2: RM0.85–0.90 (technical resistance zone) Stop loss: RM0.62 (below key support) Risk/Reward ~ 1:2.5 Timeframe: 4–8 weeks swing trade
MYX:ANNJOOLong
by amirulshah
112233445566778899101011111212131314141515161617171818191920202121222223232424252526262727282829293030313132323333343435353636373738383939404041414242
…999999

Made by humans

Select market data provided by ICE Data Services. Select reference data provided by FactSet. Copyright © 2026 FactSet Research Systems Inc.Copyright © 2026, American Bankers Association. CUSIP Database provided by FactSet Research Systems Inc. All rights reserved. SEC filings and other documents provided by Quartr.© 2026 TradingView, Inc.

More than a product
  • Supercharts
Screeners
  • Stocks
  • ETFs
  • Bonds
  • Crypto coins
  • CEX pairs
  • DEX pairs
  • Pine
Heatmaps
  • Stocks
  • ETFs
  • Crypto coins
Calendars
  • Economic
  • Earnings
  • Dividends
  • IPOs
More products
  • News Flow
  • Portfolios
  • Fundamental Graphs
  • Yield Curves
  • Options
  • Macro Maps
  • Pine Script®
Apps
  • Mobile
  • Desktop
Community
  • Social network
  • Wall of Love
  • Refer a friend
  • House Rules
  • Moderators
Ideas
  • Trading
  • Education
  • Editors' picks
Pine Script
  • Indicators & strategies
  • Wizards
  • Freelancers
  • Paid Spaces
Tools & subscriptions
  • Features
  • Pricing
  • Market data
  • Gift plans
Trading
  • Overview
  • Brokers
  • Brokers comparison
  • The Leap
Special offers
  • CME Group futures
  • Eurex futures
  • US stocks bundle
About company
  • Who we are
  • Space mission
  • Blog
  • Help Center
  • Careers
  • Media kit
Merch
  • TradingView store
  • Tarot cards for traders
  • The C63 TradeTime
Policies & security
  • Terms of Use
  • Disclaimer
  • Privacy Policy
  • Cookies Policy
  • Accessibility Statement
  • Security tips
  • Bug Bounty program
  • Status page
Business solutions
  • Widgets
  • Charting libraries
  • Lightweight Charts™
  • Advanced Charts
  • Trading Platform
Growth opportunities
  • Advertising
  • Brokerage integration
  • Partner program
  • Education program
Community
  • Social network
  • Wall of Love
  • Refer a friend
  • House Rules
  • Moderators
Ideas
  • Trading
  • Education
  • Editors' picks
Pine Script
  • Indicators & strategies
  • Wizards
  • Freelancers
  • Paid Spaces
Business solutions
  • Widgets
  • Charting libraries
  • Lightweight Charts™
  • Advanced Charts
  • Trading Platform
Growth opportunities
  • Advertising
  • Brokerage integration
  • Partner program
  • Education program
Look FirstLook First