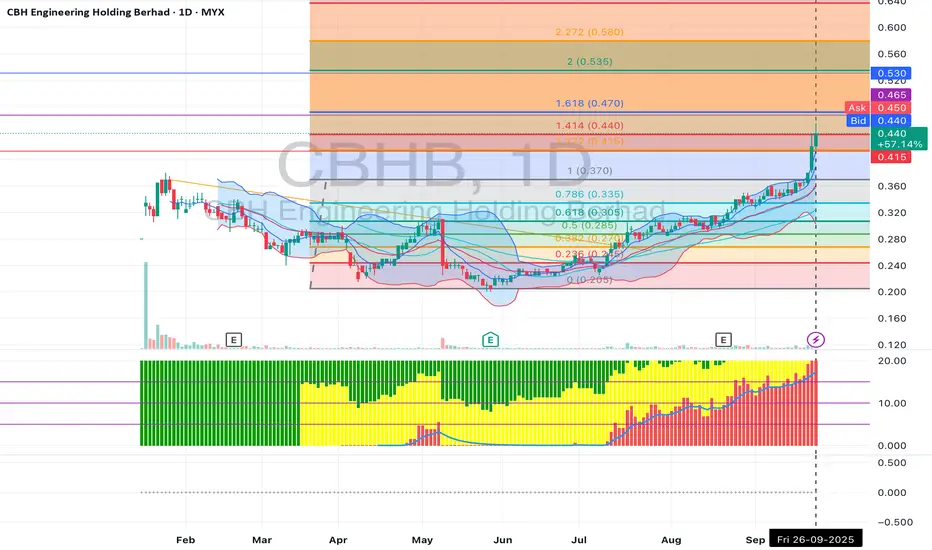
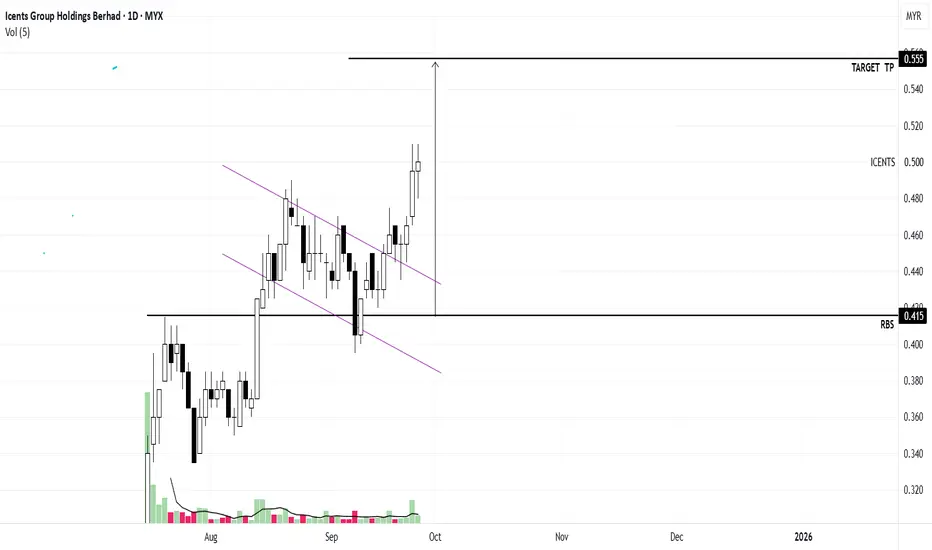
52week high & all time highThe counter shows the candle just broke the 52 week highand all time high.It is a suitable time o buy because it just breakout from minor consolidation.There is 2 strategy for this type of chart.
Buy on breakout like this candle .
Buy on dip which is to wait until the chart shows minor pullback before trying to go higher.
Thus the strategy for this at the moment is BO:2.55,SL:2.3,TP:2.72
Starting to change phase to mark upFrom the chart shows that the trend is trying to change from downtrend to uptrend.All the indicator positively shows that it will BDTL and change to uptrend slowly. BO:1.75,SL:1.58,TP:1.99
ALong
PREDICT BOX TRADING SET UP - PVA - PRICE DIRECTIONPredict
price will break zone / box with volume
will test Resistance
duration monitoring - 2 to 4 weeks
K
AAXThe chart shows that the counter has just First BO after downtrend for a while.We can see that it is strong sentiments to change phase of trend and moving up.The indicator shows positive signs to moving upwards. BO:1.71,SL:1.54,TP:1.83
ALong
ANNJOO is BDTL?From the chart we can see that it is starting to BDTL based on all the indicator that I use, it seems that it is starting to climb up changing the trend to uptrend.Fromthe indicator of RSI it seems that the movement of the EMA is starting to uptrend,while the indicator of smart money is currently incoming.The Bollinger Band as we can see,the uppercloud is starting to hit by the candle stick and te lower cloud is starting to move downward because of the volume has increase,EMA 8,21,55 is starting to move uptrend and it is below the candle stick.Which means it is starting to move uptrend based on all indicator that Ive stated. BO:0.77,SL:0.66,TP:0.88