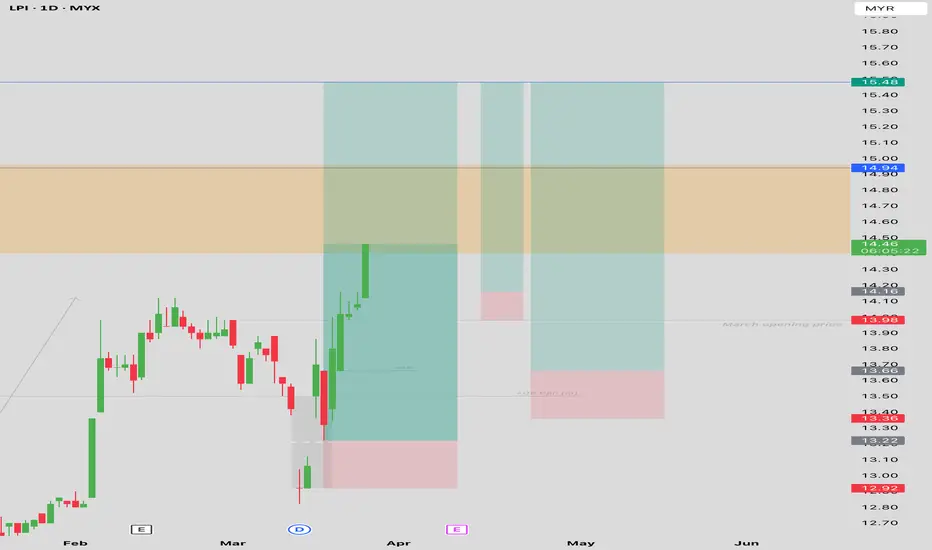
RAMSSOL CONTINUE MARKING UPI have been following ramssol since my last position
For ramssol, this is an Atypical Type #2 Re-Accumulation Schematic
The Rising Bottom
Based on the chart, I bought @ 6th Jan , i assumed that ramssol was at Phase D incoming to the phase E , awaiting for markup.
However somehow price plummeted (18th Feb) and i managed to secure some profits.
Since then, what interesting to me, is that, ramssol has 4 undercut (orange arrow) and price making uptrend
-These 'undercut' can be con
RANHILL - Looking for bullish momentum.The stock appears to be in a downtrend but is showing potential for a reversal with a breakout pattern forming.
A breakout just occurs above the downtrend line suggests a potential bullish reversal.
The price is currently below down Kumo, which indicates resistance. A breakout above Kumo could reinforce bullish momentum.
Monitor the trading volume during breakout attempts. Increased volume is a strong confirmation signal for a breakout.
Y wave with target movement towards point (E) within stipul
TTVHB
Breakout, pullback, entry? Why wait for pullback? Market moves by Fear & Greed of the participants (Day trader, Contra player, position trader, etc). Thats why we should always look for retracement around the key level after major moves to be safe. Don't chase, if she's the one she will come to find you!!! eh. TAYOR
This message is for education and information purposes only. It shall not be construed as an offer/solicitation or recommendation to buy/sell any stocks.
CDB Trading Plan: Smart 2:1 Strategy for Steady GainsCDB Trading Plan
Entry Price (EP): RM3.33
Take Profit (TP): RM3.40 (2% gain)
Stop Loss (SL): RM3.30 (1% loss)
Risk-Reward Ratio: 2:1
Strategy:
Enter at RM3.33 when the price shows bullish confirmation (e.g., strong green candle, positive momentum).
Exit at RM3.40 for a 2% profit or cut losses at RM3.30 to minimize risk.
Risk only 1-2% of your total capital for controlled exposure.
Tip: Monitor volume spikes or positive market sentiment for improved entry timing.
SIME Trading Plan: 2:1 Risk-Reward Strategy for Steady GainsSIME Trading Plan
Entry Price (EP): RM1.96
Take Profit (TP): RM2.00 (2% gain)
Stop Loss (SL): RM1.94 (1% loss)
Risk-Reward Ratio: 2:1
Strategy:
Enter at RM1.96 with bullish confirmation (e.g., strong green candle or volume spike).
Exit at RM2.00 for profit or RM1.94 to limit losses.
Risk only 1-2% of total capital for controlled exposure.
Tip: Monitor for positive market sentiment or strong sector performance for added confidence.
PMETAL Trading Plan: Simple 2:1 Strategy for Steady GainsPMETAL Trading Plan
Entry Price (EP): RM4.98
Take Profit (TP): RM5.08 (2% gain)
Stop Loss (SL): RM4.93 (1% loss)
Risk-Reward Ratio: 2:1
Strategy:
Enter at RM4.98 with bullish confirmation (e.g., strong green candle or volume spike).
Exit at RM5.08 for a 2% gain or cut losses at RM4.93 if the price weakens.
Risk only 1-2% of total capital for controlled exposure.
Tip: Watch for market sentiment and PMETAL-related news for optimal entry timing.
IHH Trading Plan: Simple 2:1 Strategy for Steady GainsIHH Trading Plan
Entry Price (EP): RM6.87
Take Profit (TP): RM7.01 (2% gain)
Stop Loss (SL): RM6.80 (1% loss)
Risk-Reward Ratio: 2:1
Strategy:
Enter at RM6.87 on bullish confirmation (e.g., breakout or strong buying momentum).
Exit at RM7.01 for profit or cut losses at RM6.80.
Risk only 1-2% of total capital for controlled exposure.
Tip: Watch for sector news or earnings updates to support bullish momentum.
TENAGA Trading Plan: Simple 2:1 Strategy for Consistent GainsEntry Price (EP): RM13.56
Take Profit (TP): RM13.83 (2% gain)
Stop Loss (SL): RM13.42 (1% loss)
Risk-Reward Ratio: 2:1
Strategy:
Enter at RM13.56 with bullish confirmation.
Exit at RM13.83 or cut losses at RM13.42.
Risk only 1-2% of total capital.
Tip: Monitor news and market sentiment for better timing.
CBHB...The MACD is still below zero, while both the RSI and Stochastic RSI are in the overbought zone. This suggests that a pullback could be on the horizon, so caution is advised. After the pullback, watch for signs of a base forming, as this could indicate a potential rebound. Monitor closely for possible FIFO (First In, First Out) opportunities.
Disclaimer: This is not financial advice. Always conduct your own research and consult a professional before making any investment decisions.
Still UNIQUEThe MACD is still below zero, while both the RSI and Stochastic RSI are in the overbought zone. This suggests that a pullback could be on the horizon, so caution is advised.
Disclaimer: This is not financial advice. Always conduct your own research and consult a professional before making any investment decisions.
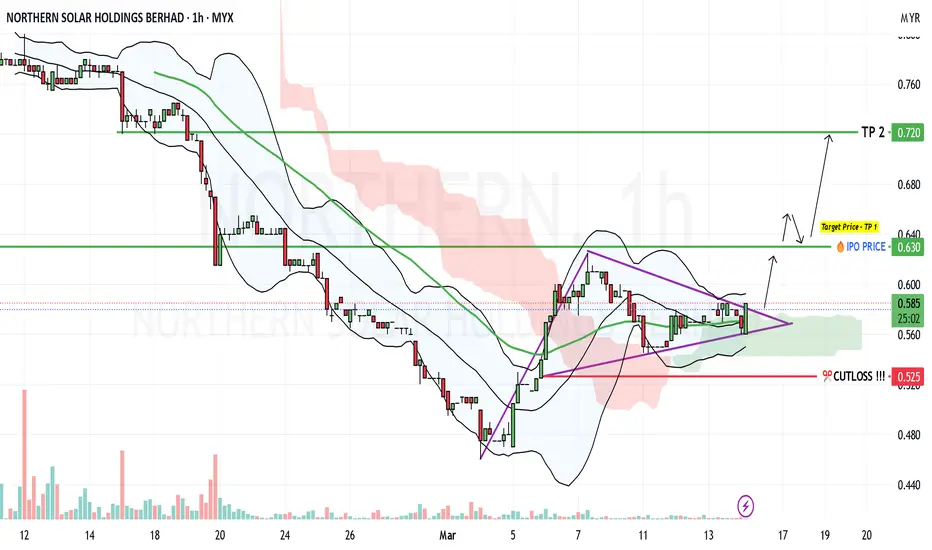
NORTHERN MYX:NORTHERN
📊 Short-Term Bias: Neutral to Bullish (Consolidation with Breakout Potential)
🔎 Decision Point: RM 0.565 - 0.580 → If it breaks above, expect bullish momentum towards
0.630 (IPO Price)
📢 Risk Management: If price falls below 0.525, the bullish setup is invalidated.
📢 Disclaimer
The trading ideas and analysis provided are for informational purposes only and do not constitute financial advice. Trading involves risk, and past performance is not a gu
SPSETIA, found support?The price has rebounded from a major support level, raising the possibility of a test against the downtrend line. If the price fails to break above this resistance, it may retrace back to the support zone. A breakdown below the support level could lead to further downside movement.
From a technical perspective, confirmation of a breakout above the downtrend line is essential for a potential trend reversal. Key indicators such as RSI and MACD should be monitored, if RSI remains neutral and MACD
SAMAIDAN, where the next low?The price has broken through multiple support levels, showing continued weakness with no strong reversal signals yet. The downtrend remains intact, and unless a solid base is formed, further downside movement is possible.
Key Considerations:
Support & Reversal Area: As no significant buying pressure has emerged, the next key level to watch is where price stabilizes and forms a potential reversal pattern, such as a double bottom, bullish divergence on RSI, or strong volume accumulation.
RSI &
Oppstar, come already?The price action briefly tested the 0.690 level before retracing, signaling potential resistance at this area. The RSI reaching overbought territory suggests that buying momentum may be overextended, increasing the likelihood of a pullback or consolidation before any further upward move.
Despite this short-term bullish push, the MACD remains below 0, indicating that the broader trend is still weak, and upward momentum lacks confirmation. A bullish MACD crossover above the zero line would streng