BMGREEN ready next potential rallyMulti weeks base formation + absence of sellers weekly + BO of pennant flag.. Next target would be RM3. TAYOR.Longby SenseiSaham1
INNO ready to take offINNO setting up nicely, BO of bull flag. Target would be 2.20. TAYOR.Longby SenseiSaham1
Systech, any reversal signal? The chart displays a downward trend for SYSTECH. The stock price has been declining over the past few months, with a series of lower highs and lower lows. * Resistance Levels: The stock has encountered resistance at the 0.400 and 0.350 levels, where it has struggled to break above. This indicates that there is significant selling pressure at these price points. * Support Levels: The stock has found some support at the 0.250 level. However, it is important to note that this support level has been tested multiple times and may not hold in the future. * Volume: The volume has been declining during the downtrend, which suggests that there is less interest from investors in the stock. Potential Rebound or Continued Downward Trend: Based on the current chart, it is difficult to predict a clear rebound. The stock may continue its downward trend if the current support levels break. However, there are a few factors that could potentially lead to a rebound: * News or Events: Positive news or events related to the company could trigger a buying interest and lead to a price increase. * Technical Indicators: If technical indicators such as the Relative Strength Index (RSI) or Moving Averages start to show bullish signals, it could indicate a potential reversal. * Market Sentiment: A change in market sentiment towards the stock could also lead to a rebound. Important Considerations: * It is important to note that technical analysis is just one tool and should not be used as the sole basis for investment decisions. Disclaimer: Please be informed that all stock picks are solely for educational and discussion purposes; they are neither trading advice nor an invitation to trade. For trading advice, please consult your remisier or dealer representative.by DSELE99111
TH Plant - Wedge Breakout (A+ Swing Trade Setup)TH Plant Wedge Breakout (A+) - Swing trade CP - Wedge Breakout RSI > 50 (Rebound at 50 during Entry) SCDMX - Red Candle 20% (Strong Institution influence) AP - 1st Buy Signal 2nd Confluence (A+) A+ Setup - Breakout on the 4th rebound point on the strong upward trendline CD - Tweezer Bottom on the rebound point Entry Price Close above 200SMA www.tradingview.com EP - 0.675 TP - @ R0.715 / @R0.775 / TP @ 0.8 (XOX) / @ R0.840 SL - @0.61 (below previous low) R:R - 1:2 Market Condition - KLCI is rebounding on 200SMA with Morning Star CD. Bursa Plantation Index - Still Bullish with RSI > 50. But in Consolidation upon entry and rebound on closing. FCPO Index - Bullish. All the best guys. Will let you know the results. Longby hafidz_shuhaimi1
GAMUDA GOING FOR MARK UPVery nice Re-Accmulation Pattern here I have been actively Accmulating the share since MId September 2024 : These are my list of Entry & Exit : 1st POE : 17/9/2024 (Black Arrow) 2nd POE : 9/10/2024 (Black Arrow) -EXIT : 21/10/2024 (Red Arrow) Re-Initiated PE : 1st : 22/10/2024 (Black Arrow, This time i went with Full Position) 2nd : 4/11/2024 (Blue Arrow, I went with Overweight Position) Purely Wyckoff Entry, i always aiming for, a condition in which i am in Assymetrical Leverage Longby drsyarizUpdated 6
NATGATE GOING FOR MARK UPThis is a Classic, Re-Accumulation #2 (Rising Bottom) Since 16/10/2024, i noticed supply seems to be evaporating With influx of demand **Red Arrow I wait for the price to BO from the BUEC area then position initiated as attached @ 5/11/2024 PureWyckoffLongby drsyarizUpdated 6
RAPID GIVE NICE SETUP AND VOLUME, GOOD TO HOLDThis Weekly FORECAST Opportunity for RAPID. This setup is my trading idea/plan, if you want to follow: trade at your own risk (TAYOR). Risk Factors: 1. Market conditions, unexpected news, or external events could impact the trade. 2. Always use risk management strategies to protect your capital.Longby TREND-TITAN2
CHGP - Uptrend may EXTEND in near term ?CHGP - Current Price : RM2.27 CHGP is bullish as the price is above 50 & 200 days EMA . It is currently forming a Bullish Pennant Pattern. Chart Pattern traders may wait for a valid BREAKOUT this pattern to trigger a buy signal. Based on ICHIMOKU CHART, the stock made a breakout above CLOUD on 22 OCT 2024 which provides a buy signal. CHIKOU SPAN already moving above candlestick (which indicates a bullish scenario). At current moment, CHIKOU SPAN is inside the CLOUD and heading towards its resistance (LEADING SPAN 2 - the upper side of CLOUD). If the CHIKOU SPAN make a new high above the CLOUD, it will strengthen more the BULLISH outlook for this stock. As such, ICHIMOKU CHART traders may wait for the CHIKOU SPAN to break above the CLOUD to trigger a good buy signal. Notes : CHIN HIN GROUP BERHAD is the largest shareholder of CHGP. Approximately holding 54.94% stake.Longby IMRAN_96Updated 2
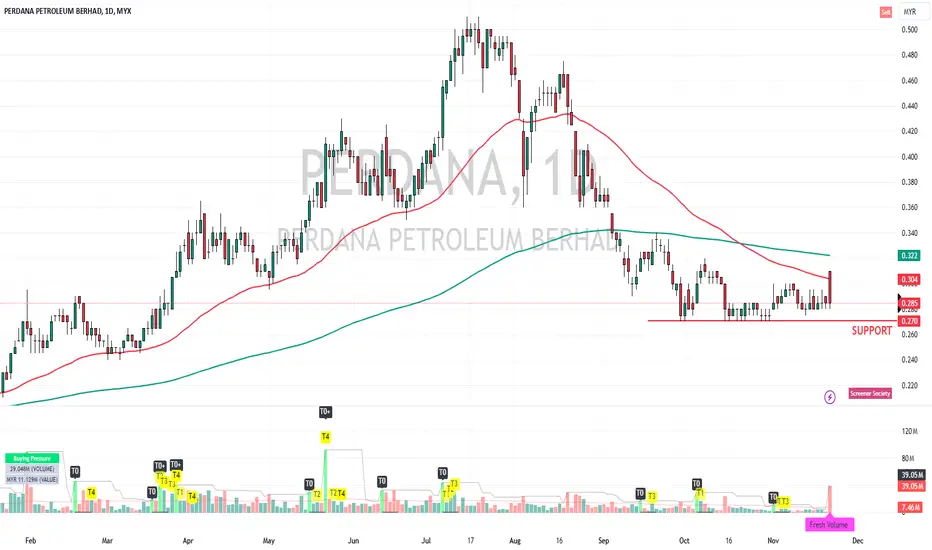
PERDANA - Buy on weakness and sell on rebound/strength ?PERDANA - Current price : RM0.285 PERDANA is bearish in technical view as the price is below 50 and 200 days EMA. Yesterday 20 November 2024, the company posts stronger 3Q Profit and Revenue. Revenue rose 23% to RM127.25 million, with third-party vessel contributions increasing 27%. Net profit jumped 232% YoY to RM75.80 million, supported by higher vessel utilisation and improved charter rates. Today 21 November 2024, the stock opened gap up at RM0.310 (rose 8.77% from previous day closing price). The stock were traded between RM0.310 (high) and RM0.280 (low). Finally the stock closed at RM0.285 (unchange from yesterday closing price). In view of Technical Indicator, there is no buy signal. But here i anticipate to buy at closing price RM0.285 because there is a psychology behind the share price movement. The share price made gap up on the morning session indicates there are some investors view this stock value to buy in higher price. However, the share price didn't sustain at high price and closed at lower indicates that the insiders have sold their shares as they bought early at discounts price. As a trader, i will buy this stock for short term because once the selling pressure absorbed and become oversold, the stock may bounce and make a rebound to higher price. As such, i will buy at RM0.285 and target to sell at RM0.305 (one bid below today high - profit +7%). My support level will be RM0.270 (cutloss at RM0.265 - loss -7%). So the risk reward ratio will be 1:1. ENTRY PRICE : RM0.285 TARGET : RM0.305 (+7%) SUPPORT : RM0.270 CUTLOSS : RM0.265 (-7%) Notes : The share price bounced at RM0.270 (support level) almost 10 times indicates that the support level is significant.by IMRAN_96Updated 2
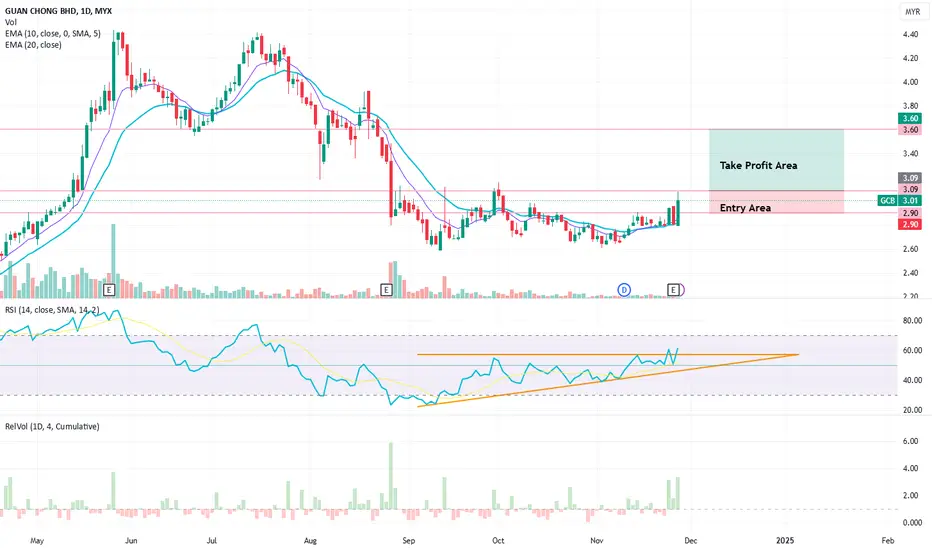
Simple13 Trading IdeaCurrent Price: RM 3.01 The latest earnings report for this stock is solid, but the absence of a gap-up at market opening suggests the result was already priced in or met investor expectations. Fundamental Strength: PE Ratio: Less than 10 (indicating undervaluation). ROE: More than 10 (reflecting strong efficiency in generating returns). These financial ratios highlight the company's solid fundamentals, making it a potential candidate for accumulation. Trading Plan: Take Profit Area: RM 3.01 to RM 3.60. Entry Area: RM 3.01 to RM 2.90 (consider entering on pullbacks). Cut Loss: RM 2.80. If the price drops below RM 2.80, the pullback could be deeper than expected, likely falling below the 20 EMA, signaling a higher risk. Summary: The strong fundamentals make this stock attractive, while the lack of immediate price action post-earnings provides an opportunity for buyers to accumulate near support levels. Keep an eye on technical signals and manage risk appropriately. Disclaimer: This is not financial advice and is for informational purposes only. Always do your own research before making any trading decisions. MYX:GCB by Simple13_Trading1
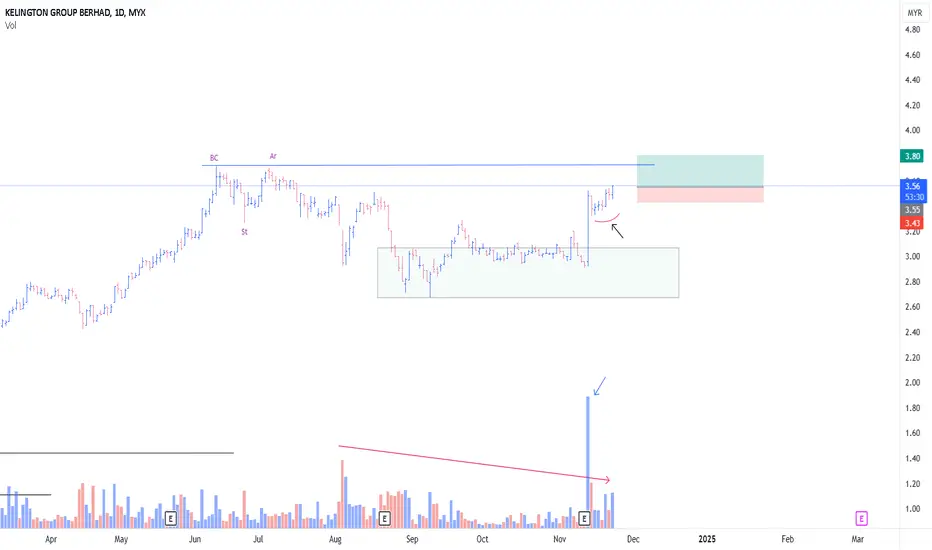
KGB CONTINUE MARK UPThis is a very big Re-Accumulation Pattern But seems like more towards An Atypical Type of Re-accumulation #2 Schematic, The Rising bottom Vol has been evaporating, which probably supply been succesfully absorbed (Red Arrow) What attract me the most, is that , despite Huge demand on 13/11/24 (blue arrow), there were not much selling pressure Current price action might be a sign of LPS, Thus breakout of LPS probably an indication of Continuation of SOS (Sign Of Strength) KGB might be one of the Leader in Tech Sector/Semiconductor-Related Thus, position initiated today \ Tight SL Pure WyckoffLongby drsyarizUpdated 5
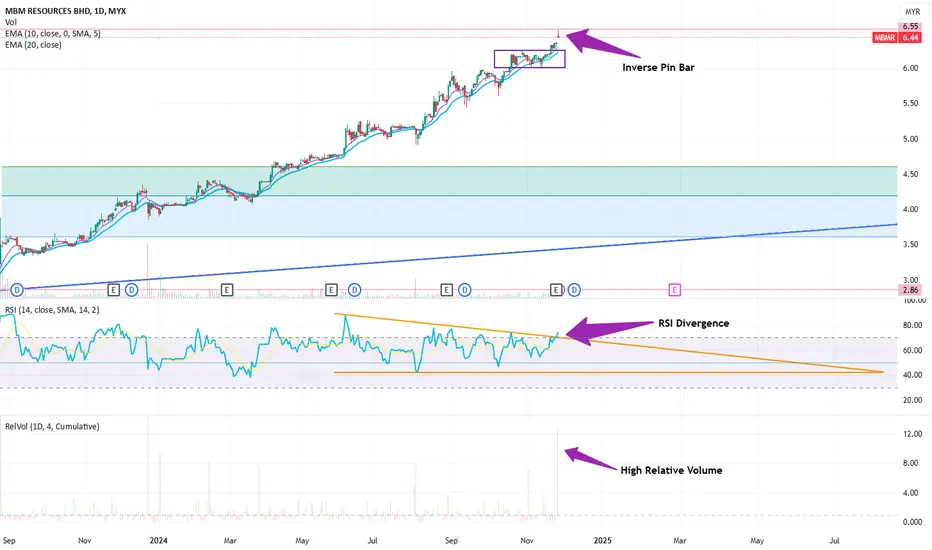
Simple13 Trading IdeaCurrent Price: RM 6.44 I foresee a potential price correction for this stock based on two strong technical indicators, despite its low PE ratio (below 10). Key Observations Inverse Pin Bar with High Volume: The inverse pin bar candle on the daily chart, coupled with high volume, indicates significant selling pressure, a bearish signal that the price might head lower. RSI Divergence: The RSI divergence on the daily chart adds another layer of bearish confirmation, showing weakening momentum even as the price reached recent highs. Trading Plan Wait for Pullback: If the price declines, look for a pullback near the trendline or Fibonacci support levels to consider an entry. This approach allows a more calculated buy at stronger support levels, increasing the risk-to-reward ratio for any future reversal. Summary While the fundamentals (low PE) suggest value, the technical indicators signal a likely pullback in the near term. Patience will be key—waiting for a pullback near key supports can provide a better opportunity. Disclaimer: This is not financial advice and is for informational purposes only. Please do your own research and assess risks before making any trades. MYX:MBMR by Simple13_Trading0
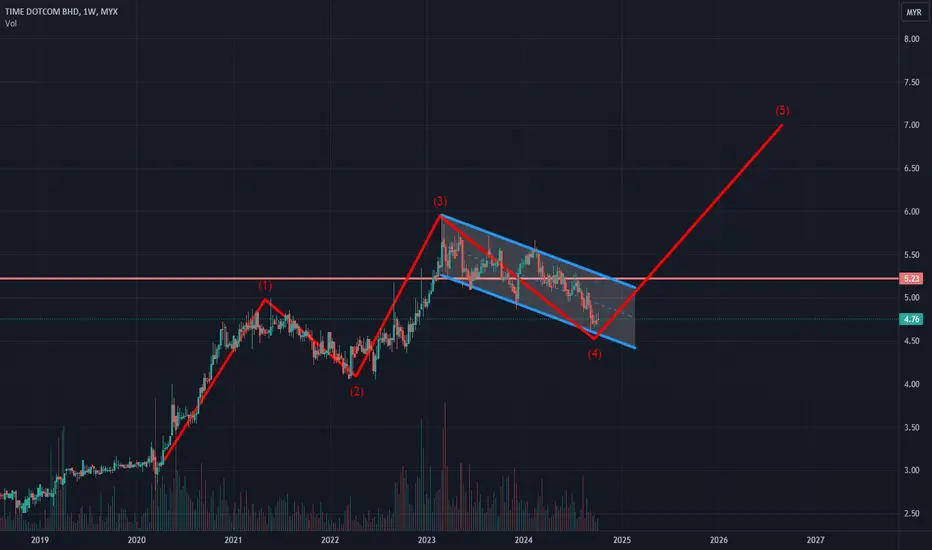
TIMECOM Waiting opportunity on 4.5 Reason for Buy this stock Stock can sustainable provide 7% + dividend per annual Waiting the Opportunity to buy at $ 4.5 as per technical analysis Continues growth on profit since 2017 and cooperate with Malaysia government for 5G internet project. Long Term ( 3 years ) holding stock only and TP on $ 7 7 % dividend per annual * 3 years = 21 % 55 % of capital gain + 21 % = 76 % 76 % / 3 years = 25.33 % per annual Waiting Opportunity for Buy Record holding 0 Stock hold as of now. Longby newbietrader_TZWUpdated 4
VS industry Short Term 3 Reason for Trade this Stock As TA, I believe recently downtrend is correction of the previous uptrend. Currently is trading on the support zone and have rejection 3 times. Noticed the MACD showing the downtrend power is lower than previous and it was exhausted. Short Term Trading ( 3 months ) TP on 1.34 with 35.5 % Capital gain within 3 months Record Holding 30 lots holding now Longby newbietrader_TZWUpdated 5
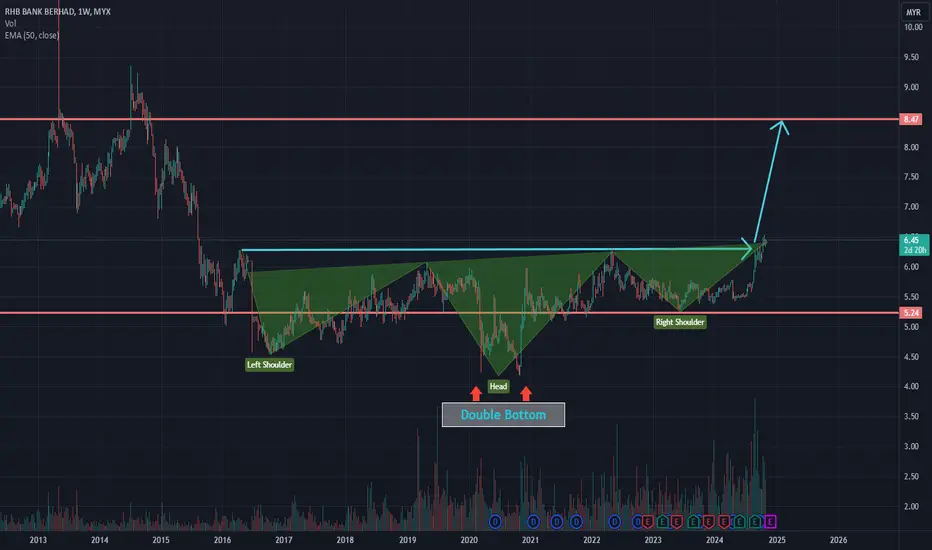
RHB super long term plan Reasons for hold this stock Head and shoulder pattern completed and break out previous high Double bottom formed confirmed the downtrend is over. break out on $6.3 key resistance since 2016. Super Long Term Trading >3 years My TP : $8.47 ( 31.17% of Capital Gain ) Annual Dividend = 6.2% Capital Gain = 31.17% Total Gain = (6.2% X 3)+( 31.17%) = 49.77% SL : $5.24 ( 18.67% of Capital Loss ) Total Loss = 18.67%- (6.2% X 3 ) = 0.07% of Capital Loss Record Stock Holding 90 Lots + 28 Lots Longby newbietrader_TZWUpdated 0
BAHVEST GOING FOR MARK UPThis is one of the Setup which i really like PowerPlay Setup Price moonshot for 100% past 2-3 months With a Typical ?Probably the classci Schematic #1 Re-Accumulation * Spring possiblity Despite price rising 100%, stil not much selling based on Vol *(Red Arrow) Thus i am humbly initiate position as attached Tight risk for a powerplay Assymetrical leverage PureWyckoffBLongby drsyarizUpdated 2
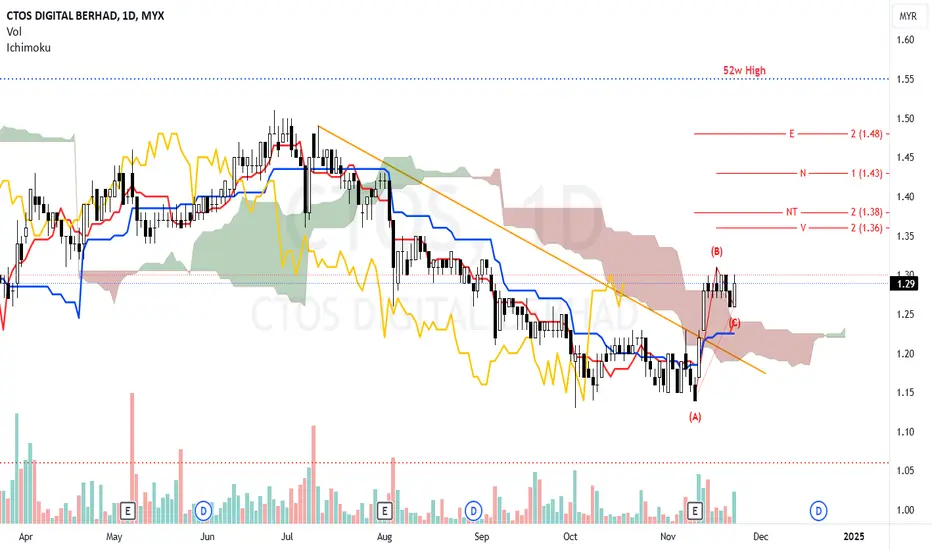
CTOS - Analysis on potential bullish sentimentN wave with E, N, NT & V projection. The price is slightly above the Kumo, indicating a potential bullish bias. Senkou-span B as immidiate support (1.24) Chikou-span - positioned above the price candles, supporting bullish sentiment. Secondary support: Point A (1.14). Entry Level 1: Enter at the current price range (1.29) for an early position. Entry Level 2: Enter additional positions near support at 1.24 (Senkou Span B) in case of a pullback. Stop Loss (SL): Place at 1.22, slightly below Senkou Span B for risk management. Monitor volume: Increasing bullish volume will confirm strength. Ensure the price stays above Senkou Span B (1.24) to maintain the bullish bias. Be cautious of strong rejection near the resistance at 1.36-1.38. Note: 1. Analysis for education purposes only. 2. Trade at your own risk.Longby mg61120
THPLANT - Looking for strong bullish momentumEntry & Exit strategy setup. The recent bearish candle is accompanied by moderate volume, indicating selling pressure but not overly aggressive. Wait for confirmation that the price holds near Entry 1 (0.645) or Entry 2 (0.620) before entering. Watch for additional volume support or bullish reversal candlestick patterns. Monitor Ichimoku signals, particularly if the price reclaims the Tenkan-sen and Kijun-sen. Ensure your position size aligns with your risk tolerance, aiming for a risk-reward ratio of at least 1:2 or better based on your stop-loss and take-profit levels. Monitor market conditions closely, as external factors can influence the price movement. Look for confirmation via price action and volume to ensure trades align with the anticipated direction. Note: 1. Analysis for education purpose only. 2. Trade at your own rik.Longby mg61120
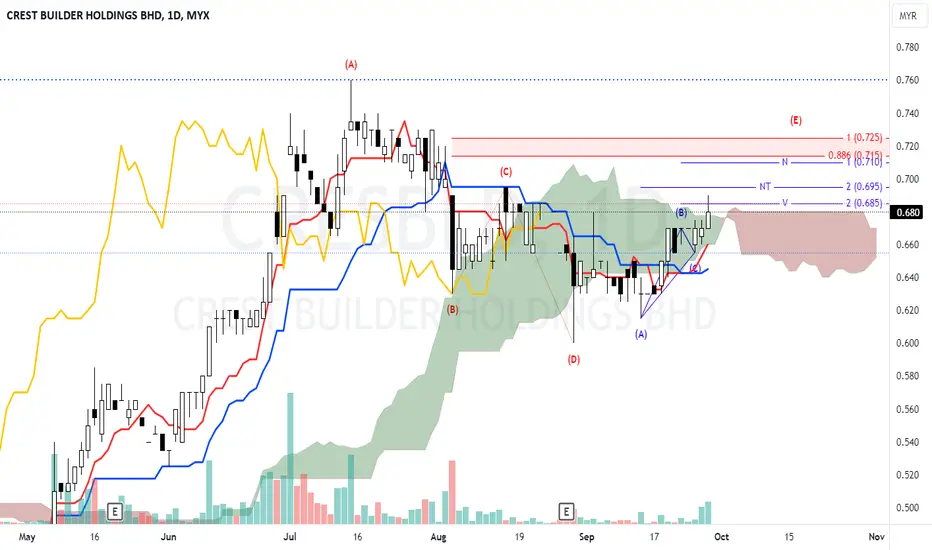
CRESBLD - Analysis on potential of price movementThe price is trading around the Kumo, with recent candles moving just above the cloud. A bullish sentiment is present, but the price needs a confirmed breakout from the Kumo. The Tenkan-Sen is above the Kijun-Sen, signaling short-term bullish momentum. The Chikou Span is slightly below the price, indicating that while momentum is picking up, the breakout confirmation needs to be strong for sustained upward movement. 0.715 (0.886 Fibonacci level): This is a key resistance level before hitting the Y wave target (E) at 0.725. 0.725 (1.0 Fibonacci extension): The major resistance level and target for the current Y wave formation. 0.685 (NT level): This level is critical as immediate support. If the price holds above this, the uptrend may continue. 0.675 (V level): Another support level which could act as a reversal point if the price pulls back. Enter on the breakout above the Kumo cloud at around 0.685, with confirmation of bullish momentum. Place a stop-loss below the Kumo at 0.650, which is also below the previous consolidation support zone. This setup presents a bullish scenario if the price can hold above the NT projection level (0.685) and break through the resistance near 0.715. Watching for Ichimoku confirmation with a clear Kumo breakout is key to entering the trade confidently.Longby mg6112Updated 2
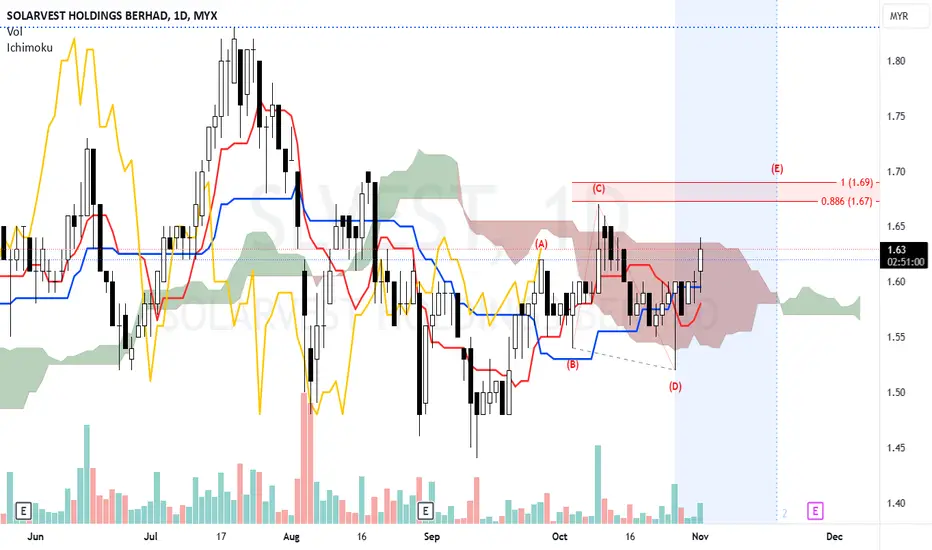
SLVEST - Looking for potential bullish momentumY wave, target (E) within stipulated time. The current price is almost exit down Kumo, suggesting a potential bullish breakout. The Chikou Span is above the price 26 periods back, indicating potential bullish momentum. If golden cross occur, which is typically consider a bullish signal. Volume appears relatively consistent but should be monitored for any increases to confirm momentum. Consider entering a long position as the price is breaking above the Kumo. This breakout could signal further upward momentum. Place a stop loss slightly below the cloud boundary or recent low around 1.55 to manage risk if the breakout fails. A reversal or close back within the Kumo would weaken the bullish setup. Failure to break above the Fibonacci resistance levels at 1.67 and 1.69 may lead to consolidation or pullback. Note: 1. Analysis for education purposes only. 2. Trade at your own risk.Longby mg6112Updated 0
CAPITALA r u seeing what im seeing?soon out of PN17, triple bottoms like the smile on my face, 4 years trendline BO. whats not to like? 🚀Longby wongzhengyong114
KERJAYA - Breakout Monthly High Kerjaya br4akout monthly high, pullback and now retest the high again. Report to be released soon Set my SL and TP according to my risk management Never chase the price, i would rather miss it also dont want to gamblingLongby VikiSoh0
SUNWAY GOING FOR MARK UPSunway, very nice Re-Accumulation pattern Shcematic #2 , The Rising Bottom I have been actively collecting the stocks since 13/9/2024 I sold my position on 28/10/24 (Red Arrow) And re-initiated my position today (Position as attached, Blue Arrow) What attracted me with Sunway, is that, The price Contracting from the left side (Phase A) -> towards the right side ( Phase D , probably) -With vol evaporating Very tight SL, risk priority PureWyckoffLongby drsyarizUpdated 3
 LongLong
 Long
Long
 Long
Long Long
Long Long
Long Long
Long Long
Long

 Long
Long
 Long
Long Long
Long Long
Long LongLong
 Long
Long Long
Long Long
Long Long
Long Long
Long