
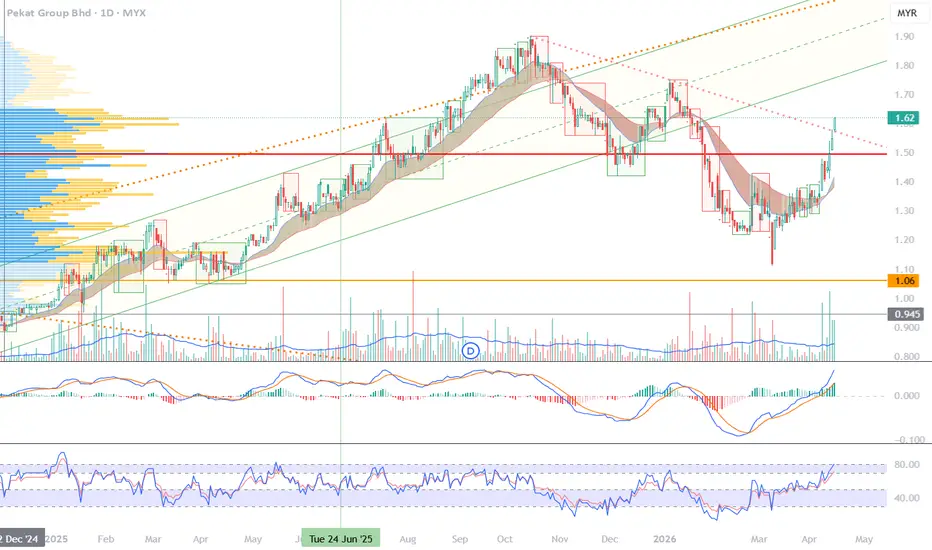
 Long
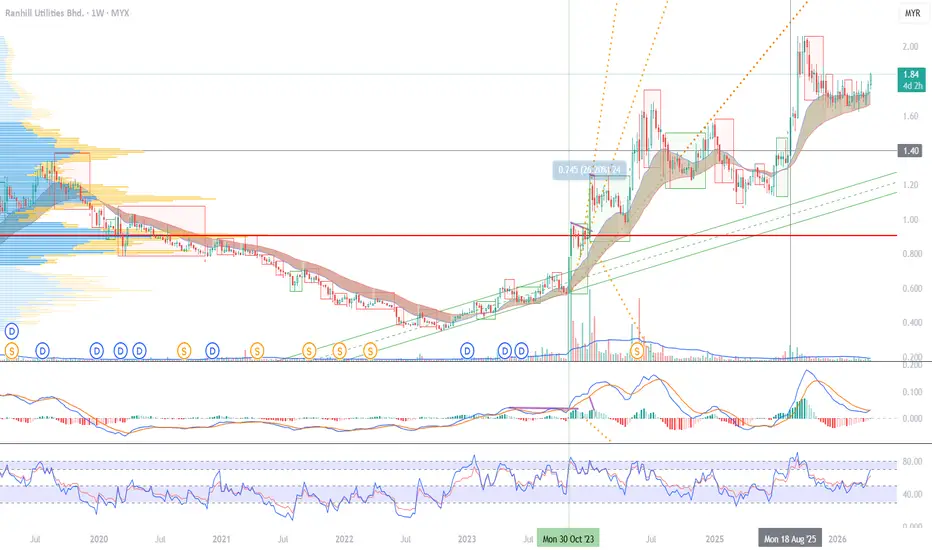
 Long
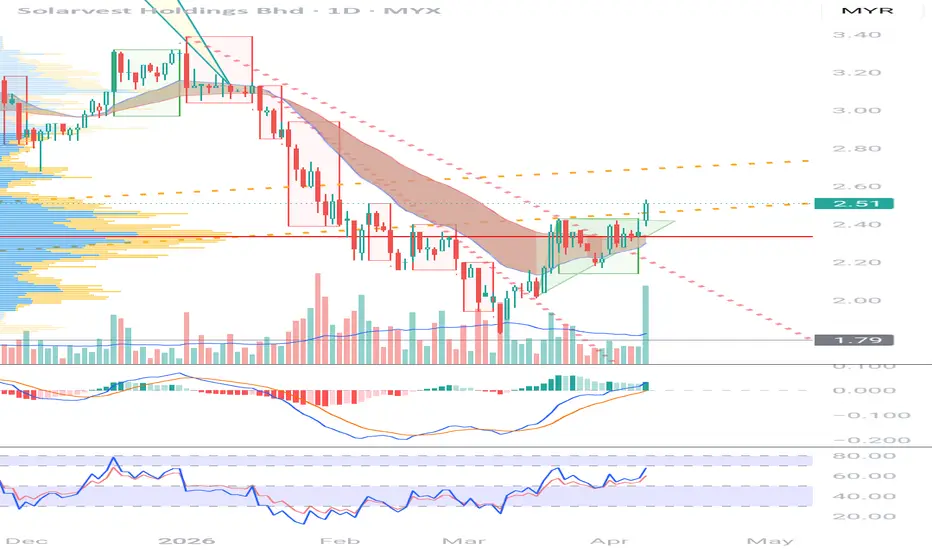
Reversal IHNS for KheesanPossible reversal to bullish for kheesan as per monthly TF found inverted head and shoulder pattern. As this is monthly TF so patient is key for the profit to come. Perfect ratio is 33 sen or within the big blue box for 1st TP (beware small blue box is lower TF perfect ratio) which is 100% profit in the long run. Might take a year or two to reach that. May entry within the current price since it might just at the end of bearish retracement. For indicator RSI already display bullish divergence. M
 Long

Possible minor bullish rejection for GCB.If the price maintain at the current price which is above 71 sen, there is a possibility to go higher to 86sen or much higher which is 96sen for perfect ratio or near the perfect ratio. As for RSI also shows divergence on previous lower low and current lower low. Just my 2 sen opinion. Also keep in mind this is weekly TF, so patient is key here.
 Long

BDTLEntry: RM1.21–1.32 | SL: RM1.10 | T1: RM1.48 | T2: RM1.85
RSI 21 = extreme oversold. Net cash RM2.15B (44% of mkt cap). Business not broken — cyclical trough. QR 21 May = next hard catalyst. Accumulate slowly in 3 tranches.
 Long

BDTLEntry: RM0.68 (at support) | SL: RM0.57 (52W low)
T1: RM0.84 (52W high) | T2: RM1.00+ (semicon upcycle re-rate)
High beta 2.12 — size small. AI chip demand structural. −48.9% YTD represents extreme oversold. Next QR 3 Jun = key catalyst. Accumulate in tranches over 4 weeks.
 Long

BDTLEntry: RM0.275–0.31 | SL: RM0.25 (below ATL = abort)
T1: RM0.395 (52W high) | T2: RM0.50 | T3: RM0.69 (analyst TP)
Near ATL with improving earnings. EPF/Tabung Haji as floor. HV transmission segment = data centre pipeline. YTD −22.4% = laggard reversion. Next QR 1 Jun = catalyst.
 Long
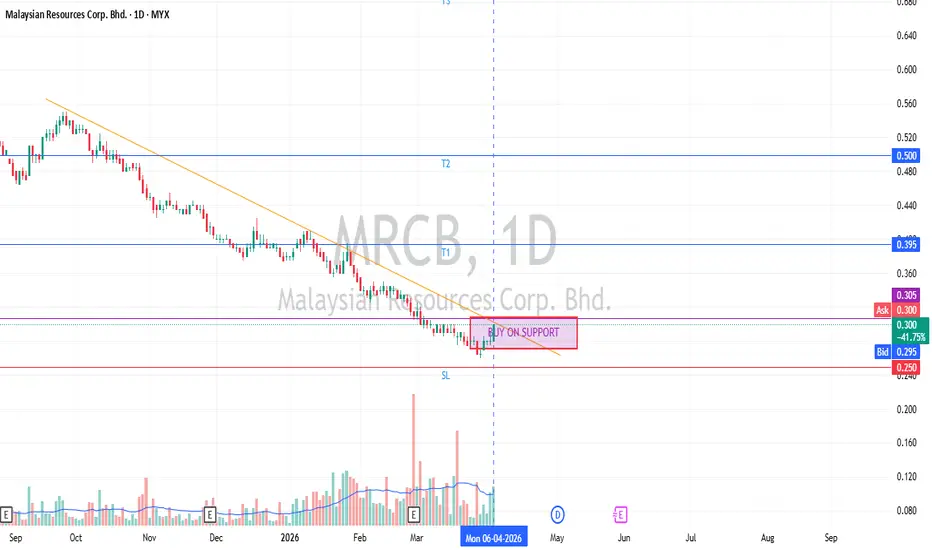
BDTLEntry: RM0.75–0.80 | SL: RM0.70
T1: RM0.97 (analyst consensus TP) | T2: RM1.10
Income + recovery. Q loss is likely one-off; EBITDA solid RM1.57B. Data centre power demand secular. Div yield 4.59% provides income floor. Next QR 26 May = catalyst check.
 Long
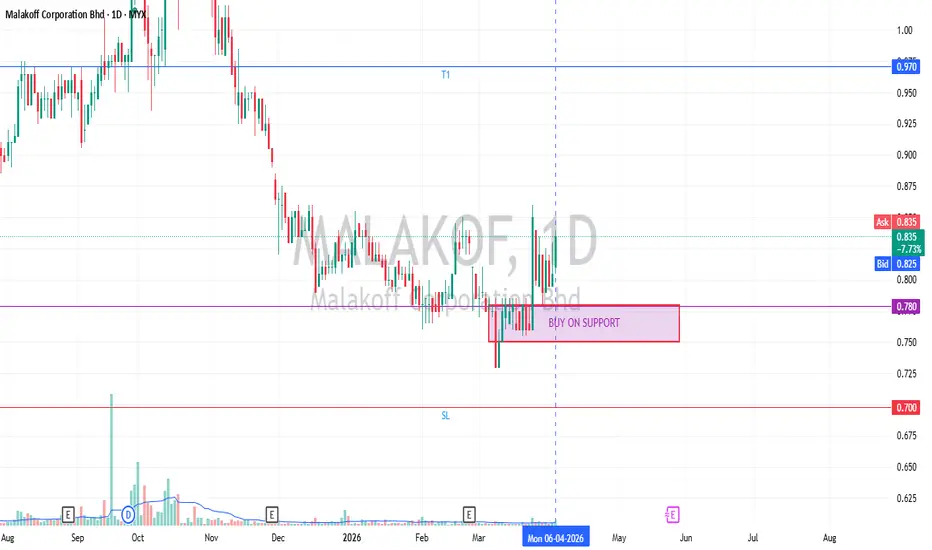
BDTLEntry: RM0.585–0.615 (support zone)
SL: RM0.550 | T1: RM0.69 (52W high) | T2: RM0.80+ (analyst initiation re-rate)
Analyst Buy initiation Apr 6 = fresh catalyst. TNB contract pipeline steady. Data centre substation demand structural. Add on confirmed new contract announcements.

UPTRENDEntry: RM0.33–0.35 (at support = 52W high area consolidation)
SL: RM0.30 (daily close below; Iran peace = exit catalyst)
T1: RM0.40 (+14%) | T2: RM0.50 (+43%) if oil sustains >USD100


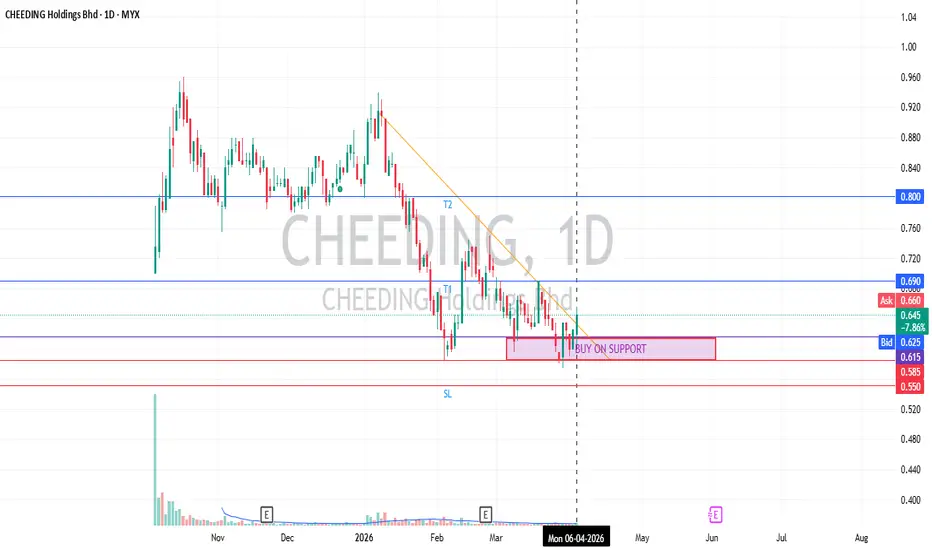
PMETAL TRADE
Price recently broke a multi-week resistance. We could see there’s a big red candle but very low volume on the first rebound. On the second rebound, there’s a doji candle with very high volume indicating that bulls are trying to push the price higher. The next candle is a big bullish engulfing candle with low volume indicating that sellers are out of the market and unwilling to push the price lower. Stops is 1 atr below and tp is before the highs.
 Long
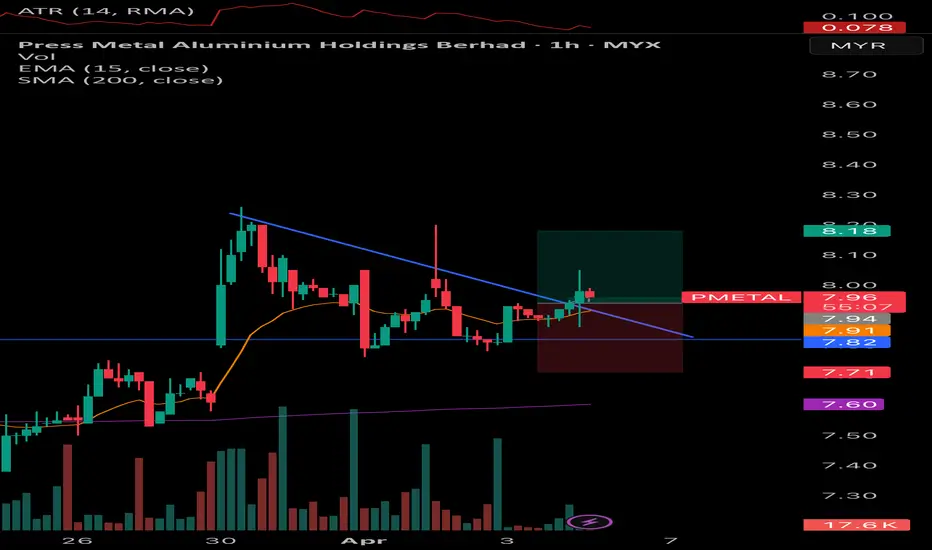
Elliott Wave Analysis: VELESTO Stock Price MovementVELESTO has completed wave (II) or wave B.
It currently appears to be forming wave 1 of wave (III) or wave C.
For VELESTO to retrace to wave 2 of the wave (III) uptrend, wave 1 must first be completed, which is currently in progress.
Wave 2 may retrace to the Fibonacci level of wave 2, potentially falling below 50% of wave 1, and may conclude with a zigzag pattern.
Wave (III) or wave C may complete with five minor waves or, alternatively, wave C may conclude with an ending diagonal pattern.
Elliott Wave Analysis: IJM Stock Price MovementIJM has completed wave (1).
Currently, it appears to be completing wave C of wave (2) with an ending diagonal pattern.
For IJM to continue the uptrend, it must first break Resistance 1.
Wave (2) of IJM may dip below the discounted zone but should not fall beyond wave 'e' in the circle.
This analysis is intended solely for Elliott Wave learning purposes and is not a recommendation to buy or sell. Please conduct your own technical analysis.


TOP GLOVE EW analysisTOPGLOV maybe completed the wave (V) and now in progress to complete wave 1.
I want to see the price retrace to wave 2 and reverse to continue the uptrend to go for wave 3.
This is just for EW learning. Not recommended to buy or sell. Do you own TA.


SDG TRADE IDEA
Price broke a multi week resistance. With high volume on the breakout and decreasing volume as it pullbacks to the level, there’s a possibility to rebound from the area. On the last candle price formed a hammer candle. A bullish engulfing candle would mark our entry. Stops is 1 atr below the lows and tp is just before the resistance giving us a pretty decent rr ratio.
 Long

zone sauk - predict price direction only
zone sauk - predict price direction only
rbs
naked chart
pva
duration to close monitor - 2 to 4 weeks
A

Predict price direction only ......naked chart
pva
rbs
zone sauk
time duration to monitor 2 - 4 week


99SMART TRADE IDEA
Price came back to a multi-month level. On the 4hr chart, there's a double bottom which is a bullish reversal pattern. The red candle with a long wick and bullish engulfing candle further reaffirms the potential reversal to the upside and that marks our entry.
Looking at the fundamentals, 99SMART is a defensive stock since it's in the consumer staples industry. People can stop buying the latest Iphone etc but they cant stop buying essentials like rice and eggs. With the geopolitical events t
 Long

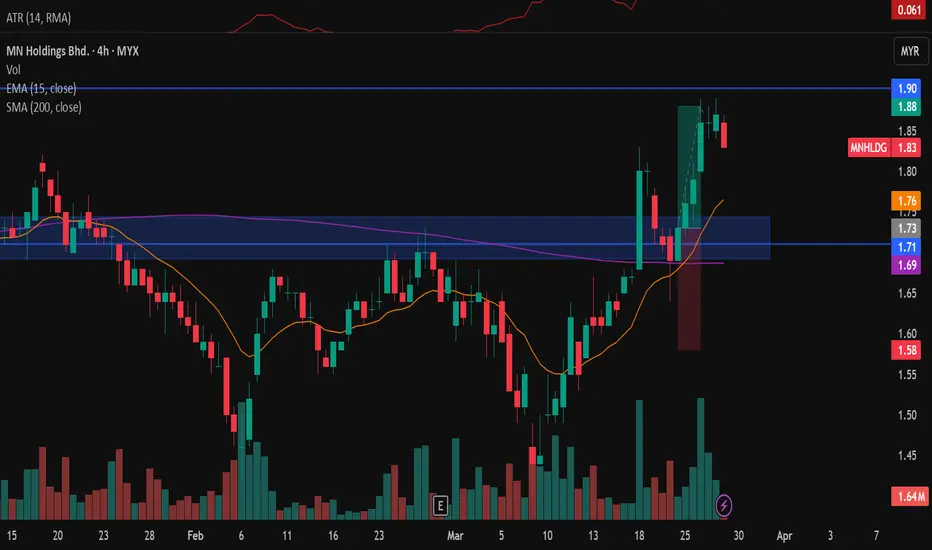
MNHLDG TRADE
I already closed this trade so i'll just treat it as a trade journal instead of idea. On the 4hr chart price broke a multiday resistance level with high volume. Price pulled back and at the bottom there's a red candle with quite high volume but has a long wick. This indicates that while sellers are trying to pushing the price down, buyers are absorbing every sell order refusing to let price go down even further which means there's a potential upside. The next candle is a bullish engulfing can
 Long


VSTECS LIKELY CONT ITS MARK UPThis is an Atypical Reaccmulation pattern of Schematic #2
(Need to zoom out the chart)
1/ Influx of demand (Green Arrow)
2/ Bar 9march26 shows dysharmony between effort & result , someone had bought loads of shares during that day
Chart is too straightforward
tight risk, might be adding if things BO here onwards
 Long

Artroniq possible uptrend months to comeJust my 2 sen opinion, this counter already touch golden fibo on 2.618 and now it's consolidate and creating double top and possible ascending triangle (bullish). Might be possible to enter when touch lower trend line of the ascending triangle or just wait for confirmation once confirm breakout the double top line with volume. Reminder at E wave there are 3 possible path whether will break out the top or rebound make retracement and continue push higher or will touch lower trend line and break t
 Long
