• Products
  • Community
  • Markets
  • Brokers
  • More
Get started
  • Markets
  • /Malaysia
  • /Stocks
  • /Ideas
HEXIND - Need continuous bullish momentum P wave, entry on P wave B/O Price to stay above Kumo, indicating a potential bullish momentum. Kijun-Sen is flat, and the Tenkan-Sen is sloping upward, which shows that the momentum might be shifting, but the breakout is crucial for a confirmed signal. The Chikou-Span is just crossing the price, which might support a bullish breakout. The price is forming a contracting triangle with point D at the resistance line (0.445), and the next crucial area is at point E (0.430). The breakout above the t
MYX:HEXINDLong
by mg6112
BAHVEST - Looking for continuation of bullish momentumY wave, target (E) within stipulated range. N wave with N, NT & V projection. The price is above the Kumo, signaling bullish momentum. The Chikou Span is also above the price, which confirms a bullish sentiment. The Tenkan-Sen has crossed above the Kijun-Sen, signaling a bullish crossover. This reinforces the upward trend. Price needs to stay above 0.585 and could provide a potential entry signal for a bullish continuation toward the V target at 0.620. Consider placing a stop-loss below the Kij
BLong
by mg6112
Updated
GENETEC: A Lingering Presence in the Market Despite its recent downturn, GENETEC continues to be a topic of discussion among traders. The stock currently faces support at RM0.800, raising the question of a potential rebound. However, it's important to note that GENETEC remains in a downtrend. Therefore, any potential rebound should be approached cautiously and strictly adhering to FIFO (First In, First Out) principles for managing investments. Additional Considerations: * Market Sentiment: Keep an eye on overall market sentiment and
MYX:GENETEC
by DSELE99
GENETECI presume GENETEC is in early stage for more bullish trend. Now she is in retracement zone.
MYX:GENETECLong
by AdamIdris2
Updated
GTRONICAt this moment she is in retracement of an uptrend. Potential buy in the green zone.
MYX:GTRONICLong
by AdamIdris2
Updated
ihhprice alert diamond price trigger 6.96 1.9% tp ATH 52wh 7.25
MYX:IHH
by automlm81
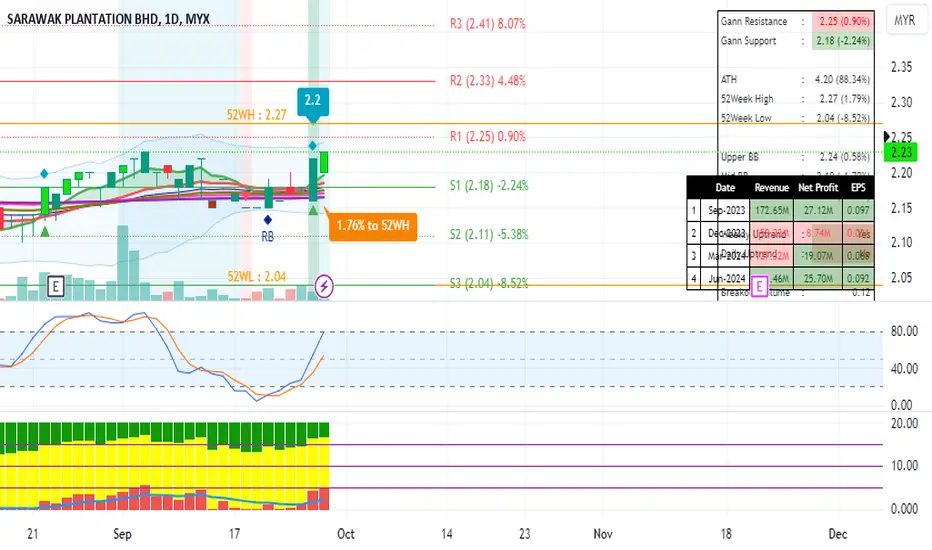
SWKPLNT!!!! alert watchlist trigger entry price 2.2 next target 1.76% to 52wh 52wh 2.27
MYX:SWKPLNT
by automlm81
YTLPOWR, resistance turn support?YTLPOWR appears to have recently seen a key resistance level turning into support? This shift can often signal strength in the stock's momentum. However, should the stock move lower, waiting for a clearer opportunity to re-enter or accumulate might be a prudent approach. The probability here leans on two outcomes: if the new support holds, we could see further upside potential. On the other hand, if the stock dips below this new support, it could signal a deeper pullback, and patience would be
MYX:YTLPOWRLong
by DSELE99
sunsuriamonitor 0.600 if get price tobe 52wh the pin bar forme in line with ddirection of the market is more powerful than the one which is formed against the trend
MYX:SUNSURIA
by automlm81
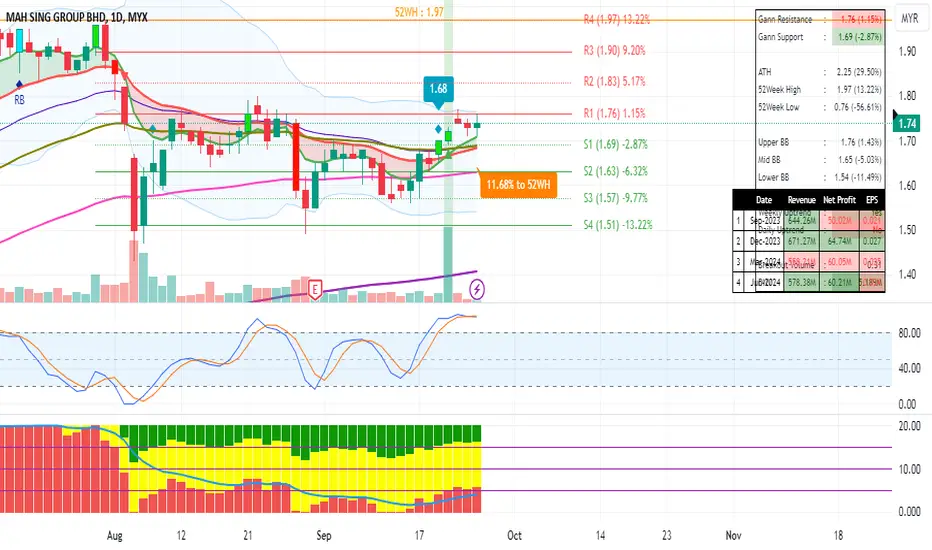
mahsingspinning top white gan 1.80 watchlist spinning top white gan 1.80 watchlist spinning top white gan 1.80 watchlist
MYX:MAHSING
by automlm81
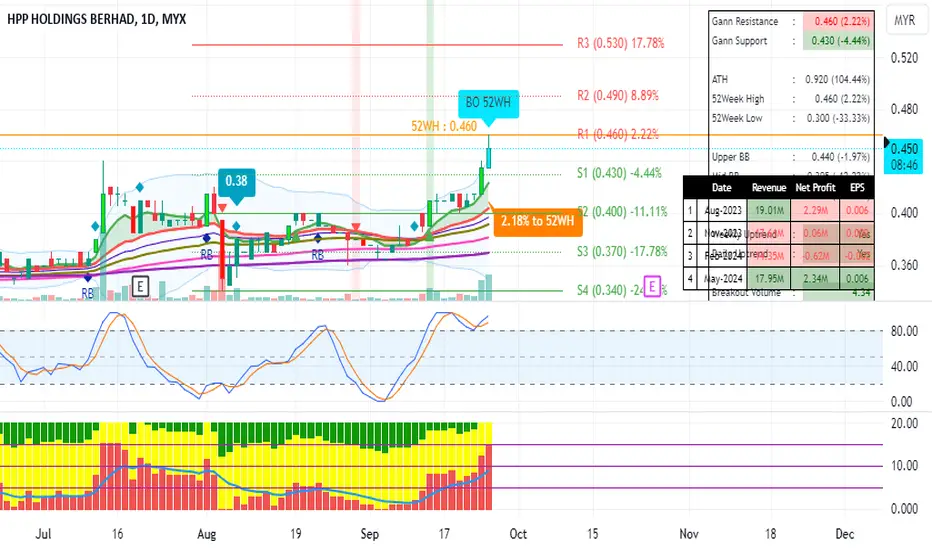
hpphbmonitor 26 sep touch again or brreak 52wh 0.460 if break 0.460 fly the moon in 15min market open
MYX:HPPHB
by automlm81
MI Technovation Trading IdeaTechnical Setup: The stock previously rebounded from both the uptrend line and the Fibonacci 0.618 retracement level, indicating strong support. However, if the uptrend line breaks, it could signal a weakening of the bullish trend. Entry Strategy: Buy MI Technovation shares in the entry zone between RM 1.74 and RM 1.90. This range offers a favorable risk-reward ratio based on historical support levels and Fibonacci analysis. Profit Taking: If the price rises to RM 2.75, take profit, as this i
MYX:MILong
by Simple13_Trading
KUB - Monitor for the price action.N wave with E, N, V & NT projection. Price is hovering at the edge of down Kumo and Senkou-Span B (0.780) as an immediate resistance. The Chikou Span crossing above the candle price showing a bullish signal. Price needs to stay above NT level to keep the continuation of bullish momentum. Considering for entry at above NT level and failing to breakout this level could invalidate the setup. R1 - 0.780 (Senkou-span B) R2 - 0.790 S1- 0.765 (Senkou-span A) S2 - 0.735 Note: 1. Analysis for educatio
KLong
by mg6112
Updated
Engtex - Need strong momentum to for bullish sentimentY wave, target (E) within stipulated range. Price just crossed Kijun-sen but still below Kumo indicating the bearish sentiment, though a potential reversal may be underway. The Chikou Span is below the price and Kumo, signaling that the bearish momentum might still be in play. After wave (C), the price has been consolidating. The recent upward momentum could push the price toward the Y wave target at (E). R1 - 0.660 R2 - 0.670 S1 - 0.610 S2 - 0.600 A potential breakout above 0.640 could signal
MYX:ENGTEXLong
by mg6112
Updated
NATGATE - Potential Pullback on the Horizon?The stock has just closed above the key RM1.80 level, maintaining its position in line with the Hull Moving Average (HMA), suggesting some strength in the current trend. However, it's worth noting that the MACD remains in a downtrend (DC), signaling that momentum could still be weak. Investors should keep a close watch for any signs of a pullback, especially if the stock struggles to gain further upward traction. It's crucial to not only know the right time to buy but, more importantly, to be
MYX:NATGATE
by DSELE99
Simple13 Short Term Trading Idea (KOSSAN)Current Price: RM 2.08 Profit Target: RM 2.30 Buy Zone: RM 1.95 - RM 2.08 Entry Strategy: Start accumulating KOSSAN shares in the buy zone between RM 1.95 and RM 2.08. This range offers a favorable risk-reward ratio. Profit Taking: If the price reaches RM 2.30, take profit, as this area is considered a resistance level or the stock may be overbought, and it might be prudent to lock in profits. This translates to a potential upside of 10.6% from the current price. Risk Management: If the price
MYX:KOSSANLong
by Simple13_Trading
VELESTO at SupportVelesto has come to the support zone. A potential zone to collect some of the shares.
MYX:VELESTOLong
by AdamIdris2
SDS GROUP BERHAD The stock is in a strong uptrend since mid-August 2024, as indicated by the series of higher highs and higher lows. A noticeable increase in volume has occurred recently, supporting the upward price movement. High volume in the last few sessions suggests strong buying interest, further validating the breakout above the previous resistance around MYR1.15. Support: The previous resistance of MYR1.15 now acts as support. If price retraces, this level may provide some buying interest. Resistan
MYX:SDSLong
by Sahrin
PEKAT GROUP BERHAD The price action is moving towards the upper band, which could signify the start of a short-term bullish movement if the price breaks out above the upper band. Price Action: After a significant rally in May, the stock retraced and found support near MYR0.85. This was followed by a period of sideways movement, indicating consolidation. Resistance: The most immediate resistance is the upper Bollinger Band, near MYR0.95. A break above this could signify a continuation of the previous uptrend.
MYX:PEKATLong
by Sahrin
Updated
SOUTHERN CABLE GROUP BERHAD The price is currently touching the middle band (20-day moving average) of the Bollinger Bands. The upper band (resistance) around MYR0.92–MYR0.93 seems far from the current price, implying there is some room for upward movement. The lower band around MYR0.75 acted as support during the previous downtrend. A tightening of the bands suggests a period of low volatility, which could be a precursor to a breakout either to the upside or downside. Volume on this uptick is relatively modest, arou
MYX:SCGBHDLong
by Sahrin
Updated
KUMPULAN KITACON BERHAD The price has recently touched the upper band, suggesting that the stock is experiencing upward momentum. Over the last few sessions, the stock has shown a steady upward trend, with higher highs and higher lows. The increased volume supports the upward movement and may indicate strong market participation. Resistance: The next major resistance level can be identified near MYR0.785, which is the high of today’s session. Support: As mentioned, MYR0.74 could act as a support level, followed b
MYX:KITACONLong
by Sahrin
Updated
UNIQUE FIRE HOLDINGS BERHAD Trend: The overall trend appears to be bullish in the medium term. After reaching a low in March, the stock has been making higher lows and higher highs, indicating an uptrend. Moving Averages: The stock is currently trading above both the short-term (blue line) and long-term (green line) moving averages, which is typically a bullish signal. The moving averages are also sloping upwards, confirming the uptrend. Support and Resistance: Key support levels appear to be around MYR0.320-MYR0.330,
MYX:UNIQUELong
by Sahrin
FAJARBARU BUILDER GRP BHD The price has bounced off the lower Bollinger Band, indicating the possibility of an oversold condition, and is now moving toward the middle band (likely the 20-day moving average). Volume shows an uptick during this bounce, which is bullish, as it suggests that buyers are stepping in at this level. Support: Around MYR0.380, where the price found a recent base. Resistance: The immediate resistance seems to be around MYR0.420–MYR0.440 (the middle Bollinger Band and previous price action zone
FLong
by Sahrin
SUNWAY CONSTRUCTION GROUP BERHAD Recently, the stock appears to be rebounding from the lower levels (around MYR4.00), currently trading at MYR4.19. The current rebound shows the price nearing the middle band (which typically represents the 20-period moving average). Support is observed around the MYR4.00 level, where the price has rebounded recently. Resistance is likely to be around MYR4.40 to MYR4.50, the region of the middle Bollinger Band and the moving average. Strong resistance is also seen at MYR5.20, the high from
MYX:SUNCONLong
by Sahrin
Updated
123456789101112131415161718192021222324252627282930313233343536373839404142
…999

Made by humans

Select market data provided by ICE Data Services. Select reference data provided by FactSet. Copyright © 2026 FactSet Research Systems Inc.Copyright © 2026, American Bankers Association. CUSIP Database provided by FactSet Research Systems Inc. All rights reserved. SEC filings and other documents provided by Quartr.© 2026 TradingView, Inc.

SOC 2 CompliantGDPR Compliant
More than a product
  • Supercharts
Screeners
  • Stocks
  • ETFs
  • Bonds
  • Crypto coins
  • CEX pairs
  • DEX pairs
  • Pine
Heatmaps
  • Stocks
  • ETFs
  • Crypto coins
Calendars
  • Economic
  • Earnings
  • Dividends
  • IPOs
More products
  • News Flow
  • Portfolios
  • Fundamental Graphs
  • Yield Curves
  • Options
  • Macro Maps
  • Pine Script®
  • MCP Server
Apps
  • Mobile
  • Desktop
Community
  • Social network
  • Wall of Love
  • Refer a friend
  • Creator program
  • House Rules
  • Moderators
Ideas
  • Trading
  • Education
  • Editors' picks
Pine Script
  • Indicators & strategies
  • Wizards
  • Freelancers
  • Marketplace
Tools & subscriptions
  • Features
  • Pricing
  • Market data
  • Gift plans
Trading
  • Overview
  • Brokers
  • Brokers comparison
  • The Leap
Special offers
  • CME Group futures
  • Eurex futures
  • US stocks bundle
About company
  • Who we are
  • Space mission
  • Blog
  • Help Center
  • Careers
  • Media kit
Merch
  • Tarot cards for traders
  • The C63 TradeTime
Policies & security
  • Terms of Use
  • Disclaimer
  • Privacy Policy
  • Cookies Policy
  • Accessibility Statement
  • Trust Center
  • Security tips
  • Bug Bounty program
  • Status page
Business solutions
  • Widgets
  • Charting libraries
  • Lightweight Charts™
  • Advanced Charts
  • Trading Platform
Growth opportunities
  • Advertising
  • Brokerage integration
  • Partner program
  • Education program
Community
  • Social network
  • Wall of Love
  • Refer a friend
  • Creator program
  • House Rules
  • Moderators
Ideas
  • Trading
  • Education
  • Editors' picks
Pine Script
  • Indicators & strategies
  • Wizards
  • Freelancers
  • Marketplace
Business solutions
  • Widgets
  • Charting libraries
  • Lightweight Charts™
  • Advanced Charts
  • Trading Platform
Growth opportunities
  • Advertising
  • Brokerage integration
  • Partner program
  • Education program
Look FirstLook First