Capital A PN17 Exit May Drag Up to Q1 2026
Judging by the chart action and the word on the street, it doesn't seem like exiting PN17 will happen within 2025. Best case would be Jan-Feb 2026


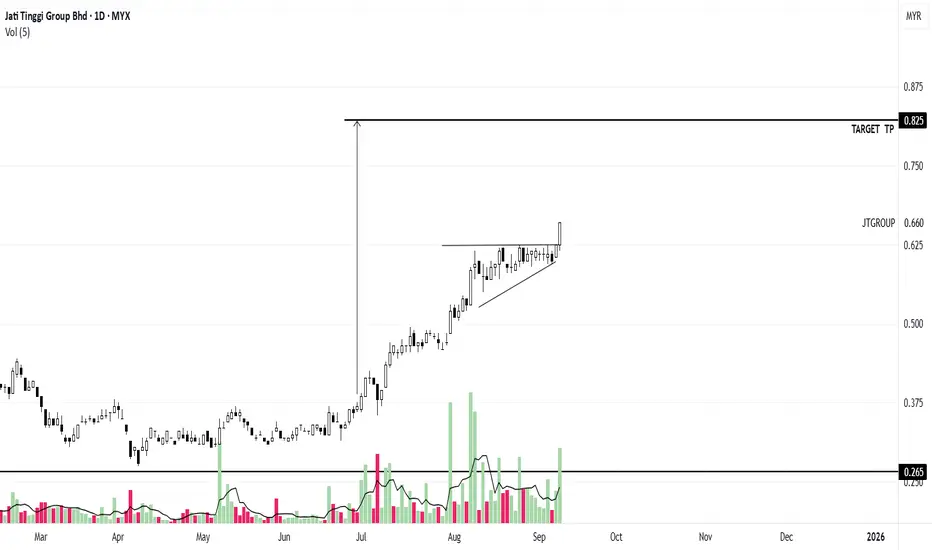
PRICE DIRECTION PREDICT ONLYPREDICT
chart pattern - bullish flag
trend - uptrend
duration monitoring to hit TP TARGET - 1 to 6 month


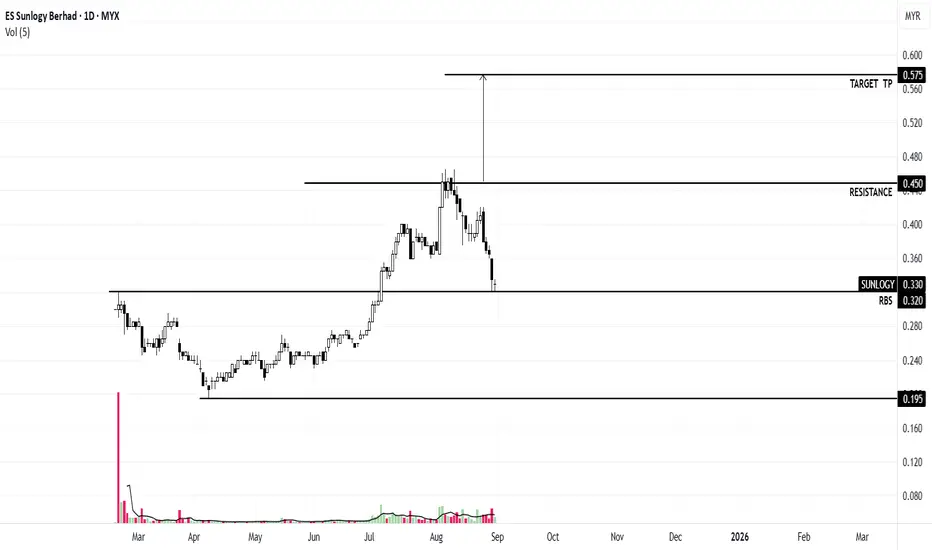
PRICE DIRECTION PREDICTIONPREDICT
trend - uptrend
need to BO R with volume to hit TP TARGET
duration monitoring - 1 month

HUPSENG - dividend gem at an attractive priceThis stock provides awesome dividend yield of around 7.0%.
It recently broke the downtrend with price hovering around 1.00 and forming a tight flag for the past few days.
Looking back, this stock tends to test the MA20 before moving higher so currently, waiting for price to test 0.97 is a reasonable bet.
Dividend ex date for this quarter is on 17.9.2025 so there is a potential for it to touch MA20 by then.
Fundamentally, its sound, nothing fancy.
Recent QoQ revenue was positive. But its hard to find "cookies" like this nowadays.
 Long
Long
SHORT TERM TRADEChart - downtrend
For short term trade only:
Possible entry : RM1.31 - RM1.37
TP : RM1.50 (If breaks beyond RM1.50 with high volume, it means break of structure
SL: RM1.26
#TAYOR


CONTINUATION OF UPTRENDPrice retrace to order block zone. If price breakout beyond RM0.50,
TP at level RM0.60
TP2 at level RM0.70
SL below RM0.38
#TAYOR


UPDATE IDEA PREDICT PRICE DIRECTIONduration monitoring = 2 - 4 weeks
predict price will hit TP TARGET
predict trend is UPTREND
chart pattern - bull

FFB August tradeEP: 1.90 (21.8.2025)
SL: 1.85
TP1: 2.00
Nice consolidation from 25.9.2024 which was above its IPO price.
Stock made a clean breakout on 18 and 19.8 following a spring.
It made a pullback, just hovering above the previous resistance.
MACD golden cross on 4.8.2025 and moved above 0 on the day of breakout.
Market sentiment was bad and defensive stocks were in play.
Holding plan:
Glide along MA15 and once it breaks and closes below, its time to sell.
 Long
Long
KGB Cont'd - Daily timeframe analysis Potential entries?
After the spring on 9.4.2025, there was gap up with a surge of volume the following day.
By 13.5.2025, there was a green candle with large volume pushing the stock towards the resistance of 3.51 again. It didn't manage to breakout and after 14.5.2025, it pulled back towards support, managed to break out on 11.6.2025, but went on to test the support again with an evil wick to hit stop losses.
On the 24th and 25th, it finally made its move to break previous resistances convincingly and glides along the MA15 as trailing support.
Impression:
Trading this stock purely on technicals is challenging. I'll get stopped out several times honestly if I were to buy early on before it broke out. So will have to base it on fundamentals and the potential of the stock as well. But after reviewing the QR, there was nothing much to show as well. There was reducing revenue for several quarters and only later on in August that we can see the stock increased its revenue.
Perhaps in retrospect, the best time to enter was on 26.6 or 30.6 when it made a flag pattern before marking up. Then again, 30.6.2025 was the ex-dividend date where you'll expect the price to drop first so I won't be touching this stock. So another lesson is maybe an approaching ex-date should not negate the consideration to enter a trade.
 Long
Long
KGB - the importance of waiting for a clear breakoutIn the weekly chart, KGB formed a volume contraction pattern (VCP) from 10.6.2024.
The resistance was formed around 3.51.
On 11.11.2024, there was a large green candle with large volume and the following day, another green candle with large volume ensued. But this did not break the resistance.
The MACD also showed a golden cross.
Price consolidated along the resistance line until 30.12.2024, then started to dip by 20% on 7.4.2025. It formed a red hammer but the volume was large and broke the long standing support of this stock. Holders would have cut their positions but this was effectively a spring (wtf?)
Price than steadily climbed back towards the 3.51 resistance, before breaking out on the week of 23.6.2025. Mind you, it was due for a dividend ex-date on 10.7.2025. So I will be put off by this fact.
By then, the stock marked up further until its current price of 5.10 without any significant pullbacks. Thats around 52.5% from the opening candle during the week of its breakout.
Impression:
Buying and holding at the resistance, anticipating a VCP breakout does not usually work in our favour. The ideal situation is to wait for a breakout. But in this case, in the weekly chart at least, the stock didnt give the opportunity to buy by pulling back. But I'm going to have a look at the daily chart next for any realistic opportunities.
Long
CLITE - LOOKING FOR BULLISH SENTIMENTN wave with E, V & N projection.
The chart shows a recent upward correction after a downtrend, with identifiable wave labels (A, B, C).
Price is above Kumo with N level as immediate support (0.225).
Tenkan-sen above Kijun-sen, showing a bullish sentiment.
Price needs to stay above N level (0.225), confirming the bullish continuation.
Entry: Consider a long position if the price breaks above 0.225 with confirming volume.
Stop Loss: Place SL slightly below recent lows, around 0.210, to limit downside risk.
This setup suggests a potential bullish move if the price successfully breaks above the 0.225 level, targeting the V and E projections. Confirmation through volume and price action is crucial for a successful trade.
Monitor price action and volume during breakout. If the price fails to break above 0.225 or reverses, consider avoiding entry or reversing position.
Note:
1. Analysis for education purpses only.
2. Trade at your own risk.
 Long
Long
WESTRVR - Looking for potential bullish movementN wave with E, V, N & NT projection.
The wave pattern suggests an ongoing correction after a downtrend, with potential for upward movement toward the E and V projections if the breakout occurs.
The price has been consolidating around the NT level (0.250), and a breakout above this could signal a bullish move.
Resistance is near the 0.235-0.240 level; a confirmed break above this level would strengthen the bullish case.
Volume remains relatively stable, so confirmation of a breakout through volume would add validity.
The projections provide targets for potential upward movement:
Short-term target: ~0.250 (NT)
Medium-term target: ~0.290 (N)
Longer target: ~0.305 (V)
Extended target: ~0.330 (E)
Entry: Consider entering a long position if the price decisively breaks above 0.250 with volume confirmation.
Stop Loss: Place SL below recent lows, around 0.220 to manage downside risk.
Note:
1. Analysis for education purpose only.
2. Trade at your own risk
 Long
Long
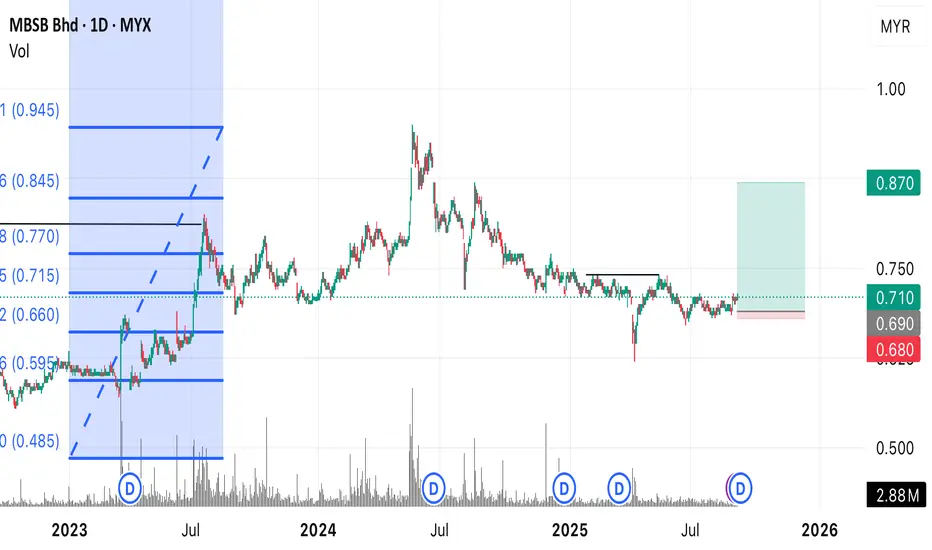
CHANGE OF TREND?External structure chart - downtrend
FIBO still within 50% and below
Possible entry between RM0.69 - RM0.70
Stop loss : RM0.67 and below for low risk
#TAYOR

Kossan. Where is its demand / base / stop? 16 / August/ 22Kossan previous major demand / base / stop was created on 29/ Dec / 2014 weekly bar as shown on chart.


PREDICT price direction - TP TARGETduration monitoring = 1 month
predict price will hit TP TARGET
predict trend is UPTREND


PREDICT price direction - TP TARGETduration monitoring = 1 month
predict price will hit TP TARGET
predict trend is UPTREND

PREDICT price direction - TP TARGETduration monitoring = 1 month
predict price will hit TP TARGET
predict trend is UPTREND


PREDICT price direction -re test RBS & R & HIT TP TARGETduration monitoring = 1 month
predict price will hit TP TARGET
predict trend is UPTREND
PREDICT price direction
-re test RBS
-TEST BACK R
-BO R
-HIT TP TARGET