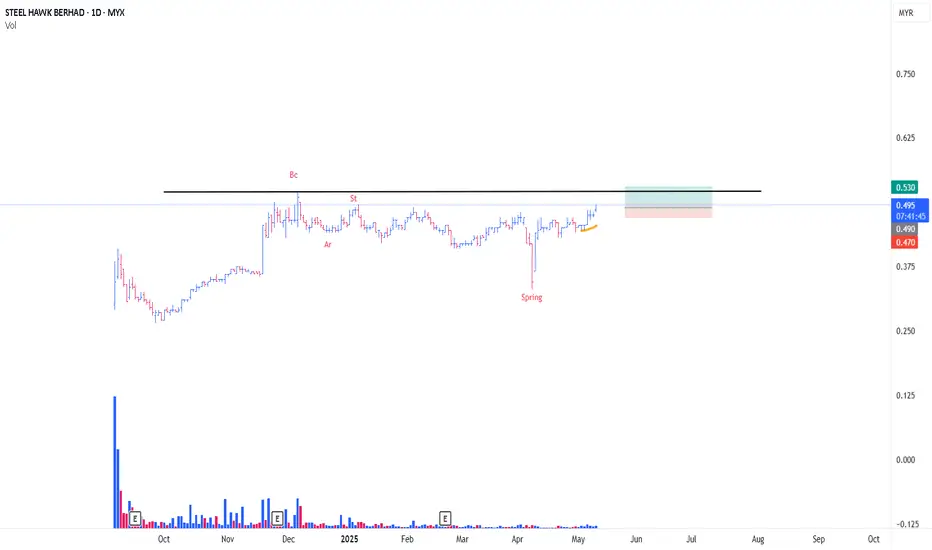
SUNWAY TO CONT MARK UPAs plotted , this is a rare Type #1 Schematic of Re-Accmulation
for a wyckoffian, our eyes are trained to spot any possible / confirmed Spring
Noticed the increase in Supply @ 9/5/25 (Black Arrow)
Despite that, Trigger Bar formed today
-This is A sign of SpringBoard that formed through absorption
As such, entry initiated as attached with a very tight SL
PureWyckoff
PEKAT MARKING UPA Type #2 of Re-Accumulation Schematic
previous entry as attached (not too much profit secured)
Past few days noticed the BUEC (phase D)
With that in mind, possiblity starting of the campaign for phase E, which is price to mark up outside the Trading Range (BOX)
With A Trigger Bar today, position initiated with tight risk
PureWyckoff
KPJ MARKING UPAn Atypical Re-Accmulation Scehmatic # 2 (The rising bottom)
Very Straighforward Chart
- BUEC in Action (yellow Line)
Noticed the formation of SpringBoard (Red Line)
-Position initiated @ 10/4/25 & 15/4/25
-interestingly, there is a an atypical local spring with huge vol,
that 'looks' like a success 'test' after that
Tight SL (Original SL moved up)
PureWyckoff
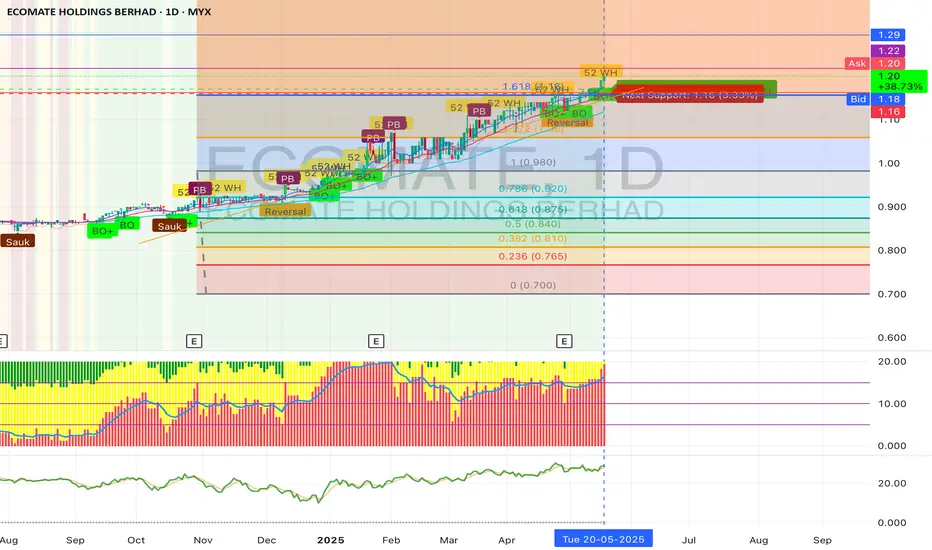
AZAMJAYA has high upside potentialBO:1.09 SL:1.03 TP:1.21 based on the technical factor and the volume seen, there is a high potential of the azamjaya to continue uptrend. From the fibonacci we can see the price is constantly are at the predicted price, the volume also constantly increasing slowly with the price.
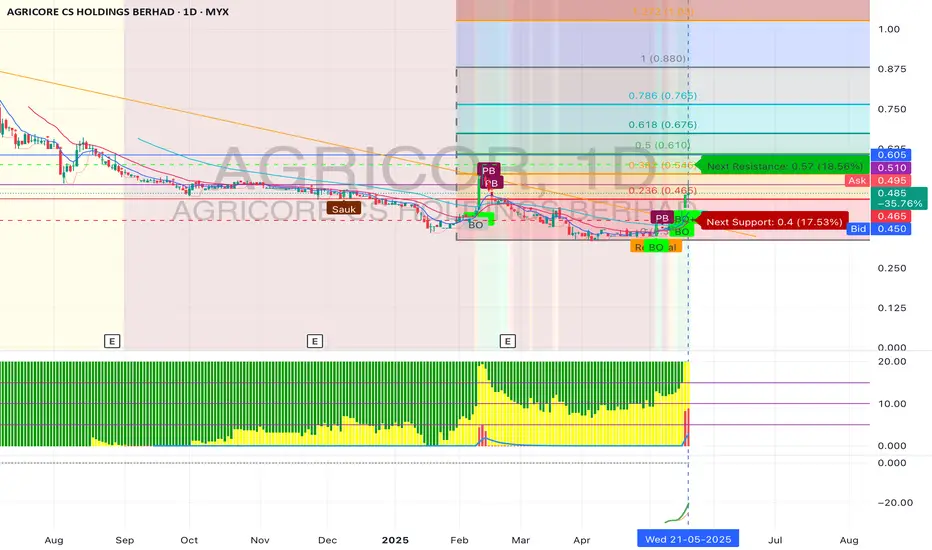
AGRICOR has broken the BDTL From the chart we can see the BDTL has been broken and continue to upside and bullish at the moment. as we can see from the price at the moment has far down from the day it listed and may have a high potential to invest or swing at the moment.Based on the technical factor , the fibonacci has many upside potential and low risk. BO:0.48 SL: 0.39 TP: 0.55
ATAIMS - Analysis on the potential price movementN wave with E, N & NT projection.
The price recently broke above a descending trendline, now acting as potential support.
After breaking the trendline resistance, price attempted to push up but is currently retracing slightly.
The price is just inside the down Kumo (resistance).
The cloud is thick and reddish ahead, indicating resistance and possible consolidation or pullback.
The stock is facing resistance from the Kumo and the thick red cloud above suggests a potential struggle to move higher.
If price falls below the recent breakout point near 0.275, it could indicate a failed breakout and a potential pullback toward recent support around 0.25 or lower.
Volume should be monitored closely; a volume spike to the downside would confirm weakness.
Aggressive entry: Buy near 0.275 if price holds above the breakout line with rising volume and breaks above 0.295 with confirmation.
More conservative: Wait for a clear break and daily close above the cloud (~0.295-0.30) before initiating long positions.
Stop loss: Below the breakout point or recent swing low, e.g., ~0.26-0.27.
Target: 0.295 and the upper resistance 0.315 as initial targets.
Note:
1. Analysis for education purposes only.
2. Trade at your own risk.
ALong
PHARMA - Looking for bullish movementN wave with E, N & NT projection.
The stock has recently broken above a significant downtrend line, signaling a potential trend reversal from a prolonged downtrend.
It also recently moved above the Kumo, confirming bullish momentum.
Pullback after the wave B peak around 0.32, currently consolidating near the Kumo top with support around 0.28-0.29.
Price above cloud - a bullish signal.
Tenkan-sen above Kijun-sen - short-to-mid-term bullish.
Kumo ahead is thin, indicating little resistance on the upside.
Enter near current price or on a slight pullback to support near 0.28-0.29, which aligns with the Kumo top and recent consolidation.
Stop loss below the Kumo (~0.265) protects against a reversal.
Ride the uptrend to target zones, ideally scaling out partial profits at each projection level to lock gains.
The volume breakout in early May confirms strength – a good sign for sustained movement.
Note:
1. Analysis for education purposes only.
2. Trade at your own risk.
SALUTE - Looking for bullish continuationN wave with E, N, V & NT projection.
The price is currently at 0.280, slightly below recent highs around 0.290–0.295.
Recent candles show some selling pressure, indicated by a volume increase and a drop from the highs.
Price is currently trading near the edge and above the Kumo suggesting a bullish momentum.
Immediate support: NT level at 0.275.
If price holds above NT level 0.275:
Look for consolidation or potential bounce. This level acts as a pivot; a bounce here could test recent highs again near 0.295 and potentially higher.
If price drops below the NT level, the next key support is around 0.260 marked by a previous consolidation zone and a potential bounce area.
A break below NT might signal a deeper correction or trend test.
Price action at NT (0.275):
Look for reversal patterns like bullish engulfing, hammer, or increased buying volume before entry.
Volume:
Confirm strength of rallies with higher volumes on up days.
Breakouts:
If price breaks and closes convincingly above recent highs (0.295), it could signal continuation towards the next targets.
Caution:
A breakdown below 0.260 suggests potential for deeper correction. Adjust stop loss and risk accordingly.
Note:
1. Analysis for education purposes only.
2. Trade at your own risk.
Sunlogy challenging the 50% Golden RatioOverall chart shows that the price moving upward and breaking the previous DTL.
Potential Ascending Double Bottom detected at 0.26. We may see the confirmation of this pattern once it breakout above 0.26 and price stay above.
This may resulting uptrending movement and challenging to close the previous gap located between 0.26 to 0.28
Looking forward for what’s going to happen.
This is mainly for education purposes and not a trading advice.
CHB, 0700 area can hold?If the 0.700 level fails to hold as support (considering its role in closing the gap and aligning with the trendline), it may signal a continuation of the downtrend.
A decisive breakdown below this area could indicate weakening bullish momentum, increasing the probability of further downside. Key confirmation factors include volume expansion on the breakdown and failure to reclaim the level in subsequent attempts.
Disclaimer: This analysis is for informational purposes only and should not be considered financial advice. Trading involves risk, always conduct your own research and risk management.
Sunlogy, uptrend line can support?Strong resistance stands at 0.275 ~ 0.290... The question now is whether this move is just to close the gap or if it has the strength to break out.
Currently, indicators are showing overbought conditions... making it more likely to see a pullback soon. During that pullback, it's crucial for price to stay intact with the uptrend line... A clean break below it would weaken the bullish structure and turn the chart setup less appealing.
Disclaimer: This is not a buy/sell call. Always analyze carefully and manage your risk according to your trading strategy.
TMK, reach peak for this round?The 1.380 ~ 1.440 zone remains a strong resistance area... Price has struggled to break through this level before.
This is still a purebear stock, trading fully within a long-standing downtrend channel... The support zone sits around 1.180 ~ 1.270. Let’s see if price pullback to test this area... or if it breaks down further, continuing the bearish momentum.
Disclaimer: This is not a buy/sell call. Always evaluate market conditions and manage risk based on your own trading plan.