INTA - Potential analysis of price movementY wave, target (E) within stipulated range.
N wave with E, N, V & NT projection.
NT (0.485) as immediate support. This is the critical support level. If the price remains above 0.485, it indicates that the market retains its bullish momentum. The price is above the Kumo, indicating a bullish trend. The thin cloud ahead also suggests minimal resistance, which could help propel the price upward.
A potential entry could be placed slightly above the NT support level, around 0.490–0.495, as long as the price stays above 0.485 (NT).
For this setup to succeed, a strong bullish candle or volume spike is necessary to confirm upward momentum. Watch for price action and Ichimoku line crosses for additional confirmation.
This strategy will rely on the ability to maintain bullish momentum above NT (0.485), as any drop below could invalidate the upward trajectory.
Note:
1. Analysis for education purposes only.
2. Trade at your own risk.  Long
Long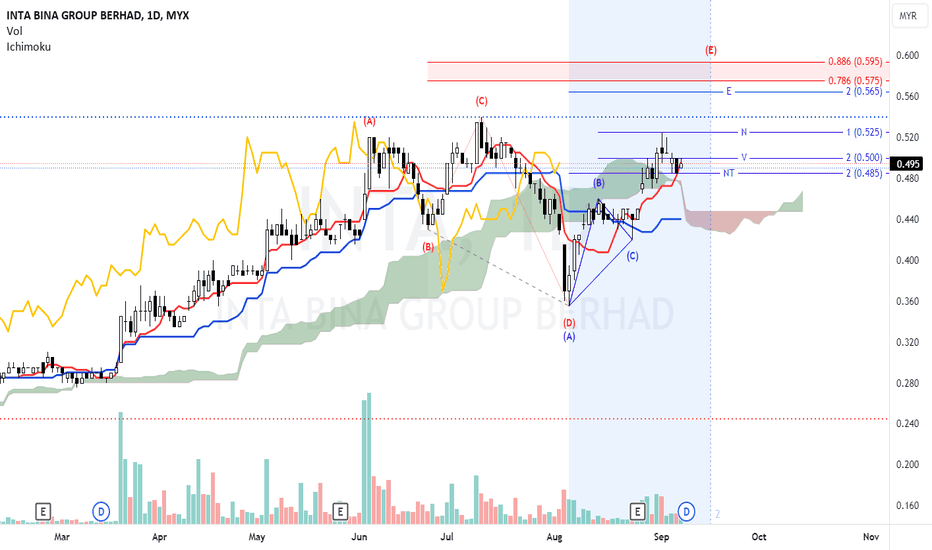
PTT SYNERGY GROUP BERHAD - [PTT]Trend Analysis :
Short-term: The price has been consolidating after a sharp move up in June. The recent price action shows a potential rounding bottom formation, which could indicate a reversal to the upside.
Medium-term: There appears to be a pullback from the high in early August, suggesting a correction phase.
Bollinger Bands :
The price is currently near the middle of the Bollinger Bands, suggesting neutrality. However, after touching the lower band in mid-August, the price has started to move upwards, indicating the possibility of a reversion to the mean or even a breakout.
Volume Analysis :
The volume shows a significant increase during the sharp upward movement in June, suggesting strong buying interest. However, volume has been lower during the consolidation and correction phases, which is typical as the market digests the previous move.
Support and Resistance :
Support: The recent low around MYR2.00 serves as a key support level.
Resistance: The price level around MYR2.40, where the 50-day moving average is currently located, acts as resistance. Breaking above this level could signal further upside.
Candlestick Patterns :
The recent candles show small-bodied patterns with long wicks, suggesting indecision in the market. This could indicate a potential reversal if a strong candle appears.
Conclusion :
The stock is currently in a consolidation phase after a significant move up. The price is testing the 50-day moving average, and a breakout above this level could lead to a bullish continuation. Watch for a break above MYR2.40 with increasing volume for a potential entry signal. Conversely, a breakdown below MYR2.00 might indicate further downside.
 Long
Long
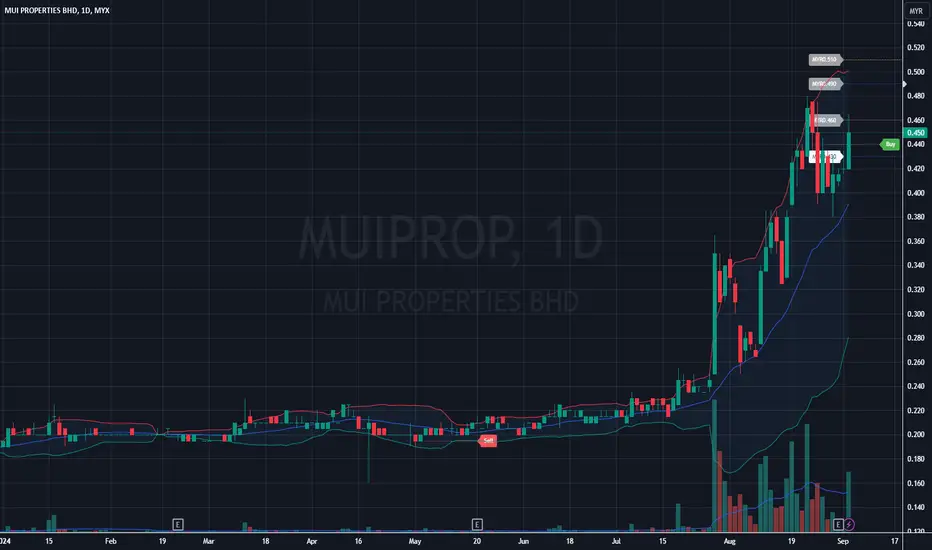
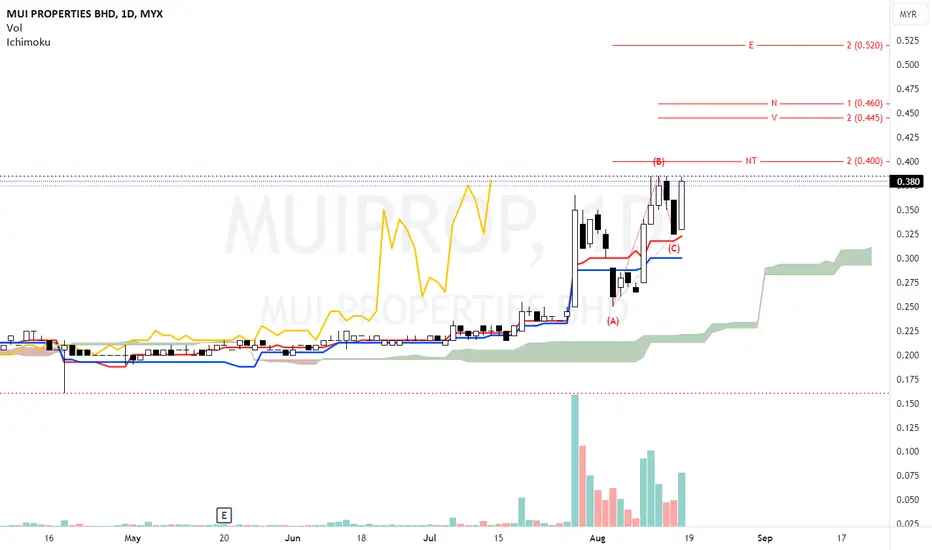
MUI PROPERTIES BHD - [MUIPROP]Trend Analysis :
Uptrend: The chart shows a strong uptrend starting from late July to early September. The price has been making higher highs and higher lows, which is characteristic of an uptrend.
Candlestick Patterns :
Bullish Candles: The recent candles are mostly bullish, with the last few candles showing strong upward movement, indicating buying pressure.
Volume: The volume bars indicate a significant increase in trading volume, especially during the last few trading days, which suggests strong participation in the market, likely from institutional buyers.
Bollinger Bands :
Upper Band Interaction: The price has consistently tested or exceeded the upper Bollinger Band, suggesting strong bullish momentum. However, this could also indicate that the price is overextended and might be due for a pullback.
Band Expansion: The bands are widening, indicating increased volatility. This often occurs in strong trending environments.
Support and Resistance :
Support: A support level can be identified around the MYR0.380 area, which is where the price bounced back in late August.
Resistance: The immediate resistance is around the MYR0.465 level (the high on the day of the chart), which the price needs to close above for the continuation of the uptrend.
Potential Scenarios :
Continuation of Uptrend: If the price can break and close above the MYR0.465 resistance with continued high volume, the uptrend is likely to continue.
Pullback: Given the overextended state with the Bollinger Bands and recent sharp upward move, there could be a short-term pullback towards the support level around MYR0.380 or possibly the moving average line.
Conclusion :
The stock is currently in a strong uptrend with bullish momentum. However, caution should be exercised as the stock might experience a pullback due to overextension. Watching for how the price behaves around the MYR0.465 resistance and monitoring volume levels will be crucial for determining the next move.
 Long
Long
 Long
Long
 Long
Long
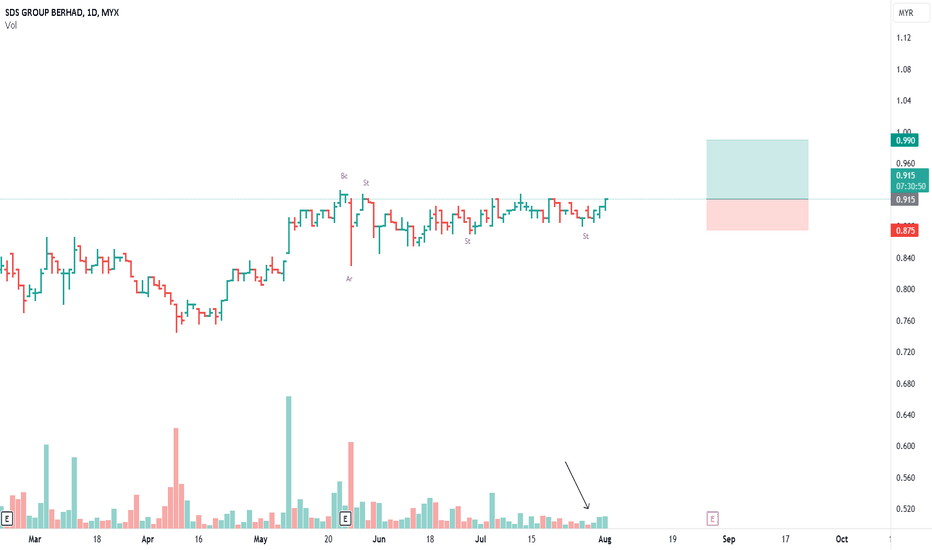
SDS GROUP BERHAD - [SDS]Trend Analysis :
Short-Term Trend: The stock has been in an uptrend since early August, with a notable increase in both price and volume, indicating strong bullish momentum. The recent candles show higher highs and higher lows, typical of an uptrend.
Medium-Term Trend: The medium-term trend has been sideways from May to July, with prices consolidating between MYR0.85 and MYR1.05. The recent breakout above MYR1.05 signals a potential continuation of the uptrend.
Bollinger Bands :
The Bollinger Bands are expanding, which often indicates increased volatility. The price recently touched the upper band, which is generally seen as a sign of overbought conditions in the short term. However, the strong bullish candles suggest that the uptrend might continue, especially if the price stays above the middle band (20-day moving average).
Volume Analysis :
The volume spikes seen during the recent uptrend confirm the strength of the breakout. Increased volume on up days is a positive sign and suggests that the recent price move is supported by strong buying interest.
Support and Resistance Levels :
Immediate Support: Around MYR1.05, which was the previous resistance level before the breakout. If the price pulls back, this level could act as a support.
Immediate Resistance: Around MYR1.20, which is where the stock is currently trading. If the price continues to rise, this level could be tested as the next resistance.
Candlestick Patterns :
The recent candlestick pattern is a strong bullish candle, which suggests that buyers are in control. However, watching for any reversal patterns at the resistance level is essential.
Overall Sentiment :
The overall sentiment for SDS appears to be bullish in the short term, with strong price action, volume, and moving averages supporting the uptrend. However, traders should monitor the price action closely near resistance levels and be cautious of any signs of reversal or consolidation.
 Long
Long
HUP SENG INDUSTRIES BHD - [HUPSENG]Bollinger Bands :
Bands: The chart displays Bollinger Bands, which consist of a middle band (likely a simple moving average) and an upper and lower band.
Current Price: The price is currently near the upper band, which suggests the stock might be overbought. This could indicate potential resistance and a possible pullback if the price doesn't break through this level.
Price Action :
Trend: The recent price action shows a recovery from a previous downtrend that started in early August. The strong upward movement with higher highs and higher lows suggests a bullish reversal.
Candlesticks: Recent green candles with larger bodies indicate strong buying interest. The increase in volume during these upward moves further confirms this bullish sentiment.
Volume :
The volume has picked up significantly during the recent uptrend, which is a positive sign as it confirms the strength of the move.
Key Support and Resistance Levels :
Resistance: The immediate resistance level is around the 1.18 - 1.20 MYR zone, where the price recently peaked.
Support: Immediate support is likely around the 1.05 - 1.10 MYR zone, close to the 50-day moving average.
Overall Sentiment :
The stock appears to be in a short-term uptrend, with potential resistance ahead. The movement above the 50-day moving average, along with increased volume, suggests continued strength, but the proximity to the upper Bollinger Band warns of potential short-term pullback or consolidation.
Strategy :
Bullish: If the stock can break above the resistance level at 1.18 MYR with strong volume, it could signal a continuation of the uptrend.
Cautious: Traders might want to watch for a pullback towards the support area around 1.05 - 1.10 MYR for potential buying opportunities.
 Long
Long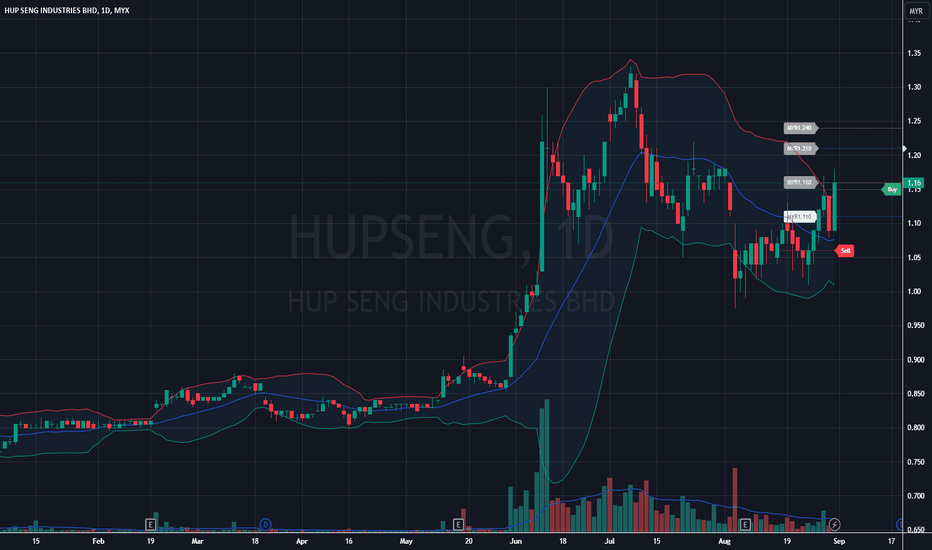
 Short
Short
 Short
Short
PBBANK, still can go further?The overall outlook remains positive, but it's important to note that negative divergence has formed on both the daily and weekly charts. This indicates that the price is moving higher, but the momentum behind the move is weakening.
As a result, it's prudent to protect your downside by setting a tight trailing stop loss. A trailing stop loss is an order that is placed at a certain distance below the current market price. If the price falls to the stop loss level, the order is triggered and your position is closed, limiting your potential losses.
By taking these steps, you can help to manage your risk and potentially increase your chances of profiting from the market.
It's crucial to not only know the right time to buy but, more importantly, to be ready and willing to sell when the time comes!
Disclaimer: The mentioned stocks are based solely on personal opinions for educational and discussion purposes only. There are no buy or sell recommendations. Trading involves financial risk, and you are responsible for your own decisions. The author shall not be responsible for any losses or lost profits resulting from investment decisions based on the information contained herein.  Long
Long
BERMAZ AUTO BERHAD - [BAUTO]Price Action
The stock price is at MYR2.51, showing a gain of +0.07 or +2.87% for the day.
The recent price action indicates an uptrend, with the price rising from a recent low near MYR2.38 to its current level of MYR2.51.
Bollinger Bands
Upper Band: The price is approaching the upper band, which could indicate an overbought condition.
Middle Line (SMA): Price is above the middle line, indicating a bullish trend.
Lower Band: The lower band remains distant from the current price action, showing support.
Volume
Volume for the day is 3.005M.
There is a visible increase in volume coinciding with the upward movement in price, which typically confirms the strength of the current uptrend.
Resistance and Support Levels
Resistance: Immediate resistance is likely near the upper Bollinger Band, which is around the MYR2.67 level.
Support: The middle Bollinger Band (SMA) around MYR2.44 acts as immediate support.
Overall Trend
The stock is showing a bullish trend on the daily chart, with a potential for further upward movement. However, the proximity to the upper Bollinger Band suggests that there might be some resistance, and a pullback could be possible if the price fails to break through the resistance level.
Key Indicators to Watch
Breakout or Reversal: If the price breaks above the upper Bollinger Band with strong volume, it may continue to trend higher. Conversely, if it fails to break above, a pullback to the middle Bollinger Band is possible.
Volume: Continued high volume will be key to confirming any breakout.
 Long
Long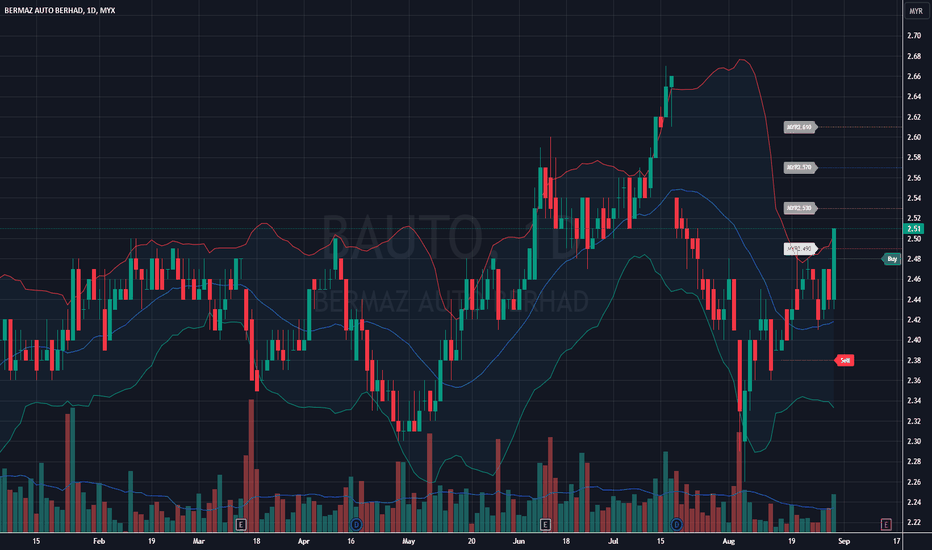
 Long
Long
 Long
Long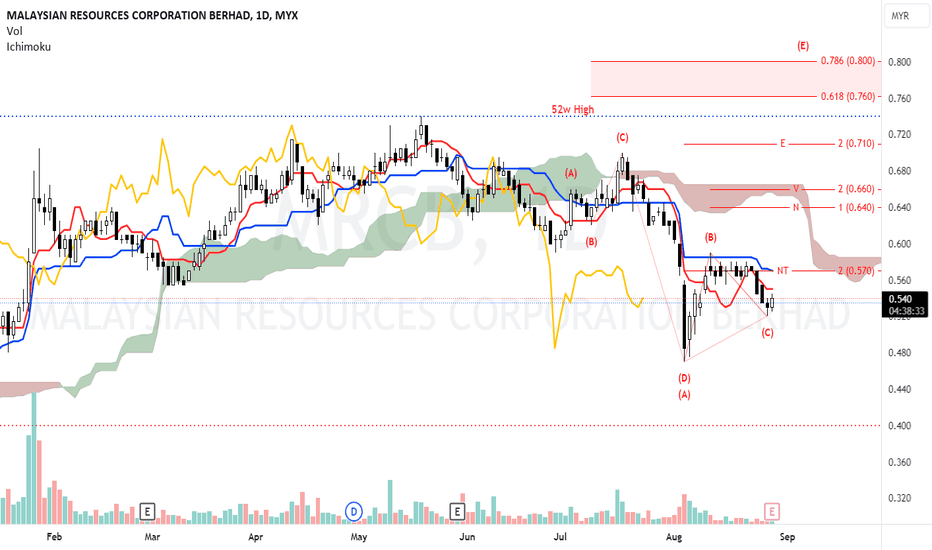
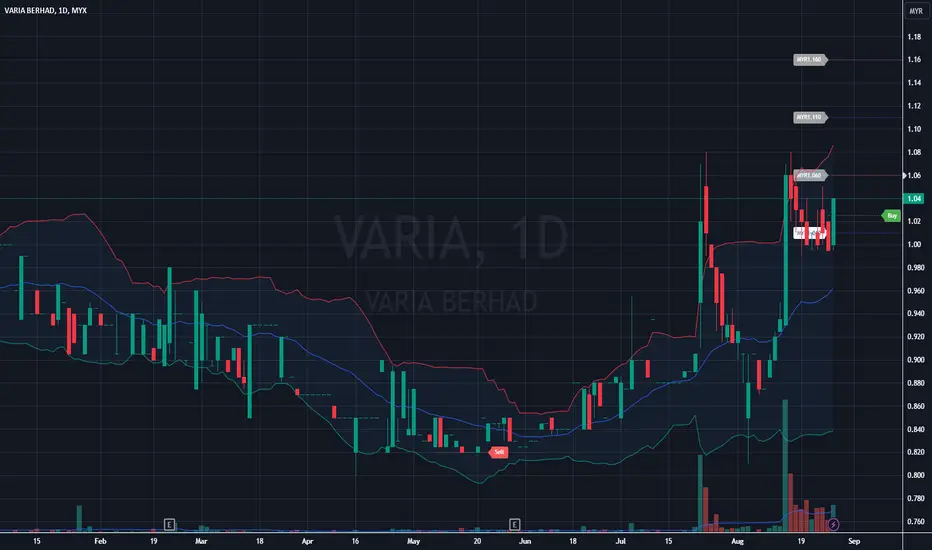
VARIA BERHAD - [VARIA]Overall Trend :
The stock has shown a strong bullish trend since mid-June, with the price rising from around MYR0.84 to current levels above MYR1.00.
Price Action :
The stock experienced a significant spike in mid-July, reaching a high around MYR1.08.
After a pullback, it has recently made another strong move upward in August.
Current price is hovering around MYR1.04, showing continued bullish momentum.
Volume :
Volume spikes coincide with major price movements, particularly noticeable during the July and August rallies.
Recent volume appears to be supporting the upward price action.
Support and Resistance :
A key support level seems to have formed around MYR0.90-MYR0.92.
Resistance appears to be around the MYR1.08 level, which was the previous high in July.
Candlestick Patterns :
Recent candles show long green (bullish) bodies, indicating strong buying pressure.
There are some upper wicks on recent candles, suggesting some selling at higher levels.
Momentum :
The stock appears to be in a strong uptrend, with higher lows and higher highs being established.
Potential Scenarios :
Bullish: If the stock breaks above the previous high of MYR1.08, it could signal further upside potential.
Bearish/Consolidation: A pullback to test the support around MYR0.90-MYR0.92 could occur if profit-taking sets in.
Overall, the technical analysis suggests a bullish outlook for Varia Berhad in the short to medium term, with strong momentum and trend indicators. However, traders should be cautious of potential overbought conditions and watch for any reversal signals.  Long
Long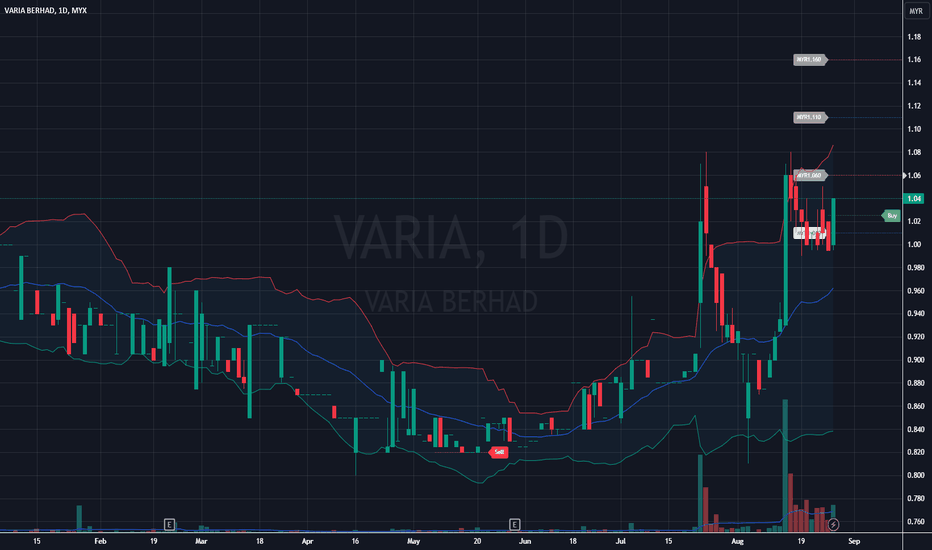
 Long
Long
 Long
Long
Long 
 Long
Long
 Long
Long
Long