• Products
  • Community
  • Markets
  • Brokers
  • More
Get started
  • Markets
  • /Malaysia
  • /Stocks
  • /Ideas
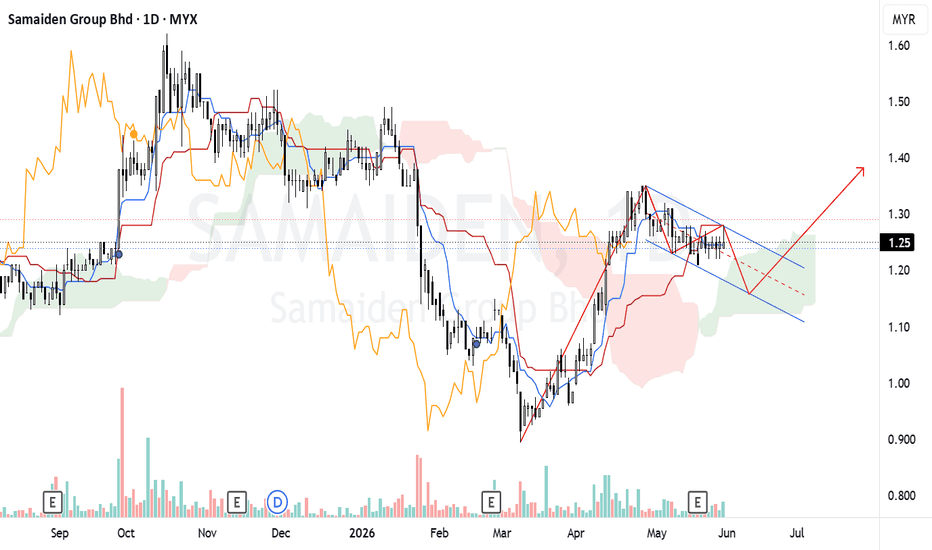
SAMAIDEN - Looking for potential bullish momentumPrice currently close at 1.25 and above but near to Kumo. The cloud ahead looks slightly supportive, so the stock is in a transition zone, not a strong trend yet. Tenkan/Kijun appear compressed, which usually means consolidation and a potential breakout setup. The blue lines suggest a descending channel / bullish flag-like correction after the prior rise. Price is currently coiling near 1.25 inside the structure. This is a classic decision area: Break above channel resistance → continuation higher Break below channel support → pullback toward lower support Resistance: 1.28–1.30 Near-term support: 1.22–1.23 Deeper support: 1.15–1.16 Upside target if breakout holds: 1.35–1.40 Bullish setup Trigger: daily close above the descending channel / 1.28 Target 1: 1.32 Target 2: 1.35–1.40 Stop: below 1.22 Bearish / caution setup If price loses 1.22, the pattern weakens. Then watch for a move back toward 1.15 or the lower channel boundary. The chart is in a consolidation phase after a strong rebound, and sentiment remains cautiously bullish as long as RM1.15–1.20 support holds and price can eventually break above RM1.28–1.30. Notes: 1. Analysis for education purposes only 2. Trade at your own risk
MYX:SAMAIDENLong
by mg6112
Updated
END OF ACCUMULATION?Volume dries and seems that sellers are exhausted TP 0.30++ SL 0.160 Entry: 0.180 - 0.190
MYX:HAILY
by RAR-BSJ
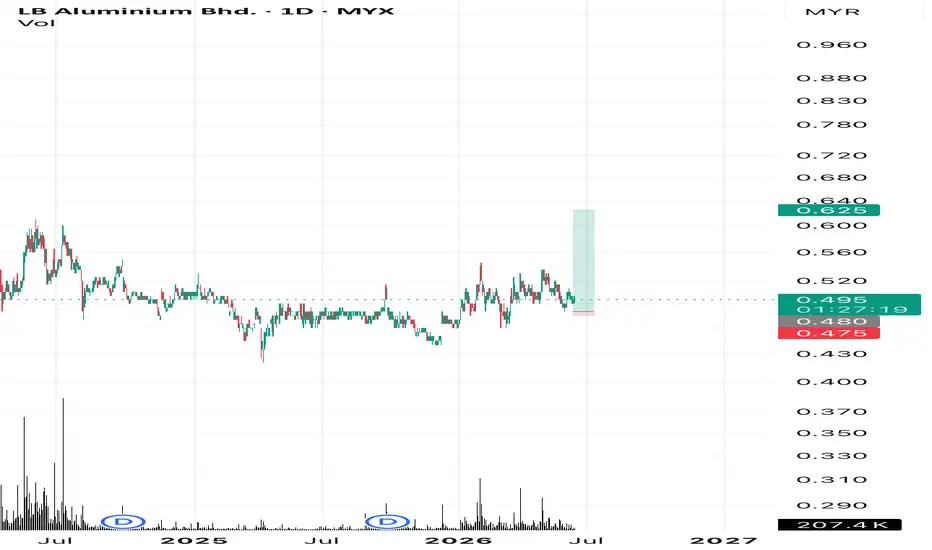
Accumulation or ready to dump?TP 0.635 ( conservative) or sky is the limit depend on the QR results, strong demands SL 0.470
MYX:LBALUM
by RAR-BSJ
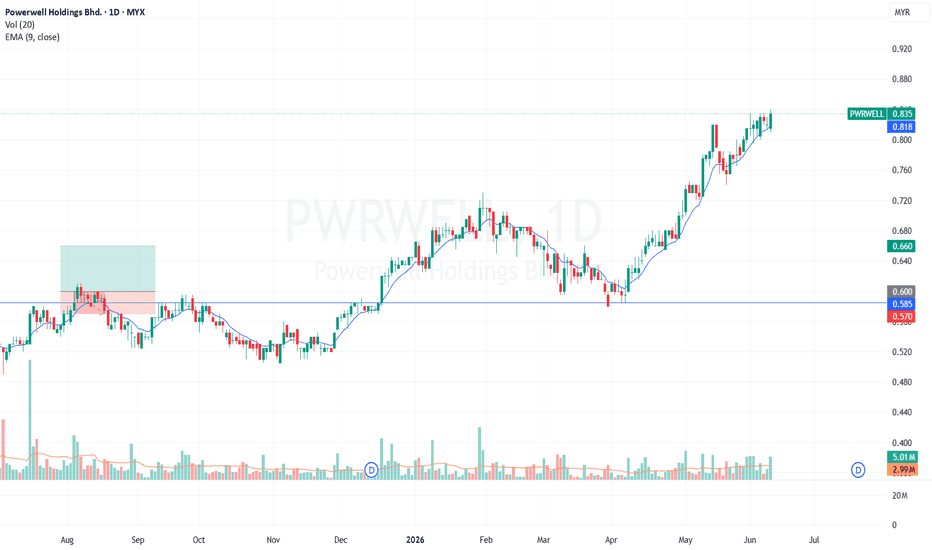
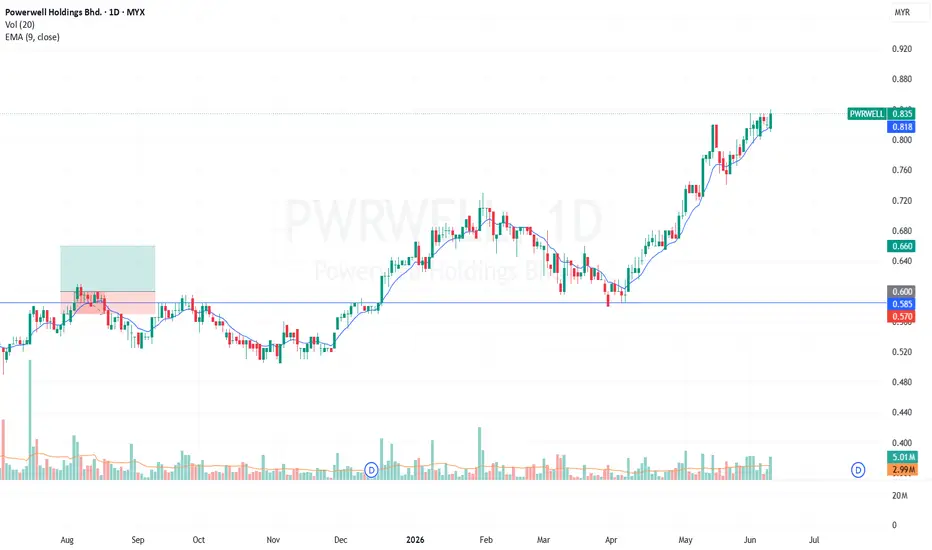
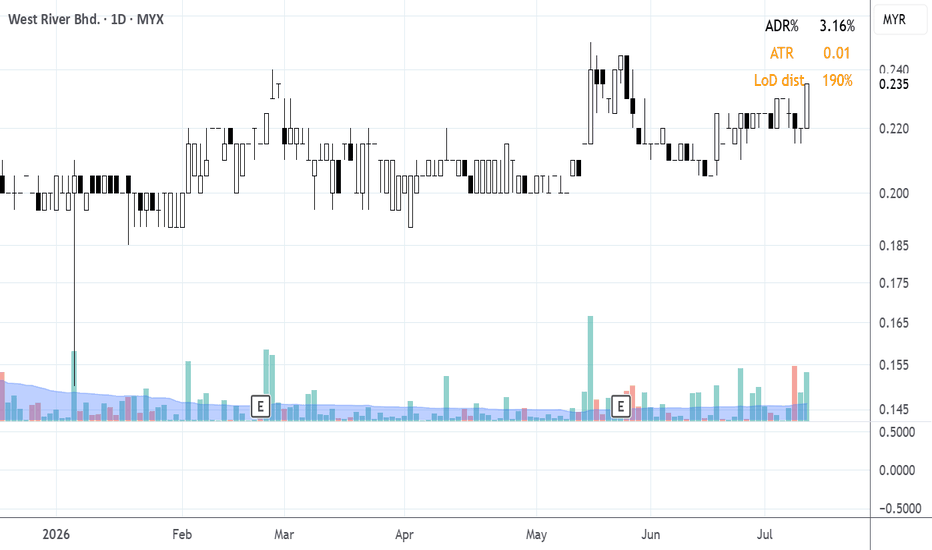
study purpose! not a buy calli can see the price up and breakout, the price can go higher, trade at your own risk
MYX:PWRWELLLong
by TuanAizat
11
SCGBHD TRADE On the 4hr chart, price is in a uptrend and broke a 2.17 resistance zone. It broke with increasing volume and retraced with decreasing volume which shows that sellers are loosing their strength. The 2.17 zone is also the value area low for the anchored volume profile. On the 1hr chart, theres a hammer candle but theres also a double bottom pattern forming. Entry is on the second bottom since it offers us a better rr ratio. stops is before the lows and we aim for a 2:1 RR
MYX:SCGBHDLong
by ikafrs
CBHB TRADE IDEA Price broke a strong multi week resistance level thats been retested multiple times on the 4hr chart. The breakout was fulled with high volume and on the pullback the candles and the volume does not signal that sellers have the strength to push price lower. A formation of a hammer candle marks our entry. Stops is 1ATR below the lows and tp is before the recent high.
MYX:CBHBLong
by ikafrs
Solar Theme Brewing Next?Might enter back to stage 2 based on current chart formation. Possible to become next theme that roll with AI? Data center need green energy for sustainability. Retest the resistance as support (red line). Let's see. My last coverage on this is during 2023. Disclaimer: Trade at your own risk.
MYX:SLVESTLong
by adamkhoosk
SOP TRADE IDEA On the 4hr chart, price broke out of the downtrend with significant volume and pulled back into a weekly support zone at around 4.52. Looking at the Anchored Volume Profile's delta, there's quite big and heavy selling at the zone. However the zone not only holds, but printed a hammer candle. This indicates buyers are absorbing the sell orders and and are willing to defend that level. The hammer candle on the 1hr chart marks our entry. Stops is around 1 ATR below the lows and TP is before the high.
MYX:SOPLong
by ikafrs
NATGATE TRADE IDEA On the 4hr chart, price retraced to around 0.8 zone which acted as a weekly resistance in the past few weeks. It's also a zone where the Value Area Low is at meaning that buyers are probably going to defend that level and cause the price to increase since its considered cheaply priced. Price retraced to the zone from the Value Area High with decreasing volume indicating there's a decrease in sellers participating to push the market lower. The candles on the downside move also dont have big red bodies showing that sellers dont have that big of a strength. Dropping to the 1hr chart, a double bottom formed at the zone and the green candle at the second bottom indicates our entry. Stops is around 1 ATR below the lows and aim for a 2:1 RR.
MYX:NATGATELong
by ikafrs
GCB - Bullish continuation setupPrice has broken out of the prior consolidation and is now holding above the Kumo (bullish shift). Future Kumo turning green (supportive trend). Pattern Confluence (Strong Bullish Case) Cup bottom ~ 0.68-0.70 Rim resistance ~ 0.95-1.00 If breakout and stay above 1.05 confirming the bullish bias. N wave with E, V, N & NT projection. Price is currently testing V/E zone A clean break above E (~1.00) confirms N wave continuation. N is immediate support at 0.935. Price to stay above N to confirmed the bullish continuation. Bullish bias as long as price stay above 0.935 - 0.875. A close back below the breakout zone would weaken the setup. Trading idea Aggressive entry: on a small pullback near 0.935–0.945 Safer entry: wait for a clean close above 0.960 Stop loss: below 0.875 (or tighter below 0.935 if you want a shorter leash) Targets: T1: 0.960 T2: 0.995 T3: 1.05 if momentum continues T4: 1.10-1.15 (extension) T5: 1.20+ (full cup & handle projection) Stop loss: S1: 0.95 S2: 0.93 Bearish/Failure scenario Watch for Rejection at 1.00 with strong selling Break below 0.93 (N level) If that happens: Price may retrace to 0.875 (NT lower support Possibly 0.85 zone. Notes: 1. Analysis for education purposes only. 2. Trade at your own risk.
MYX:GCBLong
by mg6112
Updated
IOICORP TRADE On the 4hr chart, price broke a multi-month resistance thats been tested multiple times with significantly high volume. It then pulled back into the resistance turned support zone at around 4.05 which coincidentally is the value area low for the anchored volume. This indicates that there were large orders placed at that price and the big money are willing to defend it. On the second low of the double bottom that formed at the zone, theres a hammer candle with a long wick to the downside (possibly to capture liquidity) forming. That marks our entry. Stops is 1 ATR below the low and aim for 1.8:1 rr ratio although could possibly aim higher since its a reversal trade.
MYX:IOICORPLong
by ikafrs
LACMED (31/05/2026)Key Observation LACMED (31/05/2026):- 1. Major trend structure remains bullish if price not break the IPO price. 2. Major Wave (2) Correction 3. Sub-Wave (5), Still Not finish the correction yet. Waiting reversal candle with the volume for the pullback.
MYX:LACMED
by haziq221
SIMEPROP - Potential bullish momentumIchimoku Cloud Posture: Bullish Support The price is actively trading above the Kumo, confirming that the broader trend remains bullish. The recent pullback to point (C) perfectly aligned with the top of the Kumo. The Kumo successfully acted as dynamic support, rejecting downward momentum and initiating the current bounce. Ascending Triangle Pattern: Accumulation Phase Higher Lows: The solid orange upward-sloping trendline connects the primary swing low at (A) to the recent higher low at (C). This illustrates consistent buying pressure, as market participants are willing to step in at progressively higher prices. Horizontal Resistance: The top of the triangle is formed by the previous swing high at point (B), resting right around the 1.58 level. The compression between the rising support and this horizontal resistance creates a classic ascending triangle, typically considered a bullish continuation pattern. N-Wave Projection: Assuming the projected upside targets NT - 1.58 V - 1.73 N - 1.75 Price to maintained above NT level to confirm the bullish continuation. Aggressive/Current Entry: Entering near current prices (1.49) capitalizes on the bounce off the (C) level and the Ichimoku cloud, offering a favorable risk-to-reward ratio before the breakout occurs. Conservative/Confirmation Entry: Wait for a decisive daily candle close above the horizontal resistance at 1.58 (point B) to confirm the ascending triangle breakout. Place an SL just below the recent swing low at point (C) and the ascending orange trendline (roughly around the 1.35 level). A break below this structure would invalidate both the ascending triangle and the bullish N-wave pattern, plunging the price back inside the Ichimoku cloud. The chart looks constructively bullish, with an ascending triangle and bullish Ichimoku structure supporting the view that a break above 1.57–1.58 could trigger an N-wave continuation toward 1.73–1.75. Notes: 1. Analysis for education purposes only. 2. Trade at your own risk.
MYX:SIMEPROPLong
by mg6112
KOSSAN - BREAKOUT DOWNTREND LINEThe price broke above the downtrend line with a strong bullish candle and volume spike, showing buying pressure. However, it is now testing the lower Kumo boundary, which acts as immediate resistance around 1.28–1.30. If price can sustain above the Kumo, this would confirm a trend reversal. Tenkan-sen > Kijun-sen, indicating short-term bullish momentum. Both lines are starting to turn upward, showing early signs of a trend shift. The Chikou Span is crossing the price candles, signaling an early bullish transition but still below the Kumo — caution is needed until it clears the cloud. Notes: 1. Analysis for education purpose only. 2. Trade at your own risk. A significant volume surge accompanied the breakout, confirming accumulation activity. Current pullback on lower volume suggests profit-taking rather than reversal. Immediate resistance: 1.28–1.30 (lower Kumo boundary). Next resistance: 1.38–1.40 (top of Kumo). Support: 1.18 (trendline retest) and 1.10 (recent low base). Kossan Rubber shows an early-stage bullish reversal setup. The breakout above the long-term downtrend with volume is a strong technical signal, but the Kumo resistance (1.28–1.38) must be cleared for a sustained uptrend. A successful retest around 1.20–1.25 could offer a good risk-reward entry toward 1.38–1.50. False breakouts are common near trendlines and cloud boundaries; confirmation via volume and subsequent closes is essential.
MYX:KOSSANLong
by mg6112
Updated
SSB8 - Potential price movementThe chart is trying to build a double bottom at 0.540–0.545, and the A-B-C structure supports an N-wave projection toward 0.590. If price can break and hold above the 0.585–0.595 neckline, the pattern would strengthen and the NT projection toward 0.630–0.640 becomes a realistic technical objective. The bullish structure is not confirmed yet. Price is still below an important descending resistance line and close to Kumo overhead resistance. If 0.540–0.545 fails, the double bottom is compromised, and the bullish projection becomes much less reliable. Critical support: 0.540–0.545 Near resistance: 0.565 Confirmation / neckline: 0.585–0.595 N projection: ~0.590 NT projection: 0.630–0.640 Bullish Reversal (Early) Price holds 0.540–0.545 and rebounds above 0.565. Reversal attempt becomes stronger, but still not fully confirmed. Bullish Confirmation Price breaks and closes above 0.585–0.595. Opens path toward N projection ~0.590, then higher. Bullish Continuation / NT Scenario Price holds above neckline and continues upward with momentum. Upside extension toward NT zone 0.630–0.640 becomes possible. Neutral / Sideways Price holds support but fails to break 0.565–0.595. Market is still undecided; pattern remains incomplete. Bearish Invalidation Price breaks below 0.540–0.545 and cannot recover. Double-bottom structure weakens or fails. Pattern is invalidated, downside risk increases. Bearish Breakdown Confirmation Price closes below support and retest fails under 0.540–0.545. Support may turn into resistance. Chart shifts from reversal attempt back into weakness Notes: 1. Analysis for education purpose only. 2. Trade at your own risk.
MYX:SSB8Long
by mg6112
Updated
ISF (26/05/2026)Key Observation ISF (26/05/2026):- 1. Major trend structure remains bullish. 2. Major Wave (2) 3. Sub-Wave (B), Not complete yet, Target=0.570 before rebound
MYX:ISF
by haziq221
OPPSTAR (26/05/2026)Key Observation OPPSTAR (26/05/2026):- 1. Major trend structure remains bearish. 2. Major Wave (2) 3. Sub-Wave (1) 4. Macro-Wave (2) = B --> C Downtrend
MYX:OPPSTAR
by haziq221
CBHB (24/05/2026)Key Observation CBHB (24/05/2026):- 1. Major trend structure remains bullish. 2. Major Wave (3) 3. Sub-Wave (3) 4. Macro-Wave (4) --> (5) Uptrend
MYX:CBHB
by haziq221
CAPITAL A (24/05/2026)Key Observation CAPITAL A (24/05/2026):- 1. Major trend structure remains bearish. 2. Major Wave (3) 3. Sub-Wave (1) 4. Macro-Wave (B) --> (C) Downtrend
MYX:CAPITALA
by haziq221
HI Mobility (5335) - continuation setup backed by fundamentalsFrom a technical angle, HI Mobility looks like it is attempting a continuation after a strong uptrend. What makes the setup interesting is that the chart is not moving in isolation; the fundamentals are also starting to support the move. HI Mobility is essentially a public transport and mobility operator through Handal Indah, with exposure to cross-border and local bus services. Its business is supported by fleet assets, depots, and digital infrastructure, with services spanning scheduled buses, chartered buses, airport shuttle, BAS.MY routes, bus advertising and rental services. The group’s core positioning is in Malaysia-Singapore mobility, especially Johor-Singapore cross-border demand, which remains a structural theme as daily movement between both countries continues to normalise and expand. The latest full-year numbers show clear earnings momentum. For FY ended Jan 2026, revenue came in at RM317.69m, up from RM279.82m a year earlier, while net income rose to RM56.47m from RM43.76m. EPS improved to 11.48 sen from 8.75 sen, showing that growth is flowing through to shareholders rather than only appearing at the topline. What I like is the quality of the earnings profile. Revenue has grown consistently over the past few years; from RM31.47m in FY2022 to RM317.69m in FY2026; and the most recent year still delivered 13.53% revenue growth, despite coming off a much larger base. There is also an element of earnings visibility. Research notes have highlighted HI Mobility’s scalable model, sizeable fleet base, and expansion potential across new contracts and states. Kenanga also noted that the group operated 683 buses and 4 depots as of Feb 2025, with 53 electric buses already deployed since 2023, supporting both capacity expansion and the longer-term sustainability angle. From a business model perspective, the key upside would come if more contracts move toward a gross-cost model, where the operator earns fixed fees based on vehicle-kilometres operated. This could reduce ridership and fare-risk exposure while improving cash flow visibility. Dividends also add to the story. The company declared a fourth interim single-tier dividend of 1 sen per share for FY2026, reinforcing that management is already returning cash to shareholders post-listing. At the latest quoted price of around RM2.30, the market is clearly no longer valuing HI as a cheap IPO recovery name; it is now pricing in growth and execution. That means the setup needs earnings delivery to continue. The key risks are contract renewals, ability to secure new routes, driver/labour constraints, fuel and maintenance costs, and any slowdown in ridership demand. Overall, I see HI Mobility as a technically strong continuation candidate with a fundamental story that is still intact: growing revenue, improving earnings, dividend visibility, public transport exposure, and potential structural tailwinds from Johor-Singapore mobility demand. Not a buy call; just a stock worth keeping on the watchlist while the trend and earnings momentum remain supportive.
MYX:HILong
by razakamirulariff
Buy Public Bank1) Base case Intrinsic Value - Undervaluation 14% 2) Reaction at the the AVG Price 3) Positive MACD Momentum
MYX:PBBANKLong
by izwanriff
JHM (17/05/2026)Key Observation JHM (17/05/2026):- 1. Major trend structure remains bullish. 2. Strong support established after Wave (2) correction -0.275 3. Early impulsive movement suggests Wave (3) initiation. 4. Higher highs and higher lows beginning to form. if 1. A breakdown below the Wave (2), 0.275, the trend will invalid.
MYX:JHM
by haziq221
AQUAWALK (17/05/2026)Key Observation AQUAWALK (17/05/2026):- 1. Major trend structure remains bearish. 2. Still not found either Wave (1) already finish or not yet. If price move up, that means initiation of Wave (2). 3. Lower highs and lower lows beginning to form.
MYX:AQUAWALK
by haziq221
112233445566778899101011111212131314141515161617171818191920202121222223232424252526262727282829293030313132323333343435353636373738383939404041414242
…999999

Made by humans

Select market data provided by ICE Data Services. Select reference data provided by FactSet. Copyright © 2026 FactSet Research Systems Inc.Copyright © 2026, American Bankers Association. CUSIP Database provided by FactSet Research Systems Inc. All rights reserved. SEC filings and other documents provided by Quartr.© 2026 TradingView, Inc.

More than a product
  • Supercharts
Screeners
  • Stocks
  • ETFs
  • Bonds
  • Crypto coins
  • CEX pairs
  • DEX pairs
  • Pine
Heatmaps
  • Stocks
  • ETFs
  • Crypto coins
Calendars
  • Economic
  • Earnings
  • Dividends
  • IPOs
More products
  • News Flow
  • Portfolios
  • Fundamental Graphs
  • Yield Curves
  • Options
  • Macro Maps
  • Pine Script®
Apps
  • Mobile
  • Desktop
Community
  • Social network
  • Wall of Love
  • Refer a friend
  • House Rules
  • Moderators
Ideas
  • Trading
  • Education
  • Editors' picks
Pine Script
  • Indicators & strategies
  • Wizards
  • Freelancers
  • Paid Spaces
Tools & subscriptions
  • Features
  • Pricing
  • Market data
  • Gift plans
Trading
  • Overview
  • Brokers
  • Brokers comparison
  • The Leap
Special offers
  • CME Group futures
  • Eurex futures
  • US stocks bundle
About company
  • Who we are
  • Space mission
  • Blog
  • Help Center
  • Careers
  • Media kit
Merch
  • TradingView store
  • Tarot cards for traders
  • The C63 TradeTime
Policies & security
  • Terms of Use
  • Disclaimer
  • Privacy Policy
  • Cookies Policy
  • Accessibility Statement
  • Security tips
  • Bug Bounty program
  • Status page
Business solutions
  • Widgets
  • Charting libraries
  • Lightweight Charts™
  • Advanced Charts
  • Trading Platform
Growth opportunities
  • Advertising
  • Brokerage integration
  • Partner program
  • Education program
Community
  • Social network
  • Wall of Love
  • Refer a friend
  • House Rules
  • Moderators
Ideas
  • Trading
  • Education
  • Editors' picks
Pine Script
  • Indicators & strategies
  • Wizards
  • Freelancers
  • Paid Spaces
Business solutions
  • Widgets
  • Charting libraries
  • Lightweight Charts™
  • Advanced Charts
  • Trading Platform
Growth opportunities
  • Advertising
  • Brokerage integration
  • Partner program
  • Education program
Look FirstLook First