MFCB super strong support line around 3.85This is a life time opportunity to add massive MFCB position to your portfolio when it drop to around 3.85Longby markthien0
AEMULUS create spring, currently only strong holder 1. **Accumulation and Distribution Phases**: - There's a clear accumulation phase between November 2023 and February 2024, showing price consolidation at lower levels. - A distribution phase appears from June to August 2024, with price making higher highs before reversing. 2. **Wyckoff Schematics**: - The chart shows a "Spring" around March 2023 (when price broke below support then quickly reversed). - Several "Tests" of resistance levels are visible, particularly around June-JulLongby pengamalgelombang0
AAX recalculate wave - current is wave 2wave 2 and it retraces to 0.786, quite deep retracement provides excellent risk and reward ratio the wave will be invalid if current price managed to break support of rm1.28 Current price around 1.52-1.53 MYR with sell/buy buttons visible Multiple buy and sell signals marked throughout the chart A downward trend followed by consolidation and potential reversal pattern Support and resistance levels marked (including 1.71 level) Elliott Wave counting visible with numbered points (1-5) Moving averALongby pengamalgelombang0
MCLEAN - Looking for a strong bullish momentumN wave with E, N & NT projection. The price indicates bullish momentum as it has recently pushed upward. The Tenkan-sen is above the Kijun-sen, indicating a bullish trend. The price has broken through the cloud, confirming further upward movement. Consider entering a long position around 0.310, especially if the price shows a breakout above the NT projection (0.325) with strong volume. Confirmation: Look for a bullish candlestick close above 0.325 to validate this entry. Set a stop-loss at 0.295Longby mg6112Updated 2
CLOUDPT - Monitoring the market direction.N wave with E, N, V & NT projection. The price is currently above the Kumo, indicating a bullish market sentiment. Tenkan-sen is above the Kijun-sen, reinforcing the bullish outlook. The Kumo itself is green, suggesting continuation of the upward momentum. Watch for price action near the upper edge of the cloud for potential breakout signals. Consider entering a long position near 0.915 (current price) or on a confirmed breakout above 0.930, which aligns with the projected resistance levels. ConLongby mg6112Updated 0
KAREX - Bullish sentimentThe price is trading above the Kumo, indicating a bullish sentiment. The Tenkan-sen and Kijun-sen have a bullish crossover, supporting upward momentum. The Chikou Span is above the price, reinforcing bullish confirmation. NT (0.900): This level is immediate support and has been tested as a pullback area. The price has bounced above it, validating its strength. Increasing volume near the breakout suggests strong buyer interest. Consider entering near the current price (0.930) if bullish momentum Longby mg6112Updated 0
MYEG - Analysis of potential market movement.N wave with E, V, N & NT projection. The price has broken above the Kumo, signaling a shift to bullish momentum. The Tenkan-sen and Kijun-sen lines are in a bullish crossover, supporting upward momentum. The Chikou Span is above the price, confirming the bullish sentiment. NT (0.905): This is the immediate support level, with the price sustaining above it after testing it during the correction phase. The Kumo thickness indicates support around the NT level (0.905), serving as a strong area for pMLongby mg6112Updated 0
AWANTEC - Looking for bullish continuationN wave with E, V, N & NT projection. The price has broken above the Kumo, indicating a potential shift to bullish momentum. Chikou Span is above the price and Kumo, confirming a bullish bias. Tenkan-Sen and Kijun-Sen show bullish alignment, with Tenkan-Sen above Kijun-Sen. N at 0.380: A nearest resistance target providing insight into trade exits. NT at 0.355: which acts as immediate support. The price is currently trading above this level, suggesting a continuation of the upward trend. A drop bLongby mg6112Updated 1
CORAZA - Bullish continuationEntry & exit strategy with Fibonacci retracement line. The price has experienced a significant rally, indicating bullish momentum. 52w High (0.675): This is a critical resistance level that the price has tested. A confirmed breakout above this level indicates bullish strength. The price is currently trading above the Kumo, suggesting a bullish trend. Chikou-span is above the price and Kumo, further confirming the bullish sentiment. The Tenkan-Sen and Kijun-Sen lines are trending upwards, supportLongby mg6112Updated 2
CABNET - Looking for strong bullish momentumN wave with E, V, N & NT projection. The price is above the Kumo suggesting a shift in momentum towards bullishness. NT level (0.470) acts as immediate resistance. A breakout above NT level with a strong volume confirming a potential bullish momentum. The Kumo is green, suggesting that the future trend may continue to be bullish if the price closes above the Kumo. Enter a long position at 0.430 if the price holds above this level with bullish candlestick. Set a stop-loss at 0.400, just below theLongby mg6112Updated 1
DIALOG - Is there a strong bullish sentiment?Entry & exit strategy The price is inside the red Kumo, indicating a bearish sentiment. However, it has recently attempted a breakout above the Kumo. The price has retraced to the Fibonacci 0.5 and 0.382 levels after rejecting higher resistance levels. Volume appears to be moderate, with a noticeable spike during the breakout attempt, indicating strong interest at higher levels. The Tenkan-Sen and Kijun-Sen are near the price level, suggesting consolidation. Chikou Span has crossed above the priLongby mg6112Updated 3
MYEG - Looking for strong bullish momentumThe price is above the Kumo, indicating a bullish bias. However, the recent candles show hesitation around the NT level (0.960). The Tenkan-Sen is slightly above the Kijun-Sen, signaling weak bullish momentum. A bullish crossover has occurred, but confirmation requires a strong close above NT. Chikou Span above the price candles, reinforcing bullish momentum. A clear distance from the price would strengthen the trend. NT (0.960): Acts as immediate resistance. Price is testing this level, and a bMLongby mg6112Updated 0
ATAIMS - Bullish bias?N wave with E, N, V & NT projection. Price has broken above the Kumo, confirming a bullish reversal. Tenkan-sen > Kijun-sen, supporting bullish momentum. Chikou Span is above the price, indicating continued bullish sentiment. The Kumo ahead is turning green, suggesting potential further upside. NT Level (0.370) tested as support, currently acting as a pivot zone. V Target = 0.395 (Initial resistance). Entry: Above 0.375, with confirmation if the price closes above 0.370 (NT level). Stop-Loss: BeALongby mg6112Updated 0
DUFU - Small spinning tops after a large bearish candle ?DUFU - CURRENT PRICE : RM1.33 DUFU is in a downtrend as the highs and lows are getting lower since JULY 2024. However, I expect that the bottom may reached since there was a small spinning tops candle appear after a large bearish candle. This spinning tops candle session was traded in high volume indicating that buyers are strong enough to overcome selling pressure. I would aggressively buy if price the share price moves above the spinning tops real body. In this case, if the share price moveLongby IMRAN_96Updated 0
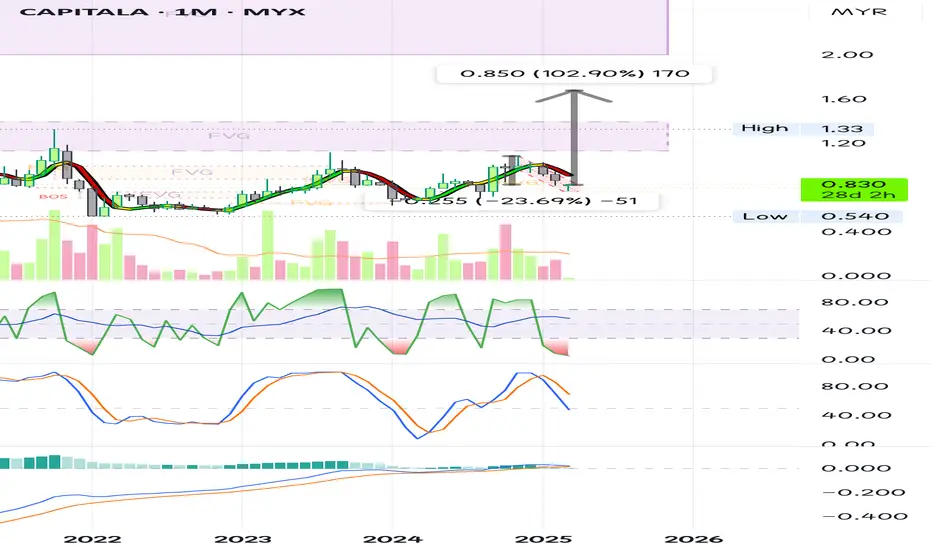
CAPITALA, will it fly?It's always wise to develop and refine your own technical analysis (TA) rather than blindly following analysts' buy calls, such as the recent target price of 1.68 mentioned in local business news today. Based on the charts, the stock has been in a clear downward trend, with the price declining approximately 23% from its recent high of 1.09. If the stock were to rally from its current level to reach the target price of 1.68, that would require a gain of over 100%, which is a significant move. Hby DSELE990
Karex, how traders and inventor react?The stock began its pullback on February 18th but faced heavy selling pressure on February 28th, resulting in a sharp decline. It broke multiple support levels and recorded a significant 16% loss, signaling strong bearish momentum. The MACD remains in a downward crossover (DC) and is below the zero line, indicating continued weakness and a lack of bullish momentum. This suggests that sellers remain in control, and the stock has yet to show signs of stabilization or reversal. Going forward, it Shortby DSELE990
NORTHERN, go southern?The stock price continues to decline, making capital protection a priority. Cutting losses (CL) quickly may be necessary to mitigate further downside risk. Currently, the Relative Strength Index (RSI) is in oversold territory, indicating potential exhaustion in selling pressure. However, the Moving Average Convergence Divergence (MACD) remains in a downward crossover (DC), suggesting that bearish momentum is still intact. As of now, there is no clear signal of a rebound. For a trend reversal tby DSELE990
EKOVESTWe will Expect price of EKOVEST will go to RM0.70 (Minimum) movement due to Ending of Corrective Movement. Fundamental Approach also to be considered where this company have a long-term profitability. Do Your Own Analysis and TAYORLongby muhammadnaqib_nazriUpdated 24
OSK HOLDING, Long Position at RM1.69 ?Possible Big Move coming for Earnings ? As you can see, now the price of this stock's approaching to end of the impulsive wave which is a Wave 5 by making an Inverted Head and Shoulder Pattern to end the corrective Wave 4. With possible outcomes of the price might making a right shoulder at RM1.69 - 1.67 and Targeting to RM1.90 UPWARD MOVEMENT. TAYOR everyone !Longby muhammadnaqib_nazriUpdated 1
KPJ MARKING UPAn Atypical Re-Accmlation Schematic #2 (Rising Bottom) With Supply evaporating (Green Arrow) In the Background of Local Spring, All these, with my assumption that, the St (phase B), acting as a Change of Character (Choch) entry n Stop loss as attached Pure Wyckoff Longby drsyarizUpdated 2
Public Bank Buy SignalP/E trend about industry rate of 11.3. Strong financial a head due strong borrowing for businesses. Continue buy signal 4.48, quarterly results out soon. Longby dennis_sea2
ClOUDPTLooking for long Position @ RM 0.81, Invalidation Level @ RM 0.75 and Target Price is RM 1.15 . Reason for long this stock is due to corrective phase Wave (IV) and expecting price would make an Expanding Diagonal for Wave V . Hence, Fundamental of this Company should be considered for long-term perspective. TAYOR !Longby muhammadnaqib_nazri1
AWCThe price struggled to hold above the 1.140 area, indicating weakness in the current trend. The next key support level to watch is around 0.960. If the price stabilizes here, it may enter a consolidation phase. However, if this support level is broken, further downside pressure is likely. Although the RSI is in the oversold zone, suggesting that the stock may be due for a rebound, traders should remain cautious. The MACD has formed a bearish crossover (DC), reinforcing the downside momentum. Thby DSELE990
CMSB....The stock is facing 1.160 as the nearest resistance level, which could act as a hurdle for further upside movement. Meanwhile, both the RSI and Stochastic RSI are in the overbought zone, indicating that the stock may be overextended in the short term. Despite this, the MACD remains below zero, suggesting that the broader trend has yet to fully turn bullish. Given these mixed signals, the key question for the coming week is whether the stock will experience a pullback before attempting another bby DSELE991
 LongLong
 Long
 Long
 Long
 Long
 Long
 Long
 Long
 Long
 Long
 Short

 Long
 Long
 Long
 LongLong