• Products
  • Community
  • Markets
  • Brokers
  • More
Get started
  • Markets
  • /Malaysia
  • /Stocks
  • /Ideas
HEGROUP - BULLISH CONTINUATIONPrice is near the NT projection, forming a key near-term consolidation zone just above 0.435-0.440. The price is currently above the Kumo, indicating bullish sentiment remains intact. The Kumo is thick and rising, which provides a stable support base around 0.415–0.425. Kumo indicates ongoing support below price with potential for further upside if a breakout occurs. Price is currently testing the Kijun-sen (0.435–0.440 range). The Tenkan-sen > Kijun-sen, suggesting short-term bullish moment
MYX:HEGROUPLong
by mg6112
Updated
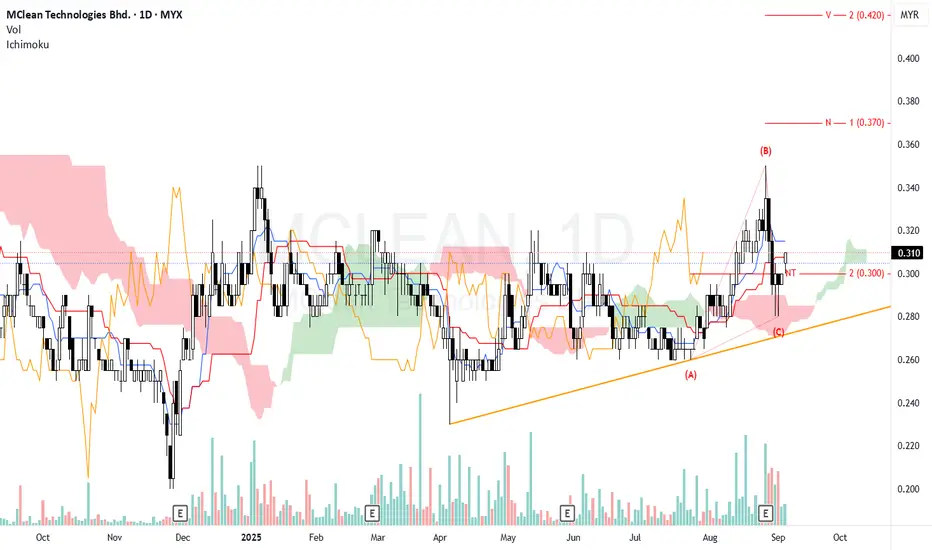
MCLEAN - LOOKING FOR BULLISH SENTIMENTTrend Structure (N Wave) Price formed an ABC correction (A–B–C) and rebounded from point (C), aligning with the uptrend support line. The immediate resistance is around 0.320 (Tenkan & Kijun levels). Ichimoku Price at 0.310 is sitting just above the NT support (0.300). Kumo: Price is retesting the top of the thin Kumo area. A close above 0.310–0.315 would strengthen the bullish stance. Chikou Span: Hovering near candles, needs a clearer breakout to confirm trend continuation. Bullish C
MYX:MCLEANLong
by mg6112
Updated
EXIT PN17: IN THE MAKING Possible entry: RM0.560 - RM0.58 It might tested few times to test your emotion. TP : Your own decision SL: RM0.540 and below #TAYOR
MYX:VANTNRG
by RAR-BSJ
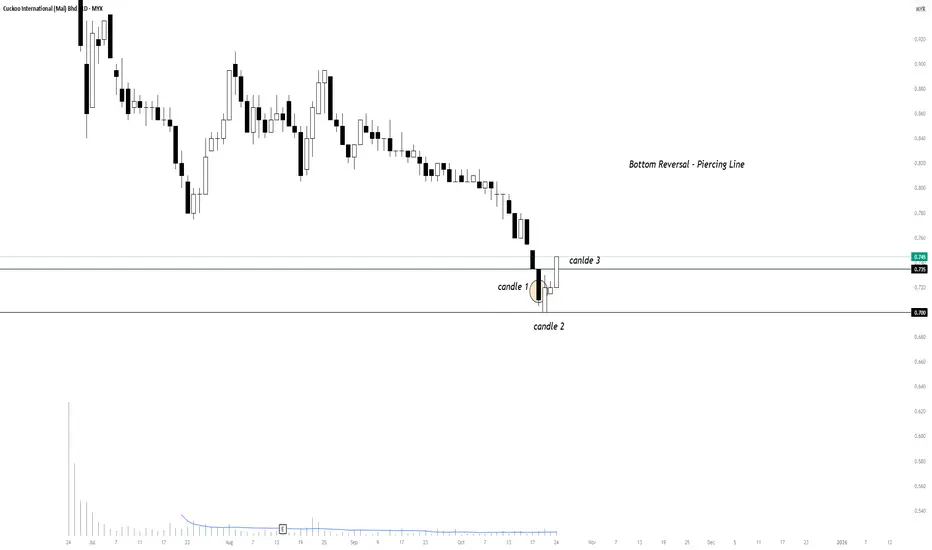
Piercing Line | Bottom Reversal SetupThe chart is showing a potential bottom reversal formation through the appearance of a Piercing Line candlestick pattern — a classic signal that often marks the end of a downtrend and the start of a potential bullish reversal. Candle 1 represents a strong bearish move, continuing the existing downtrend and signaling selling pressure still in control. Candle 2 opens with a gap down but closes above the midpoint of Candle 1’s body — this shift in momentum indicates that buyers are starting to st
MYX:CKILong
by aidilmirza
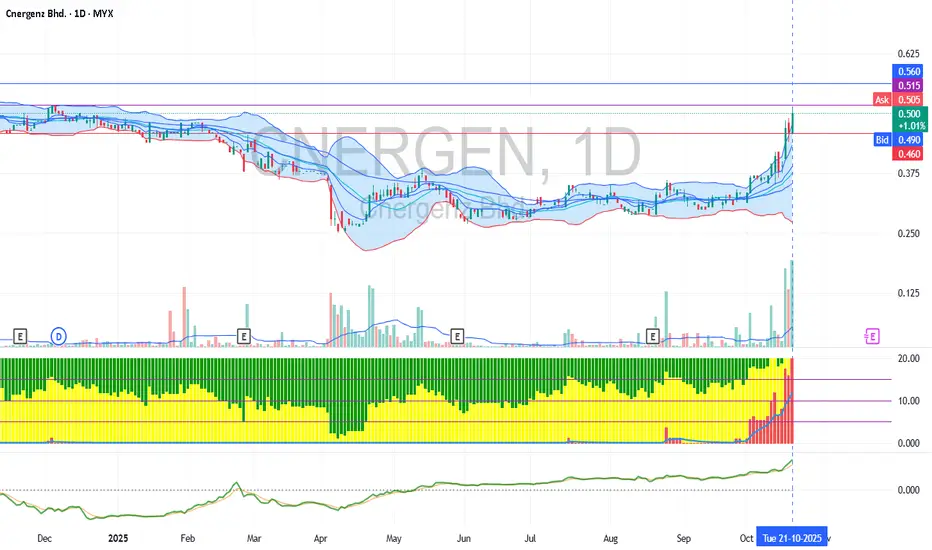
Kekijutsu Framework F1/F2Price currently testing the Kekijutsu F1 (0.382 zone) after a strong breakout from the F2 base. Volume expansion aligns with the bullish continuation structure. Watching closely for: A confirmed break above 0.515–0.560 → potential move toward Kirameki (0.675) and N52WH (0.755) Rejection from current zone → possible retest around 0.465 (F1 support) Kekijutsu Framework combines Fibonacci confluence, structural zones, and price rhythm for precision entries and reaction tracking. Bias: Bullish
MYX:CNERGENLong
by aidilmirza
1
ITMAX TO CONT MARK UPThis is a Re-Accmulation of Schematic #2, Rising Bottom From the pov of BUEC , my hypothesis for now, probably price would be making upward trajectory (Phase E) Taking 23/9 as landmark for the Trigger Bar : -This entry is an atypical type approach as compare to my original tactic -Bar (or Candlestick) @ 24th + 25th + 26th + 29th + 30th September, would be considered as the 'Stage Reversal' -This stage reversal , is also a type of SpringBoard -To be more specific, SpringBoard Sch
MYX:ITMAX
by drsyariz
Updated
Medium Term HoldThis is a good stock to hold for long; fundamentally, it is a good stock to hold because their assets are higher than their liabilities and they have high cash reserves. Technically the counter can be held for a medium term until the price change to a downtrend.
E
by amirulshah
Probably to riseDnex is trying to move upward, but because the financial statement is unsteady, there is no way to determine the price. Therefore, to buy this stock is only for the short term; the long term or medium term is inadvisable.
MYX:DNEX
by amirulshah
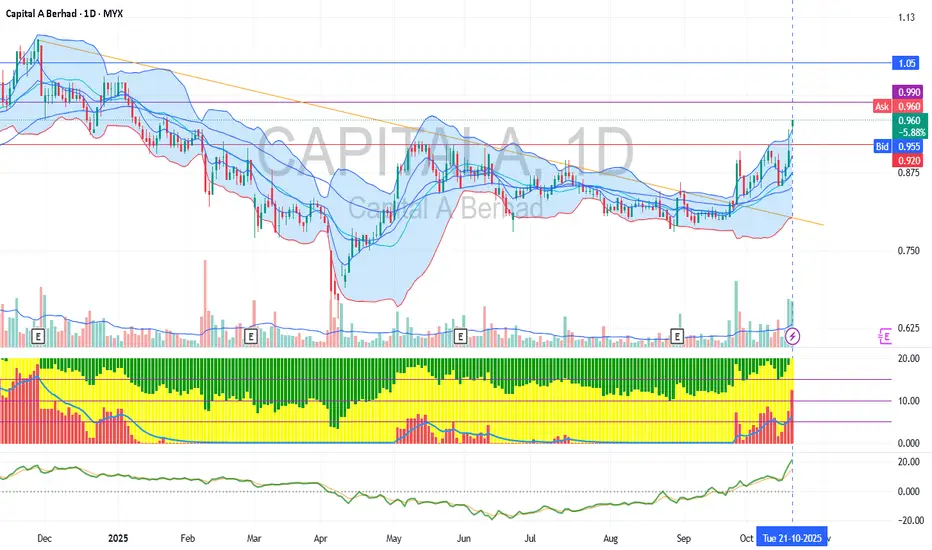
Good sentimentThere was a good sentiment about Capital A, as we can see there was a plan to "change its financial distress status by the year-end." As we can see, they are trying to change their status in a good way. Therefore, the price will fluctuate according to the sentiment and will rise slowly if the sentiment and technology are repaired.
MYX:CAPITALA
by amirulshah
High potentialThere is a lot more potential for the counter to increase in price because it just started rising. Thus, looking at the chart pattern, it rises healthily with a minor pullback and rise afterwards.
MYX:CNERGENLong
by amirulshah
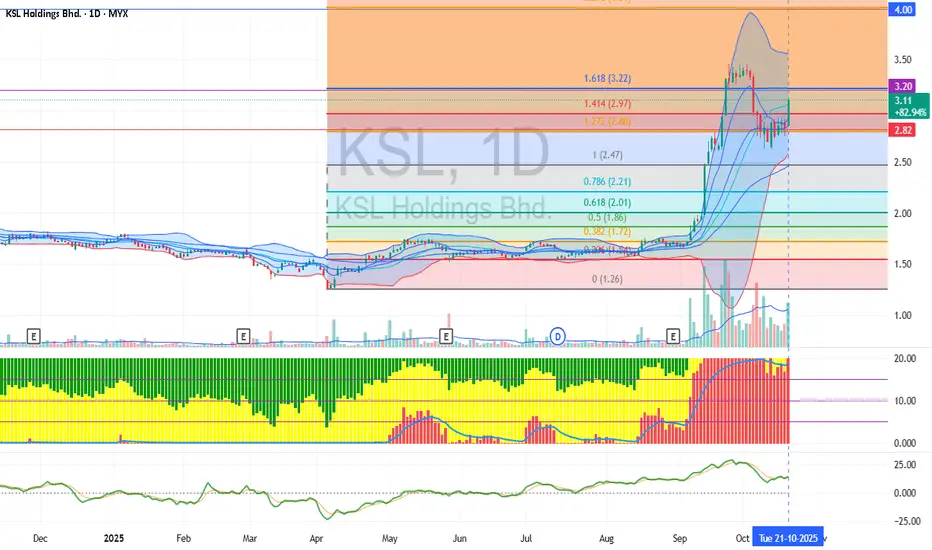
Buy On DipThe price just rises after a short pullback, and it is a good sign that the price is in a healthy way to climb up. By looking at the indicator, the price will either be stagnant or rise slowly.
MYX:KSL
by amirulshah
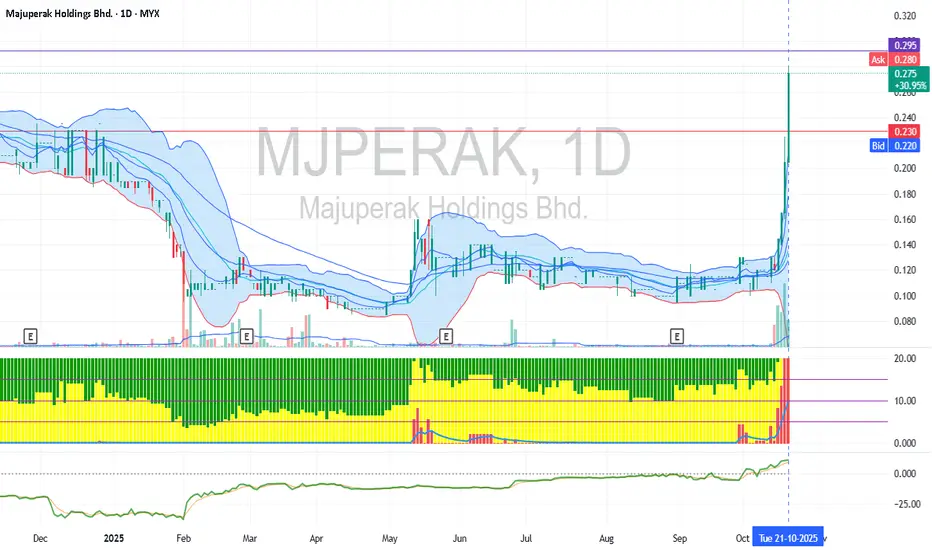
risingMost probably the price will increase if the momentum of volume is still in play. If not, the price will pull back at the support line. The price has increase rapidly in a short time so be cautious when to entry and exit.
MYX:MJPERAK
by amirulshah
PREDICT BOX TRADING SET UP - PVA - PRICE DIRECTION PREDICT BOX TRADING SET UP - PVA - PRICE DIRECTION Predict price will break zone /R / box with volume will test Resistance / TP TARGET duration monitoring - 2 to 4 weeks TFW - Top Volume momentum stock
MYX:TOMEI
by habb288
PREDICT BOX TRADING SET UP - PVA - PRICE DIRECTION PREDICT BOX TRADING SET UP - PVA - PRICE DIRECTION Predict price will break zone /R / box with volume will test Resistance / TP TARGET duration monitoring - 2 to 4 weeks TFW - Top Volume momentum stock Risk - penny stock
MYX:MIKROMBLong
by habb288
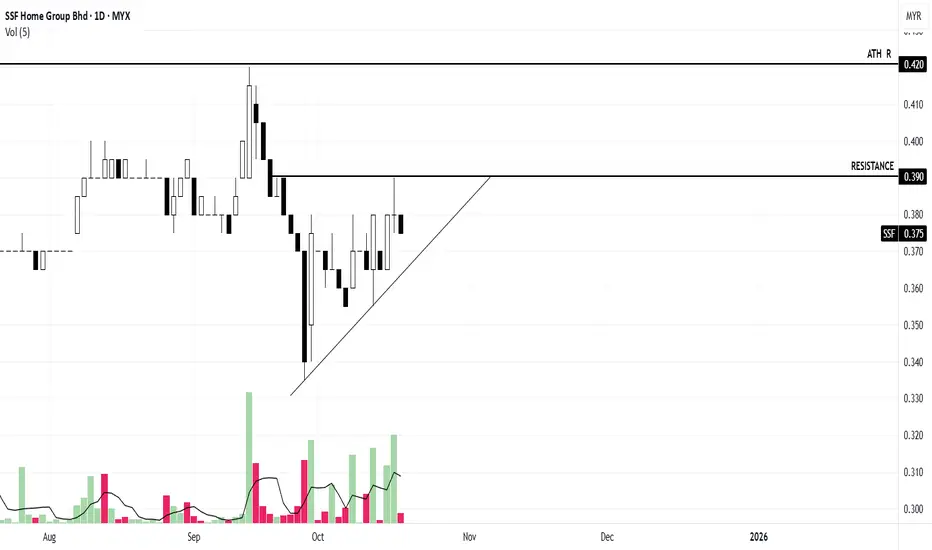
PREDICT PRICE DIRECTION ONLY PREDICT PRICE DIRECTION ONLY Predict trend - uptrend duration monitoring - 2 TO 4 WEEKS
MYX:SSFLong
by habb288
PREDICT BOX TRADING SET UP - PVA - PRICE DIRECTION Predict price will break zone /R / box with volume /base will test Resistance / TP TARGET duration monitoring - 2 to 4 weeks TFW - Top Volume momentum stock Risk - penny stock
MYX:RTECHLong
by habb288
PREDICT BOX TRADING SET UP - PVA - PRICE DIRECTIONPredict price will break zone /R / box with volume will test Resistance / TP TARGET duration monitoring - 2 to 4 weeks TFW - Top Volume momentum stock Risk - penny stock
MYX:ASIAPLY
by habb288
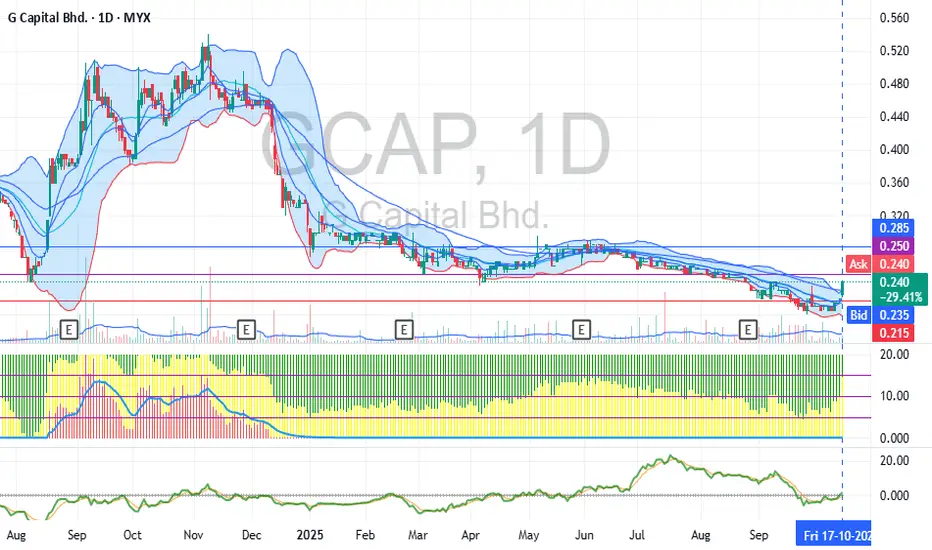
Started to increaseIf the screener and the indicator were right, the trend would change to mark up and will change the trend to an uptrend. Follow the trading plan that I have done.
MYX:GCAPLong
by amirulshah
First BOThe chart shows that the price is increasing at the moment, and looking at the indicator, it will change phase to the markup phase. If following the trend and the trading plan, it will increase in price.
MYX:SALUTELong
by amirulshah
Potential stockWe can see that the stock just BO and maybe pull back for the moment because it has increased for 3 days. If it is still rising, it can have another BO based on the trading plan that I have planned.
MYX:MJPERAKLong
by amirulshah
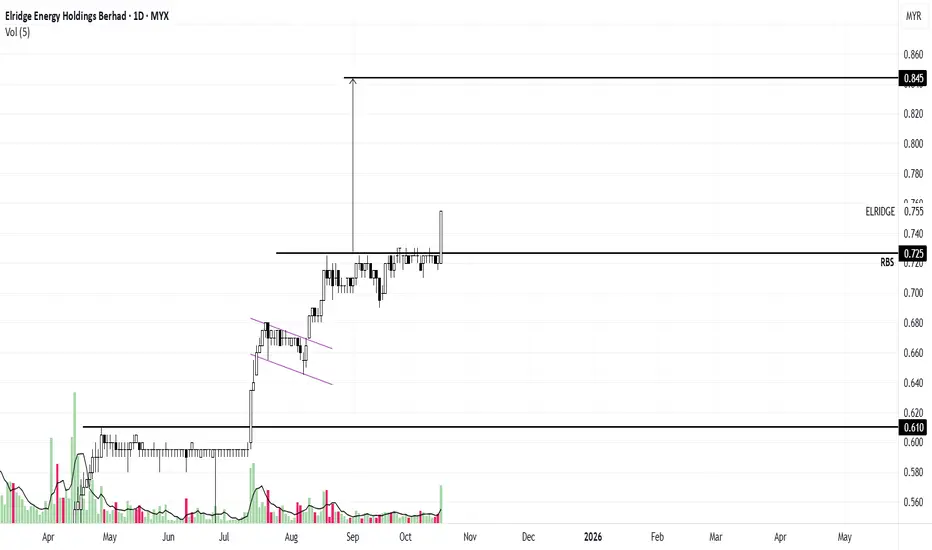
PREDICT PRICE DIRECTION ONLYPREDICT PRICE DIRECTION ONLY Predict trend - uptrend duration monitoring - 2 - 4 WEEKS
MYX:ELRIDGE
by habb288
PREDICT BOX TRADING SET UP - PVA - PRICE DIRECTIONPREDICT BOX TRADING SET UP - PVA - PRICE DIRECTION Predict just break base /R / box with volume will test Resistance / TP TARGET / base back duration monitoring - 2 to 4 weeks TFW - Top Volume momentum stock Risk - penny stock
MYX:SALUTE
by habb288
PREDICT BOX TRADING SET UP - PVA - PRICE DIRECTIONPredict price will break zone /R / box with volume will test Resistance / TP TARGET duration monitoring - 2 to 4 weeks
MYX:CAPITALALong
by habb288
PREDICT BOX TRADING SET UP - PVA - PRICE DIRECTION PREDICT BOX TRADING SET UP - PVA - PRICE DIRECTION Predict price will break zone /R / box with volume will test Resistance / TP TARGET duration monitoring - 2 to 4 weeks TFW - Top Volume momentum stock Risk - penny stock
MYX:NICE
by habb288
123456789101112131415161718192021222324252627282930313233343536373839404142
…999

Made by humans

Select market data provided by ICE Data Services. Select reference data provided by FactSet. Copyright © 2026 FactSet Research Systems Inc.Copyright © 2026, American Bankers Association. CUSIP Database provided by FactSet Research Systems Inc. All rights reserved. SEC filings and other documents provided by Quartr.© 2026 TradingView, Inc.

SOC 2 CompliantGDPR Compliant
More than a product
  • Supercharts
Screeners
  • Stocks
  • ETFs
  • Bonds
  • Crypto coins
  • CEX pairs
  • DEX pairs
  • Pine
Heatmaps
  • Stocks
  • ETFs
  • Crypto coins
Calendars
  • Economic
  • Earnings
  • Dividends
  • IPOs
More products
  • News Flow
  • Portfolios
  • Fundamental Graphs
  • Yield Curves
  • Options
  • Macro Maps
  • Pine Script®
  • MCP Server
Apps
  • Mobile
  • Desktop
Community
  • Social network
  • Wall of Love
  • Refer a friend
  • Creator program
  • House Rules
  • Moderators
Ideas
  • Trading
  • Education
  • Editors' picks
Pine Script
  • Indicators & strategies
  • Wizards
  • Freelancers
  • Marketplace
Tools & subscriptions
  • Features
  • Pricing
  • Market data
  • Gift plans
Trading
  • Overview
  • Brokers
  • Brokers comparison
  • The Leap
Special offers
  • CME Group futures
  • Eurex futures
  • US stocks bundle
About company
  • Who we are
  • Space mission
  • Blog
  • Help Center
  • Careers
  • Media kit
Merch
  • Tarot cards for traders
  • The C63 TradeTime
Policies & security
  • Terms of Use
  • Disclaimer
  • Privacy Policy
  • Cookies Policy
  • Accessibility Statement
  • Trust Center
  • Security tips
  • Bug Bounty program
  • Status page
Business solutions
  • Widgets
  • Charting libraries
  • Lightweight Charts™
  • Advanced Charts
  • Trading Platform
Growth opportunities
  • Advertising
  • Brokerage integration
  • Partner program
  • Education program
Community
  • Social network
  • Wall of Love
  • Refer a friend
  • Creator program
  • House Rules
  • Moderators
Ideas
  • Trading
  • Education
  • Editors' picks
Pine Script
  • Indicators & strategies
  • Wizards
  • Freelancers
  • Marketplace
Business solutions
  • Widgets
  • Charting libraries
  • Lightweight Charts™
  • Advanced Charts
  • Trading Platform
Growth opportunities
  • Advertising
  • Brokerage integration
  • Partner program
  • Education program
Look FirstLook First