 LongLong

 Long

 Long

DPHARMA: READY TO GO?Chart: Uptrend on weekly timeframe
Price is in the phase of accumulation
SL: within swap zone area
#trade at your own risk


MNHLDG GOING TO CONT MARK UPI maintained my previous thesis for MNHLDG
**please refer to my previous
Just need an addition, for the formation of new 'Local Spring' *black color word
i was knocked out on last position for this
market environment dragged MNHDLG despite with a positive surrpise earning
Based on Spring Setup,
looks like Test Of The Spring success at the moment
i initaited position as attached with tight cut loss
PureWyckoff
 Long

PEKAT CONT MARKING UPThis is a continuation of my prev thesis for Pekat
**Refer prev post
Since my previous position, Pekat has been always under my radar.
(This is a Stepping Stone Zone, Continuation from previous Mark Up Phase)
what caught my attention, the formation of BUEC consistenly unfolding in the background of reducing supply (red arrow)
With the formation : type #2 schematic of feather's weight (black line)
*No springboard here. difficult to see this kind of setup
although the entry point, a
 Long

DNEX - Looking for bullish continuationP wave with target (E) within stipulated time.
The last traded price is around 0.296.
The price has recently moved above the Kumo. This suggests a potential shift towards a bullish sentiment or at least a consolidation phase above the previous resistance.
The Chikou Span is above the price action of 26 periods ago and is also above the Kumo, which is a bullish signal.
After a downtrend from early 2025, the stock found support around RM 0.230 in April. Since then, it has been attempting a recove
 Long

NEXG - Looking for potential bullish sentiment.N wave with N, V & NT projection.
The stock has been in a downtrend until mid-March 2025, bottoming around 0.22 MYR.
Since then, a recovery wave formed with a classic ABC corrective pattern:
(A) bottom in mid-April
(B) a peak near 0.39 MYR
(C) a higher low near 0.30 in early May
The price recently moved above the down Kumo, indicating a potential trend reversal from bearish to bullish.
Entry: Consider entering a long position around the current price (0.375) since the price has broken above the
NLong

CORAZA - POTENTIAL PRICE MOVEMENT.N wave with E, N & NT projection.
The price is above the Kumo with Tenkan-sen as immediate support (0.480).
Price needs to maintain above NT level (0.490), confirming bullish continuation and act as immediate resistance.
Entry: Consider entering a long position if the price convincingly breaks above the NT projection level (around 0.490) with volume confirmation.
Stop Loss: Place a stop-loss just below the recent low, around 0.460, to manage downside risk.
Target Levels:
Initial target (N wave
 Long

SIMEPROP... cooking going to tp3 dailySimeprop ... make move goint to tp3 daily
but be caution have divergence ..
TAYOR


 Long

GAMUDA 30-Min Trend Channel Breakout – Short-Term Bullish Setup I've been tracking GAMUDA closely on the 30-minute timeframe, and this setup caught my attention due to the confluence of technical signals pointing towards a potential short-term breakout continuation.
Trend Context:
Price is moving within a well-defined ascending parallel regression trend channel. Recently, it rebounded strongly off the lower channel boundary, respecting the channel support before accelerating toward the upper range.
Bollinger Band Action:
The price is currently riding along
Long
 Long

LOOKING FOR SUPPORT Chart: Uptrend on weekly timeframe
Price is in the phase of distribution.
Possible to retrace down towards 5.60 & 5.25 zone.
Volume -decreasing
#trade at your own risk


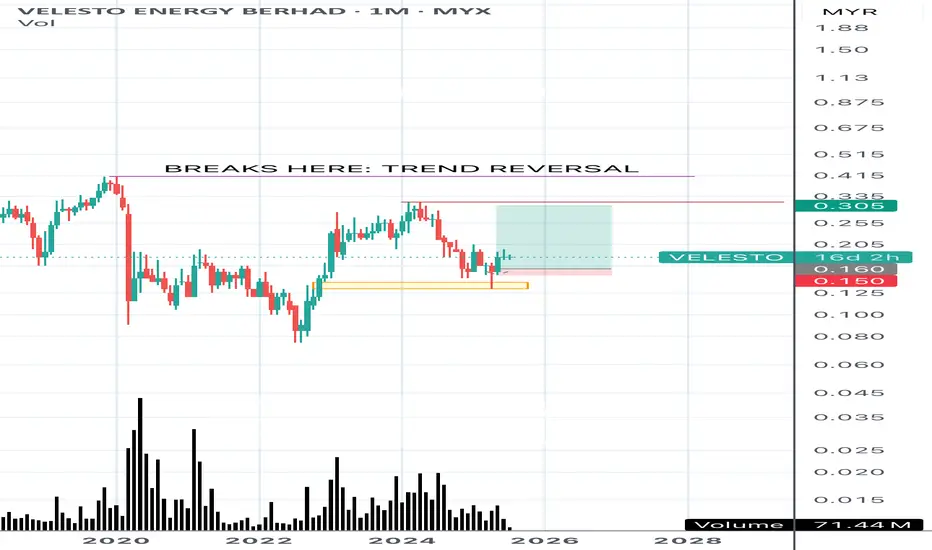
SLOW AND STEADYChart : downtrend on monthly basis
Using monthly chart to look for direction.
Price move slow and steady.
If break 0.415, the trend reversal is on the way.
#trade at your own risk

 Long


WENTEL TRY TO TELL SOMETHING?Chart - downtrend
If the price breaks 0.33 with high volume, this counter can be put in watchlist.
Entry: No entry yet. Just wait & see
 Long

DRBHCOM - The LOW is getting HIGHER !DRBHCOM - CURRENT PRICE : RM0.815
The stock made a HIGHER LOW recently - this may consider as a half portion of new uptrend is completed. A breakout above RM0.930 will form the higher high structure - which confirm the new uptrend phase.
For short term trading purposes, short term traders may anticipate to buy if the stock breakout nearest resistance of RM0.830 - which will give an entry point at RM0.835. So this is a pending breakout stock. Nearest target will be RM0.870 and RM0.910. While s
 Long

SALCON: UPTREND MAY CONTINUEChart - uptrend
If the price breaks 0.475, uptrend may continue provided the breakout should followed with high volume as confirmation of trend continuation.
Entry: Below 0.50 FIBO
the price may visit unmitigated/order block. (pink colour)
SL : Below 0.215 ( the previous HL)


MANIPULATION TOWARDS DISTRIBUTION?Chart - sign of manipulation
If the price breaks 0.580, uptrend may continue provided the breakout should followed with high volume as confirmation of trend continuation.
As for now, just wait and see whether the chart is making distribution pattern or not.
If yes, the price may visit unmitigated/order block. Let’s see and good luck!
#trade at your own risk


READY TO TAKEOFF?Chart - downtrend.
Price currently hover at support level 0.260 - 0.310
Bullish engulfing appeared recently.
Entry: 0.260 - 0.315
SL : 0.255 (just below 0.260)
TP : 0.45


BUYSIDE STILL PERSIST?Chart shows downtrend.
At the moment, just wait & see.
If price break RM2.20 with high volume, trend reversal is on the way.

