• Products
  • Community
  • Markets
  • Brokers
  • More
Get started
  • Markets
  • /Malaysia
  • /Stocks
  • /Ideas
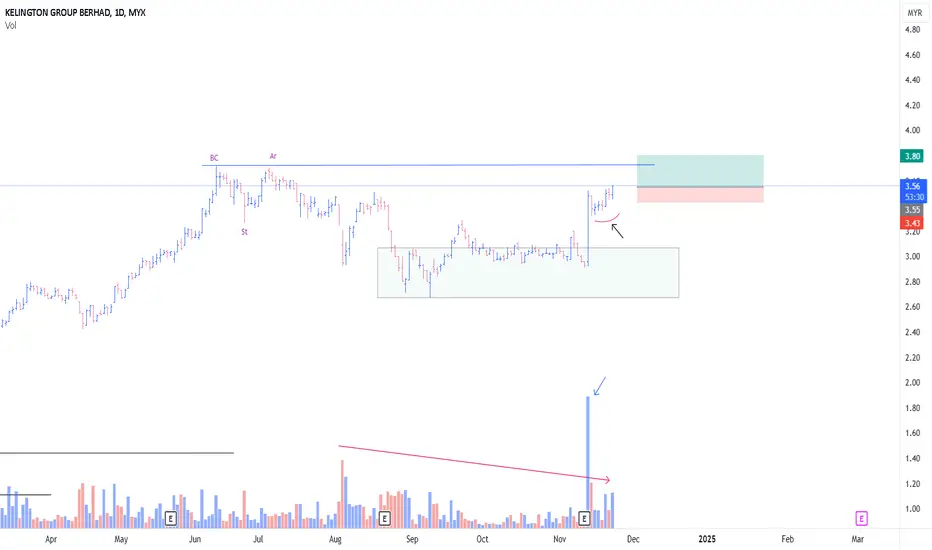
KGB CONTINUE MARK UPThis is a very big Re-Accumulation Pattern But seems like more towards An Atypical Type of Re-accumulation #2 Schematic, The Rising bottom Vol has been evaporating, which probably supply been succesfully absorbed (Red Arrow) What attract me the most, is that , despite Huge demand on 13/11/24 (blue arrow), there were not much selling pressure Current price action might be a sign of LPS, Thus breakout of LPS probably an indication of Continuation of SOS (Sign Of Strength) KGB might be
MYX:KGBLong
by drsyariz
Updated
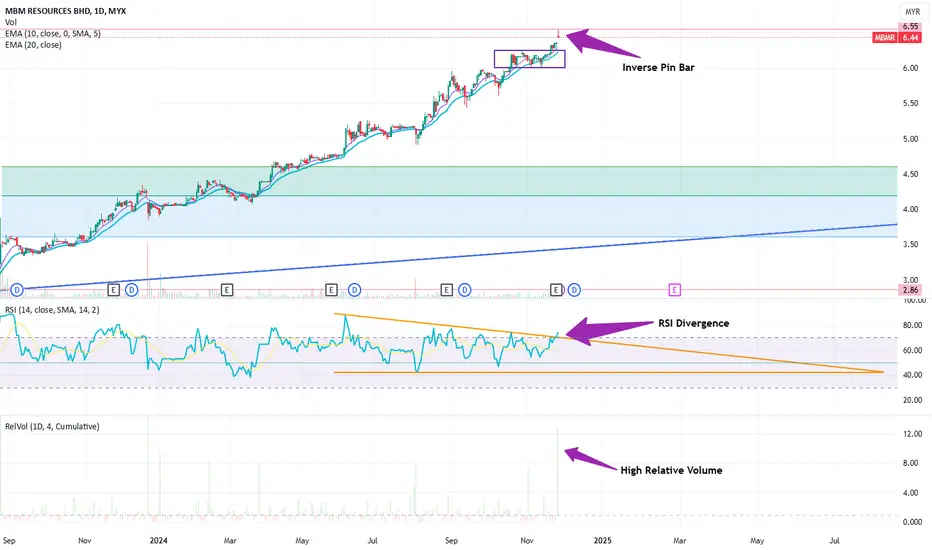
Simple13 Trading IdeaCurrent Price: RM 6.44 I foresee a potential price correction for this stock based on two strong technical indicators, despite its low PE ratio (below 10). Key Observations Inverse Pin Bar with High Volume: The inverse pin bar candle on the daily chart, coupled with high volume, indicates significant selling pressure, a bearish signal that the price might head lower. RSI Divergence: The RSI divergence on the daily chart adds another layer of bearish confirmation, showing weakening momentum ev
MYX:MBMR
by Simple13_Trading
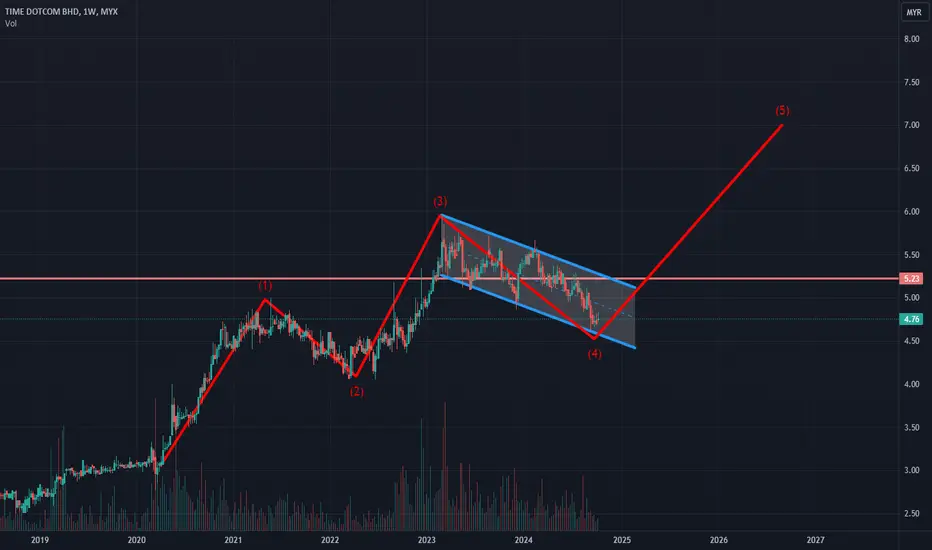
TIMECOM Waiting opportunity on 4.5 Reason for Buy this stock Stock can sustainable provide 7% + dividend per annual Waiting the Opportunity to buy at $ 4.5 as per technical analysis Continues growth on profit since 2017 and cooperate with Malaysia government for 5G internet project. Long Term ( 3 years ) holding stock only and TP on $ 7 7 % dividend per annual * 3 years = 21 % 55 % of capital gain + 21 % = 76 % 76 % / 3 years = 25.33 % per annual Waiting Opportunity for Buy Record holding 0 St
MYX:TIMECOMLong
by newbietrader_TZW
Updated
VS industry Short Term 3 Reason for Trade this Stock As TA, I believe recently downtrend is correction of the previous uptrend. Currently is trading on the support zone and have rejection 3 times. Noticed the MACD showing the downtrend power is lower than previous and it was exhausted. Short Term Trading ( 3 months ) TP on 1.34 with 35.5 % Capital gain within 3 months Record Holding 30 lots holding now
MYX:VSLong
by newbietrader_TZW
Updated
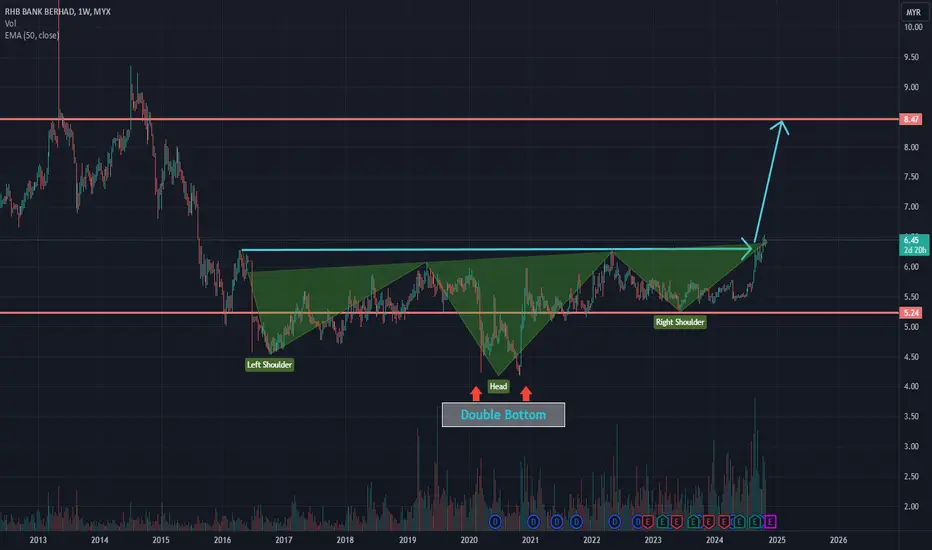
RHB super long term plan Reasons for hold this stock Head and shoulder pattern completed and break out previous high Double bottom formed confirmed the downtrend is over. break out on $6.3 key resistance since 2016. Super Long Term Trading >3 years My TP : $8.47 ( 31.17% of Capital Gain ) Annual Dividend = 6.2% Capital Gain = 31.17% Total Gain = (6.2% X 3)+( 31.17%) = 49.77% SL : $5.24 ( 18.67% of Capital Loss ) Total Loss = 18.67%- (6.2% X 3 ) = 0.07% of Ca
MYX:RHBBANKLong
by newbietrader_TZW
Updated
BAHVEST GOING FOR MARK UPThis is one of the Setup which i really like PowerPlay Setup Price moonshot for 100% past 2-3 months With a Typical ?Probably the classci Schematic #1 Re-Accumulation * Spring possiblity Despite price rising 100%, stil not much selling based on Vol *(Red Arrow) Thus i am humbly initiate position as attached Tight risk for a powerplay Assymetrical leverage PureWyckoff
BLong
by drsyariz
Updated
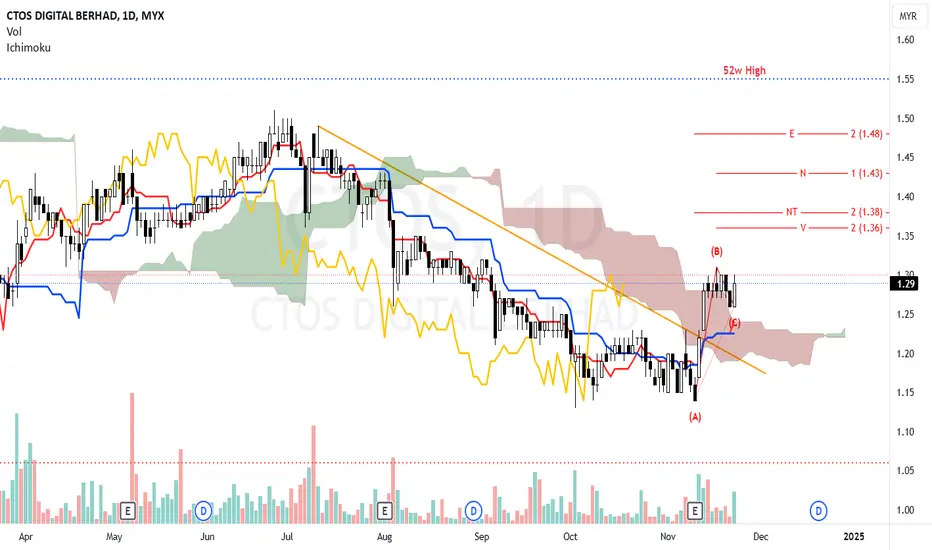
CTOS - Analysis on potential bullish sentimentN wave with E, N, NT & V projection. The price is slightly above the Kumo, indicating a potential bullish bias. Senkou-span B as immidiate support (1.24) Chikou-span - positioned above the price candles, supporting bullish sentiment. Secondary support: Point A (1.14). Entry Level 1: Enter at the current price range (1.29) for an early position. Entry Level 2: Enter additional positions near support at 1.24 (Senkou Span B) in case of a pullback. Stop Loss (SL): Place at 1.22, slightly below Senko
MYX:CTOSLong
by mg6112
THPLANT - Looking for strong bullish momentumEntry & Exit strategy setup. The recent bearish candle is accompanied by moderate volume, indicating selling pressure but not overly aggressive. Wait for confirmation that the price holds near Entry 1 (0.645) or Entry 2 (0.620) before entering. Watch for additional volume support or bullish reversal candlestick patterns. Monitor Ichimoku signals, particularly if the price reclaims the Tenkan-sen and Kijun-sen. Ensure your position size aligns with your risk tolerance, aiming for a risk-reward ra
MYX:THPLANTLong
by mg6112
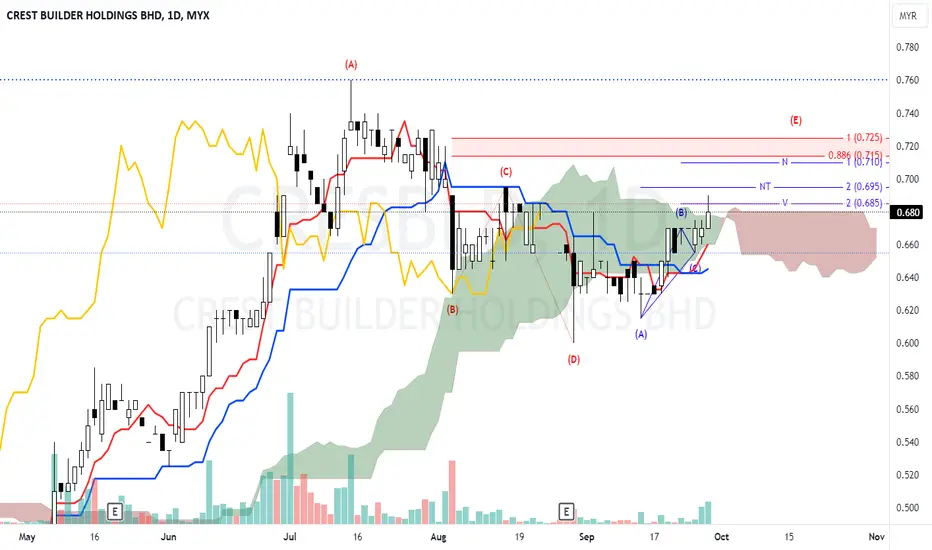
CRESBLD - Analysis on potential of price movementThe price is trading around the Kumo, with recent candles moving just above the cloud. A bullish sentiment is present, but the price needs a confirmed breakout from the Kumo. The Tenkan-Sen is above the Kijun-Sen, signaling short-term bullish momentum. The Chikou Span is slightly below the price, indicating that while momentum is picking up, the breakout confirmation needs to be strong for sustained upward movement. 0.715 (0.886 Fibonacci level): This is a key resistance level before hitting the
MYX:CRESBLDLong
by mg6112
Updated
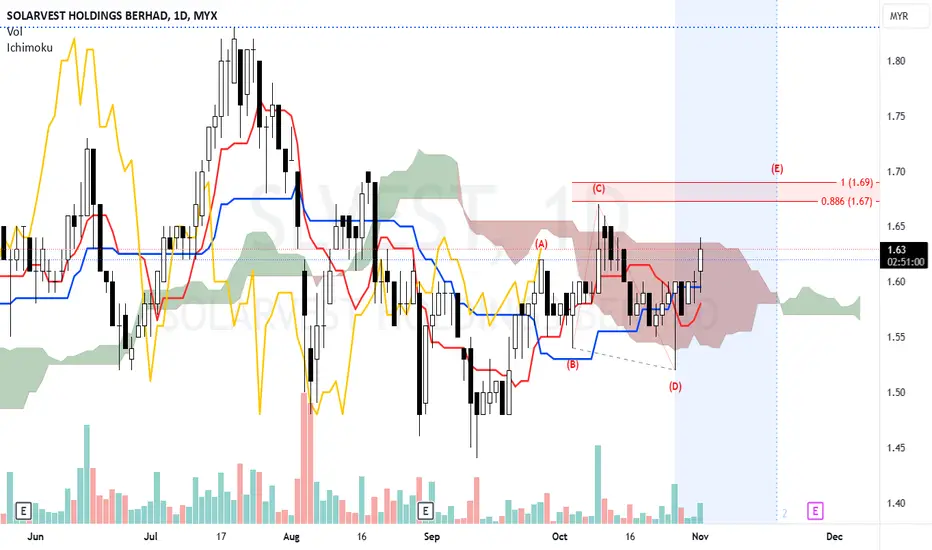
SLVEST - Looking for potential bullish momentumY wave, target (E) within stipulated time. The current price is almost exit down Kumo, suggesting a potential bullish breakout. The Chikou Span is above the price 26 periods back, indicating potential bullish momentum. If golden cross occur, which is typically consider a bullish signal. Volume appears relatively consistent but should be monitored for any increases to confirm momentum. Consider entering a long position as the price is breaking above the Kumo. This breakout could signal further up
MYX:SLVESTLong
by mg6112
Updated
CAPITALA r u seeing what im seeing?soon out of PN17, triple bottoms like the smile on my face, 4 years trendline BO. whats not to like? 🚀
MYX:CAPITALALong
by wongzhengyong
1
KERJAYA - Breakout Monthly High Kerjaya br4akout monthly high, pullback and now retest the high again. Report to be released soon Set my SL and TP according to my risk management Never chase the price, i would rather miss it also dont want to gambling
MYX:KERJAYALong
by VikiSoh
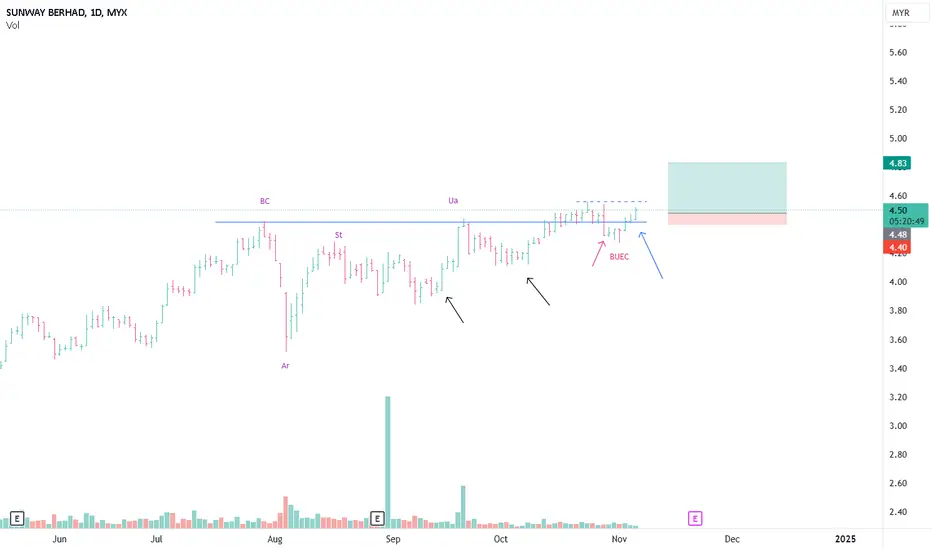
SUNWAY GOING FOR MARK UPSunway, very nice Re-Accumulation pattern Shcematic #2 , The Rising Bottom I have been actively collecting the stocks since 13/9/2024 I sold my position on 28/10/24 (Red Arrow) And re-initiated my position today (Position as attached, Blue Arrow) What attracted me with Sunway, is that, The price Contracting from the left side (Phase A) -> towards the right side ( Phase D , probably) -With vol evaporating Very tight SL, risk priority PureWyckoff
MYX:SUNWAYLong
by drsyariz
Updated
Breakout + Retracement opportunity, Ride the trend !Breakout of downtrend line with significant volume , subsequently with healthy retracement. Ride it for the mid term, SPP 1.38 > New SPP 1.48
MYX:BAUTOLong
by mangojon
Updated
Soon felaiLooking at forex gains will more sustain / stable under this Madani's leadership. Will be benefited from this MYR/USD. Please note, this is not a buy call. More on study purposes.
MYX:PERDANALong
by kemalmuzammel123
AAX EVERYONE CAN FLY TODAYFasten your seatbelt.AAX taking off.Based on my chart. If price break consolidation line with strong volume,possible will fly to 2.55.I will cut loss if price fall below yellow line(Major resistant line become RBS)... Macd already crossed up.Golden Cross *This sharing of analysis shall not be treated as financial advice. Trade at your own risk*
ALong
by Tarmizi86
PMETAL, potential swingOur algorithm has identified potential upward signals in the current market. Increased trading volume and prices above the EMA20 and EMA50 suggest a possible upward trend. 💡Trading idea dan plan: ✅Entry: 4.35 🛑Stop Loss @SL: 4.20 🎯Target Price @TP1: 5.00 🎯Target Price @TP2: 5.45 🎉Target Price @TP3: 5.85 (This trading plan is for reference only and may vary based on your entry point and risk tolerance.) Remember, trading strategies are just 10-20% of your overall success. The real key l
MYX:PMETALLong
by UnknownUnicorn34694209
Synergy House - Cup and Handle PatternSynergy House, a furniture player headquartered in Setia Alam, appears to have formed a Cup and Handle pattern on its technical chart. The company stands out despite the overall underperformance of the industrial products sector. Furniture exporters, including Synergy House, are expected to benefit from a stronger USD. Besides, the company has implemented AI solutions to enhance cost savings. However, a major risk for the company stems from the default risk posed by one of its clients.
MYX:SYNERGYLong
by ZhengQian
HUMEIND shorten will be....The MACD line is crossing below the signal line, indicating a potential bearish crossover. The histogram is also starting to turn downwards, further supporting this bearish sentiment. The RSI is currently below 50, suggesting that the momentum is weak. This combination of signals suggests a potential downward trend in the short term. However, it's important to monitor the indicators closely and consider other factors before making any investment decisions. When the market moves where, and how,
MYX:HUMEINDShort
by DSELE99
AIZO, can become aiyoyo?The MACD and RSI indicators are giving mixed signals for AIZO. The MACD suggests a potential upward trend, while the RSI indicates neutral momentum. This means it's too early to confirm a strong trend. It's best to monitor the indicators closely and consider other factors before making any investment decisions. We cannot control how much we win. But we can control how much we lose. Focus on what you can control! Disclaimer: Please be informed that all stock picks are solely for educational and
MYX:AIZO
by DSELE99
BNASTRA, the coming weeks will be.....Let's analyze BNASTRA using MACD and RSI: MACD : * The MACD line is below the signal line, indicating a bearish trend. * A potential bearish crossover might occur soon, which could signal further downward pressure. RSI : * The RSI is below 30, suggesting the stock is oversold. This could indicate a potential rebound. * However, a sustained period below 30 could signal a stronger downtrend. Combined Interpretation: Both indicators are currently pointing to a bearish trend. However, the ove
MYX:BNASTRAShort
by DSELE99
1
GREATEC - FROM BEARISH TO BULLISH ?GREATEC - CURRENT PRICE : RM2.37 After reach the bottom with a bullish HAMMER CANDLESTICK on 16 OCT 2024, the stock broke out of its downtrend in mid October and is building on a trend reversal, suggesting a bullish bias may be emerging. Based on chart pattern analysis, we can see that there is a DOUBLE BOTTOM pattern. The downward movement from 12 July 2024 have potential of forming V BOTTOM pattern. Today 06 Nov 2024, the share price make a new 2 month high to closed at RM2.37, supported b
MYX:GREATECLong
by IMRAN_96
Updated
Tanco, will it keep dancing?The stock price of TANCO has been rising since September, but it recently pulled back. The MACD indicator suggests potential downward momentum, but low volume indicates a lack of selling pressure. Possible scenarios: * Uptrend resumes: If buying pressure returns, the stock could continue its upward trend. * Retracement or consolidation: The current pullback could be a temporary pause before the uptrend resumes. * Downward correction: If selling pressure increases, the stock could experienc
MYX:TANCO
by DSELE99
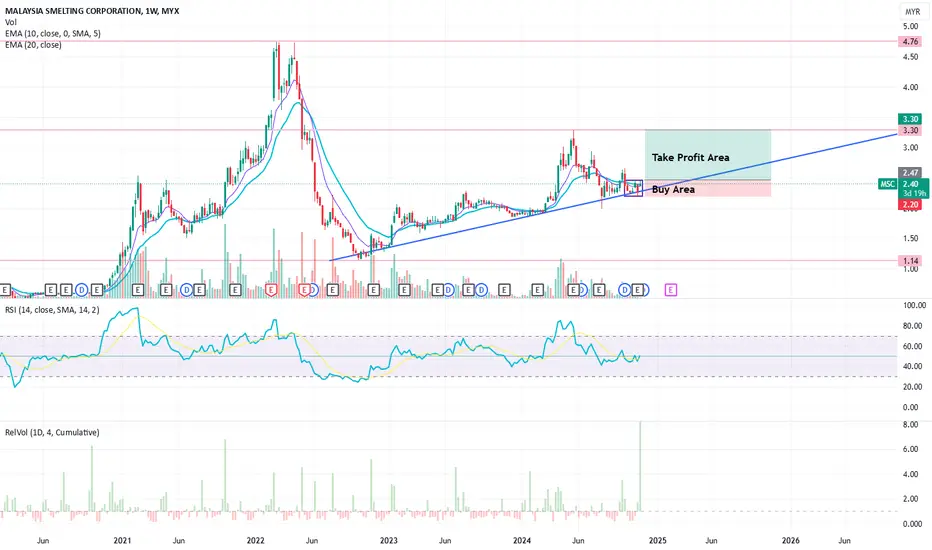
Simple13 Trading IdeaCurrent Price: RM 2.40 (+6.19% today) Today’s quarterly earnings report showed revenue growth but a QoQ profit drop. Despite the profit decline, the stock opened with a gap up, indicating that the results were above market expectations. Key Observations Technical Breakout: Today, the price broke above the 20 EMA on the daily chart. If the upward momentum continues, the 10 EMA could cross above the 20 EMA on both the daily and weekly charts, signaling a strong bullish trend. Tin Price Correla
MYX:MSC
by Simple13_Trading
123456789101112131415161718192021222324252627282930313233343536373839404142
…999

Made by humans

Select market data provided by ICE Data Services. Select reference data provided by FactSet. Copyright © 2026 FactSet Research Systems Inc.Copyright © 2026, American Bankers Association. CUSIP Database provided by FactSet Research Systems Inc. All rights reserved. SEC filings and other documents provided by Quartr.© 2026 TradingView, Inc.

SOC 2 CompliantGDPR Compliant
More than a product
  • Supercharts
Screeners
  • Stocks
  • ETFs
  • Bonds
  • Crypto coins
  • CEX pairs
  • DEX pairs
  • Pine
Heatmaps
  • Stocks
  • ETFs
  • Crypto coins
Calendars
  • Economic
  • Earnings
  • Dividends
  • IPOs
More products
  • News Flow
  • Portfolios
  • Fundamental Graphs
  • Yield Curves
  • Options
  • Macro Maps
  • Pine Script®
  • MCP Server
Apps
  • Mobile
  • Desktop
Community
  • Social network
  • Wall of Love
  • Refer a friend
  • Creator program
  • House Rules
  • Moderators
Ideas
  • Trading
  • Education
  • Editors' picks
Pine Script
  • Indicators & strategies
  • Wizards
  • Freelancers
  • Marketplace
Tools & subscriptions
  • Features
  • Pricing
  • Market data
  • Gift plans
Trading
  • Overview
  • Brokers
  • Brokers comparison
  • The Leap
Special offers
  • CME Group futures
  • Eurex futures
  • US stocks bundle
About company
  • Who we are
  • Space mission
  • Blog
  • Help Center
  • Careers
  • Media kit
Merch
  • Tarot cards for traders
  • The C63 TradeTime
Policies & security
  • Terms of Use
  • Disclaimer
  • Privacy Policy
  • Cookies Policy
  • Accessibility Statement
  • Trust Center
  • Security tips
  • Bug Bounty program
  • Status page
Business solutions
  • Widgets
  • Charting libraries
  • Lightweight Charts™
  • Advanced Charts
  • Trading Platform
Growth opportunities
  • Advertising
  • Brokerage integration
  • Partner program
  • Education program
Community
  • Social network
  • Wall of Love
  • Refer a friend
  • Creator program
  • House Rules
  • Moderators
Ideas
  • Trading
  • Education
  • Editors' picks
Pine Script
  • Indicators & strategies
  • Wizards
  • Freelancers
  • Marketplace
Business solutions
  • Widgets
  • Charting libraries
  • Lightweight Charts™
  • Advanced Charts
  • Trading Platform
Growth opportunities
  • Advertising
  • Brokerage integration
  • Partner program
  • Education program
Look FirstLook First