• Products
  • Community
  • Markets
  • Brokers
  • More
Get started
  • Markets
  • /Malaysia
  • /Stocks
  • /Ideas
Ytlpwr, pullback in making?YTLPWR is showing a strong bearish signal as the RSI, MACD, and even the Moving Averages (MA) lines have all formed a death cross. This pattern suggests a high probability of further downward movement. Investors should remain cautious and closely monitor the next price actions to navigate the potential volatility ahead. The markets took a sharp dive today, with the red wiping out the gains painstakingly accumulated over the past week. Amid the turbulence, the winners were predominantly the big
MYX:YTLPOWRShort
by DSELE99
ANCOM Buy indicator. Swing trading idea.ANCOM financial healthy. . EBITA is positive over 5 years. MACD is on up trend. Up coming QR report is on 13 Jan 2025. Buy at 1.02. Profit taking at 1.10.
MYX:ANCOMNYLong
by dennis_sea
HAWK, still can fly?Currently, the price is trailing below both the Moving Average (MA) lines, which indicates a bearish trend. The Relative Strength Index (RSI) and Moving Average Convergence Divergence (MACD) have also formed a death cross, signaling potential downward momentum. Should the price dip below RM0.440, it could signal an even steeper decline and suggest a challenging market environment ahead. We cannot control how much we win. But we can control how much we lose. Focus on what you can control! D
MYX:HAWK
by DSELE99
SKYGATE testing MA200 and reboundLooking at the chart for Skygate Solutions Berhad, here's my analysis: Current Price Action: - Trading at RM1.03, up 6.19% - Strong breakout from downtrend - Price moving above all major moving averages Technical Analysis: 1. Support/Resistance: - Major support at RM0.900 - Stop loss level at RM0.130 (12.62% risk) - Resistance around RM1.04 (recent high) 2. Trading Setup: - Target price: RM1.26 - Risk/Reward ratio: 1.73 - Position size suggestion: 1538 shares - Good volume confirmation on bre
MYX:SKYGATELong
by pengamalgelombang
1
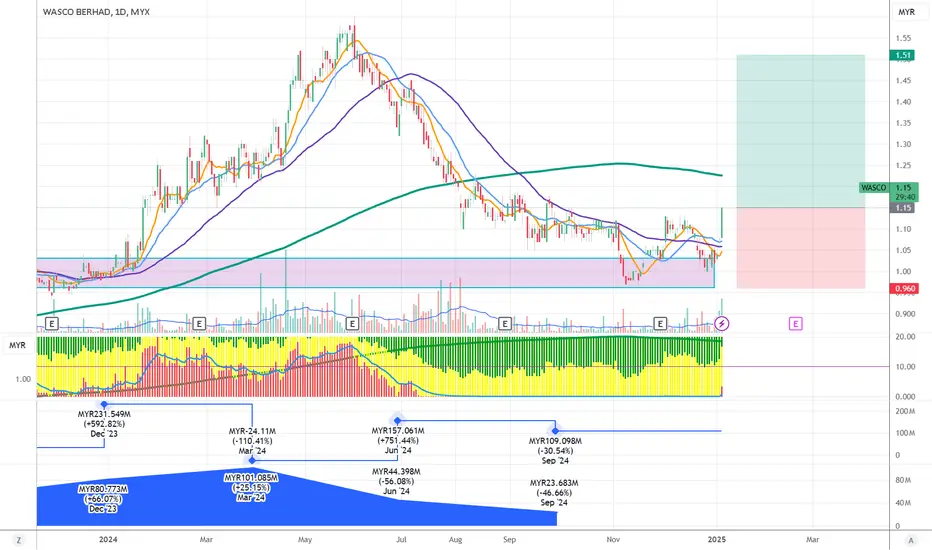
WASCO long time no seeLooking at the chart for Wasco Berhad, here's my analysis: Current Price Action: - Trading at RM1.15, up 8.49% - Breaking out from recent consolidation - Price testing key moving average resistance Key Technical Levels: 1. Support: - Major support at RM0.960 (recent low) - Stop loss level identified at RM0.190 (16.52% below) - Support zone around RM1.00-1.05 2. Resistance: - Immediate resistance at RM1.15 (current level) - Target price at RM1.51 (31.30% upside) - Risk/Reward ratio: 1.89 Volu
MYX:WASCOLong
by pengamalgelombang
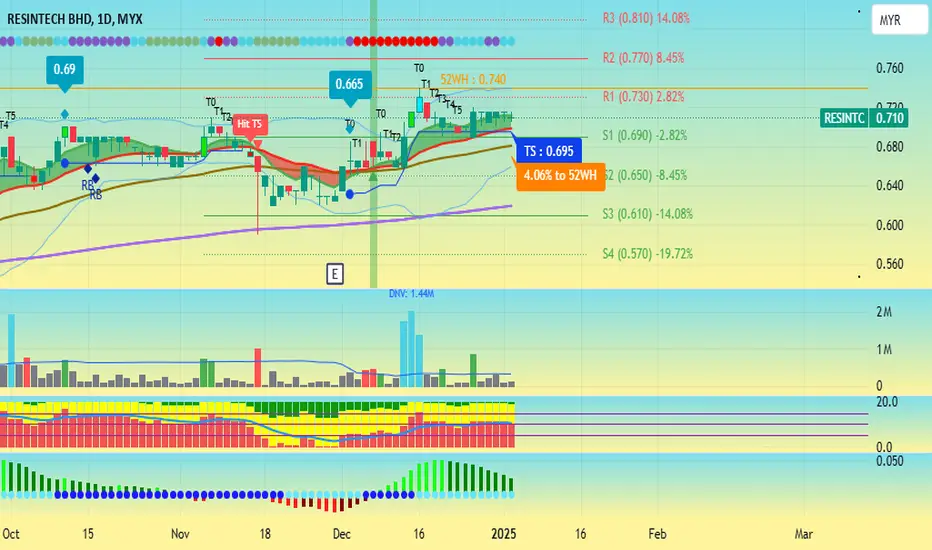
RESINTCTight price action TF1H EMA 7 & 21 TF1WEEKLY ABOVE EMA 7 52 WH 4.06% ATH
MYX:RESINTC
by automlm81
1
SimepropBullBear AlgoSystem has identified potential bullish momentum. Trading plan as below: 🛟 Support: 1.45 🛑 Stop Loss (SL): 1.38 ✅ Idea Entry: 1.73 🎯 Target Price (TP1): 2.08 🎯 Target Price (TP2): 2.43 Trading success is 80-90% about risk management. Stay disciplined, size your positions wisely, and stick to your plan. May the trend be with you! 🎉
MYX:SIMEPROPLong
by UnknownUnicorn34694209
DAYANG may signal end of Oil SlumpLooking at the chart for Dayang Enterprise Holdings, here's my analysis: Current Price Action: - Trading at RM2.21, down 1.34% - Moving averages in bearish alignment: * SMA 10: 2.30 * SMA 20: 2.22 * SMA 50: 1.95 * SMA 200: 1.67 Elliott Wave Analysis: - Currently in wave (iv) of a larger correction - Complex correction pattern with multiple abc waves - Key support level at RM1.96 needs to hold Technical Structure: 1. Support Levels: - Critical support at RM1.96 (red dashed line) - Movi
MYX:DAYANGLong
by pengamalgelombang
WCT is in wave 3Looking at the chart for WCT Holdings Berhad, here's my analysis: Current Price Action: - Trading at RM1.00, down 2.91% - Currently in consolidation after recent breakout - Price above key moving averages indicating bullish trend Elliott Wave Analysis: - Completed waves I through IV - Setting up for wave V move higher - Wave V target projected around RM1.31 Key Technical Levels: 1. Support: - Strong support at RM0.790 (wave IV low) - Secondary support at RM0.875 (previous resistance turned su
MYX:WCTLong
by pengamalgelombang
UEMS in wave 3Looking at the chart for UEM Sunrise Berhad, here's my analysis: Current Price Action: - Trading at RM1.16, up 9.43% - Strong breakout from recent consolidation - Price moving above all major moving averages Elliott Wave Analysis: - Completed waves I through IV - Currently in early stages of wave V - Wave V target projected at RM1.38 (1.618 Fibonacci level) Key Technical Levels: 1. Support: - Strong support at RM0.92 (wave IV low) - Secondary support at RM1.05 (recent consolidation base) - Mo
MYX:UEMSLong
by pengamalgelombang
CORAZA - PENDING BREAKOUT ?CORAZA - CURRENT PRICE : RM0.570 On 27 NOVEMBER 2024, an extended long white real body candlestick gapped higher on the opening and closed at near the session's high. This tall white candle confirmed an important breakout from down trendline. Then the stock continue its upside movement. On 31 DECEMBER 2024, the stock hit intraday high at RM0.575 and closed RM0.570. RM0.575 may considered as immediate resistance level as the share price touched this level three times. A breakout above RM0.575
MYX:CORAZALong
by IMRAN_96
Updated
UEMS (5148) - PropertyUEMS - Current price : RM1.08 Fundamentally broker house RHB Investment BHD give a target price of RM1.60 (19 OCT 2024 reports). The research house expect demand for property will continue to be driven by : i) Better economic growth outlook, ii) Influx of foreign and domestic direct investments iii) Return of tourist arrivals iv) Easing of the Malaysia Second Home programme v) Major instructure developments Technically there is a Falling Window (Gap Down) on 01 Aug 2024. As such, it m
MYX:UEMSLong
by IMRAN_96
Updated
MAHSING ATH RM2.25 IN 2025? Look strong to move up this year. but you have to monitor rm1.97 with volume you got price 1.70-1.80 is very nice 3/1/2025 charting - asyraf
MYX:MAHSING
by asyrafazmi13
SNS IDEASI hope people dont chase the price. i strongly will wait the retracement 560-580 but for the short term trader will play within 650-700 This counter is on my best watchlist
MYX:SNS
by asyrafazmi13
DNEX- "Last Dance Bottom"W pattern + Fibo prediction as per chart on Daily timeframe.Base on technical analysis it would become to turn Bullish Factor.
MYX:DNEXLong
by syamsulhakam89
PCHEM already factored in the NEGATIVES? window dressingLooking at the chart for Petronas Chemicals Group Berhad, here's my analysis: Current Price Action: - Trading at RM5.08, down 8.04% - Currently showing potential bottoming pattern - Below all major moving averages (SMAs 10, 20, 50, 200) Technical Analysis: 1. Moving Averages: - SMA 10: 5.47 - SMA 20: 5.56 - SMA 50: 5.61 - SMA 200: 6.32 - All MAs in bearish alignment suggesting strong downtrend 2. Volume Analysis: - Significant volume spike noted during recent selling climax - Volume: 19.15M s
MYX:PCHEMLong
by pengamalgelombang
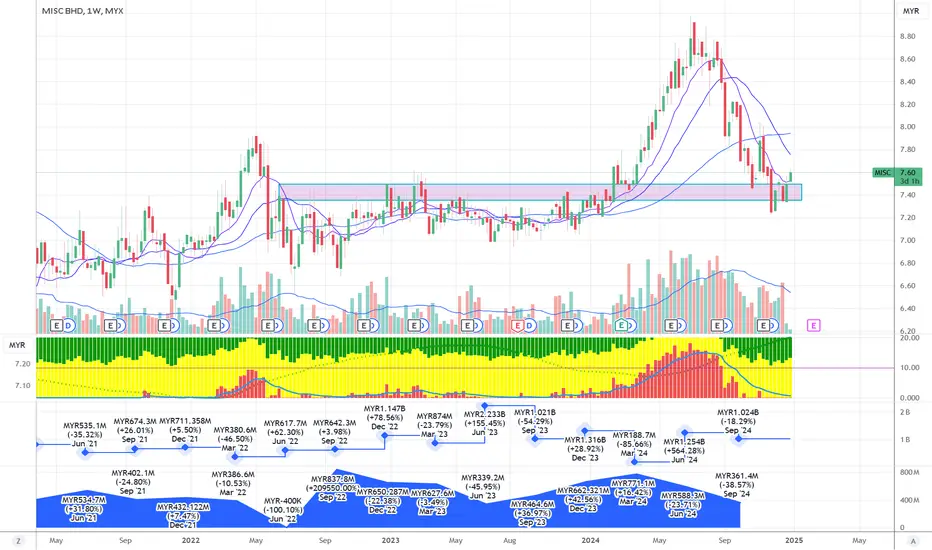
will MISC rebound after Window DressingLooking at the chart for MISC Berhad, here's my analysis: Current Price Action: - Trading at RM7.08, up 1.29% - Currently testing key support level - Price below major moving averages suggesting bearish pressure Technical Analysis: 1. Support/Resistance: - Critical support zone around RM7.40 (highlighted in pink) - Major resistance at RM8.00-8.20 (recent peak) - Previous support at RM7.60 now acting as resistance 2. Moving Averages: - All moving averages trending downward - Price trading belo
MYX:MISCLong
by pengamalgelombang
will AXIATA going forward 2025 due to Window dressingLooking at the chart for Axiata Group Berhad, here's my analysis: Current Price Action: - Trading at RM2.49, up 4.18% - Breaking out from recent resistance level - Price moving above all major moving averages Technical Analysis: 1. Support/Resistance: - Strong support zone around RM2.20-2.30 (highlighted in purple) - Previous resistance at RM2.40 now likely to act as support - Overhead resistance around RM2.60 (previous swing high) 2. Moving Averages: - All moving averages beginning to turn u
MYX:MISCLong
by pengamalgelombang
MICROLN after disposed by OMESTI - announced severe LOSSseems like a reversal to happen Looking at the chart for Microlink Solutions Berhad, here's my analysis: Current Price Action: - Trading at RM0.240, up 11.63% - Recently broken above downtrend resistance - Showing signs of trend reversal after extended decline Technical Analysis: 1. Moving Averages: - Price crossed above all major moving averages - Moving averages beginning to turn upward - Golden cross formation developing (short-term MA crossing above long-term MA) 2. Support/Resistance Le
MYX:MICROLNLong
by pengamalgelombang
SENDAI will it reach 1.05?Looking at the chart for Eversendai Corporation Berhad, here's my analysis: Current Price Action: - Trading at RM0.685, up 3.79% - Breaking out of a consolidation pattern - Price above all major moving averages Elliott Wave Analysis: - Completed waves (I) through (IV) - Currently entering wave (V) - Price target for wave (V) at RM0.925 (0.786 Fibonacci level) Key Technical Levels: 1. Support: - Major support at RM0.500 - Stop loss level identified at RM0.215 (31.39% below current price) - Mov
MYX:SENDAILong
by pengamalgelombang
HUPSENG will it create a leading Diagonal wave or ENDING?Looking at the chart for Hup Seng Industries Berhad, here's my analysis: Current Price Action: - Trading at RM0.780, up 1.96% - Currently in an uptrend channel - Price holding above key moving averages Elliott Wave Analysis: - Currently appears to be in Wave (IV) of a larger structure - Previous waves (I), (II), and (III) clearly visible - Potential for Wave (V) targeting RM1.37 (1.272 Fibonacci level) Key Technical Levels: 1. Support: - Strong support at RM0.915 (0.786 Fibonacci) - Channel s
MYX:HUPSENGShort
by pengamalgelombang
is Selling VITROX near Fibo 1.681 and after ex-date Good?Looking at the chart for Vitrox Corporation Berhad, here's my analysis: Current Price Action: - Trading at RM4.00, down 0.12% - Recently broke out from a consolidation pattern - Price moving above all major moving averages Technical Analysis: 1. Fibonacci Levels: - Key resistance at RM4.69 (2.618 Fibonacci level) - Support at RM3.68 (0.786 Fibonacci level) - Ultimate target possibility at RM5.24 (3.618 Fibonacci level) 2. Price Structure: - Formed a cup and handle pattern recently - Successfu
MYX:VITROXShort
by pengamalgelombang
SENDAI - BUY ON DIP ?SENDAI - CURRENT PRICE : RM0.570 SENDAI is uptrend for long term view as the share price is trading above 200-day EMA. In short and medium term the trend is sideways. However, I expect the stock may trend higher in the upcoming sessions as there are several bullish scenario appears on the chart. i) The share price manage to breakout 50-day EMA ii) Price bounce from support level of ICHIMOKU CLOUD indicates that buying interest is sufficiently strong to overcome selling pressure iii) CHIKOU S
MYX:SENDAILong
by IMRAN_96
Updated
PEKAT STOCK ROAR 2025?DEMAND WILL PLAY AROUND BOX RANGE 855-935 SUPPORT can wait 920 and will close monitor when break 1.06 it should be clearly make it higher high and stage 2 will confirm with high volume.
MYX:PEKAT
by asyrafazmi13
123456789101112131415161718192021222324252627282930313233343536373839404142
…999

Made by humans

Select market data provided by ICE Data Services. Select reference data provided by FactSet. Copyright © 2026 FactSet Research Systems Inc.Copyright © 2026, American Bankers Association. CUSIP Database provided by FactSet Research Systems Inc. All rights reserved. SEC filings and other documents provided by Quartr.© 2026 TradingView, Inc.

SOC 2 CompliantGDPR Compliant
More than a product
  • Supercharts
Screeners
  • Stocks
  • ETFs
  • Bonds
  • Crypto coins
  • CEX pairs
  • DEX pairs
  • Pine
Heatmaps
  • Stocks
  • ETFs
  • Crypto coins
Calendars
  • Economic
  • Earnings
  • Dividends
  • IPOs
More products
  • News Flow
  • Portfolios
  • Fundamental Graphs
  • Yield Curves
  • Options
  • Macro Maps
  • Pine Script®
  • MCP Server
Apps
  • Mobile
  • Desktop
Community
  • Social network
  • Wall of Love
  • Refer a friend
  • Creator program
  • House Rules
  • Moderators
Ideas
  • Trading
  • Education
  • Editors' picks
Pine Script
  • Indicators & strategies
  • Wizards
  • Freelancers
  • Marketplace
Tools & subscriptions
  • Features
  • Pricing
  • Market data
  • Gift plans
Trading
  • Overview
  • Brokers
  • Brokers comparison
  • The Leap
Special offers
  • CME Group futures
  • Eurex futures
  • US stocks bundle
About company
  • Who we are
  • Space mission
  • Blog
  • Help Center
  • Careers
  • Media kit
Merch
  • Tarot cards for traders
  • The C63 TradeTime
Policies & security
  • Terms of Use
  • Disclaimer
  • Privacy Policy
  • Cookies Policy
  • Accessibility Statement
  • Trust Center
  • Security tips
  • Bug Bounty program
  • Status page
Business solutions
  • Widgets
  • Charting libraries
  • Lightweight Charts™
  • Advanced Charts
  • Trading Platform
Growth opportunities
  • Advertising
  • Brokerage integration
  • Partner program
  • Education program
Community
  • Social network
  • Wall of Love
  • Refer a friend
  • Creator program
  • House Rules
  • Moderators
Ideas
  • Trading
  • Education
  • Editors' picks
Pine Script
  • Indicators & strategies
  • Wizards
  • Freelancers
  • Marketplace
Business solutions
  • Widgets
  • Charting libraries
  • Lightweight Charts™
  • Advanced Charts
  • Trading Platform
Growth opportunities
  • Advertising
  • Brokerage integration
  • Partner program
  • Education program
Look FirstLook First