• Products
  • Community
  • Markets
  • Brokers
  • More
Get started
  • Markets
  • /India
  • /Stocks
  • /Ideas
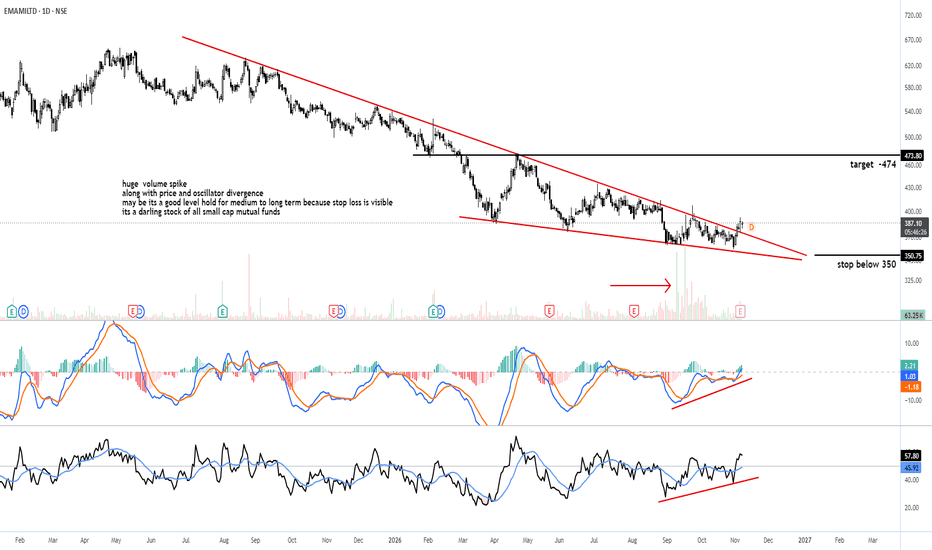
EMAMILTD – A Potential Trend Reversal in the Making?Timeframe: 1D (Daily) CMP: ₹387.30 Upside Target: ₹474 Risk Level: Stop-loss below ₹350 🔍 Technical Analysis EMAMILTD appears to be approaching an important inflection point after an extended corrective phase. The stock has been trading inside a broad descending structure, characterized by lower highs and lower lows. However, recent price action suggests that selling pressure may be gradually weakening, with multiple technical developments pointing towards a potential trend reversal. 1. Desc
NSE:EMAMILTDLong
by sk_4587
1
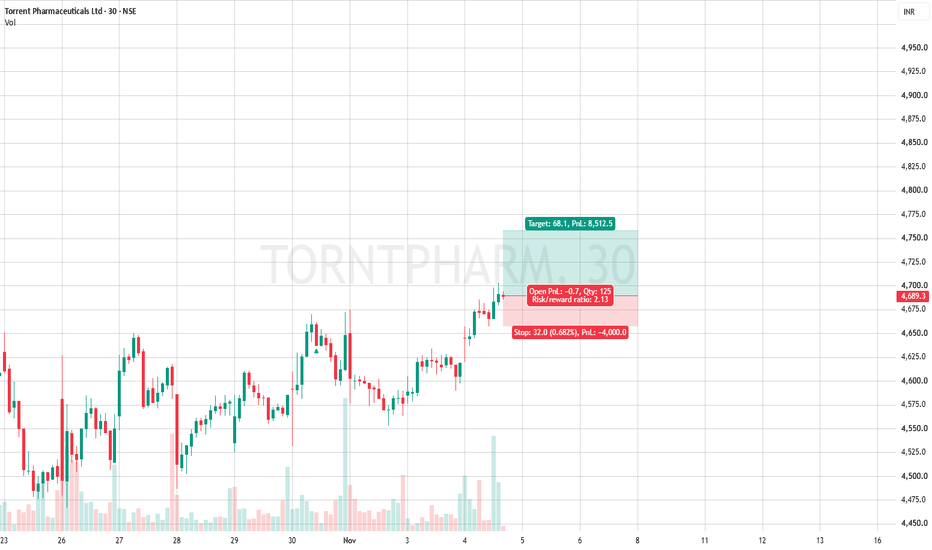
SL 4000 TP 8512Strategy Execution : Trade calls are provided based on trendline setups. Quantity : Determined by F&O lot sizes. Stop-Loss : Strictly follow the specified stop-loss levels. A stop-loss is considered triggered only after a 15-minute candle closes beyond the level. Position Sizing : Limit exposure to a maximum of two open positions at a time. Important Note : Do not risk more than 2% of your capital per trade.
NSE:TORNTPHARMLong
by jayendrawamaj
Updated
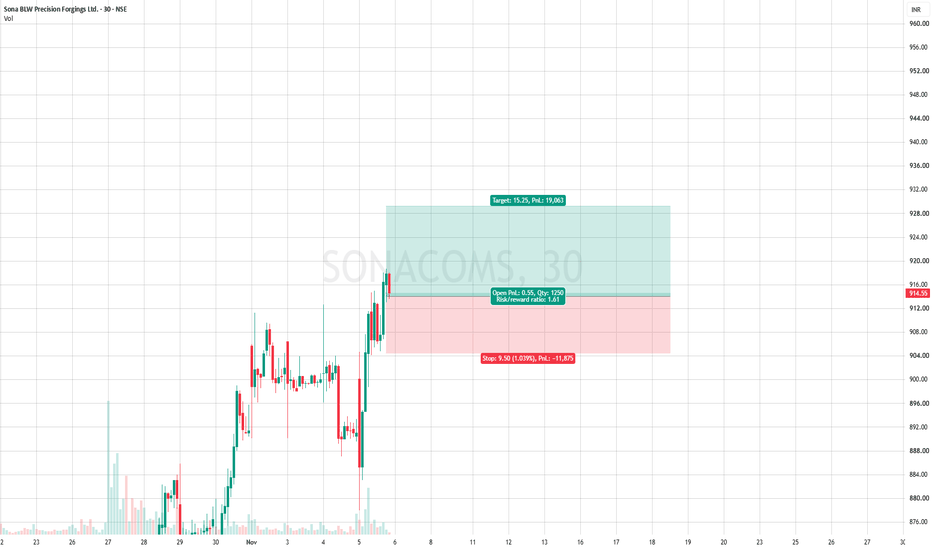
SL @ 11875 TP @ 19063Strategy Execution : Trade calls are provided based on trendline setups. Quantity : Determined by F&O lot sizes. Stop-Loss : Strictly follow the specified stop-loss levels. A stop-loss is considered triggered only after a 15-minute candle closes beyond the level. Position Sizing : Limit exposure to a maximum of two open positions at a time. Important Note : Do not risk more than 2% of your capital per trade.
NSE:SONACOMSLong
by jayendrawamaj
Updated
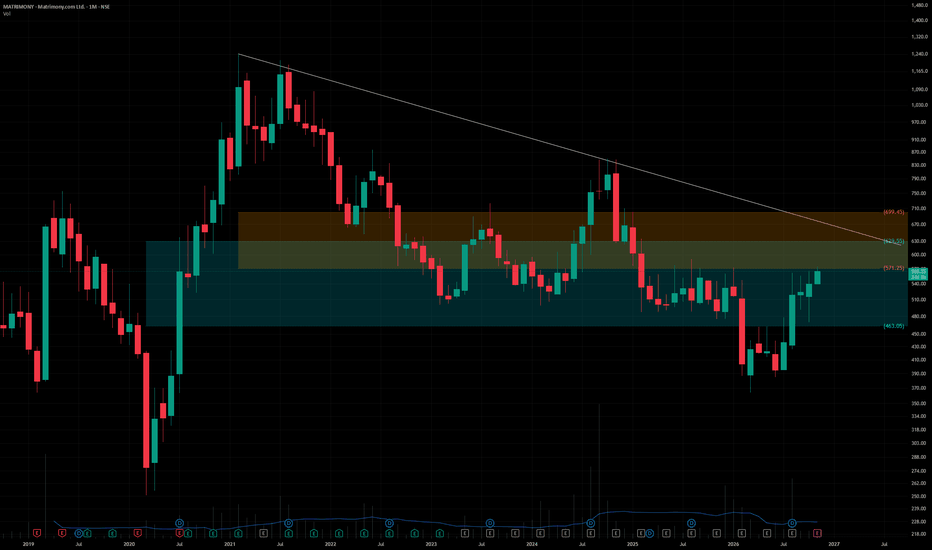
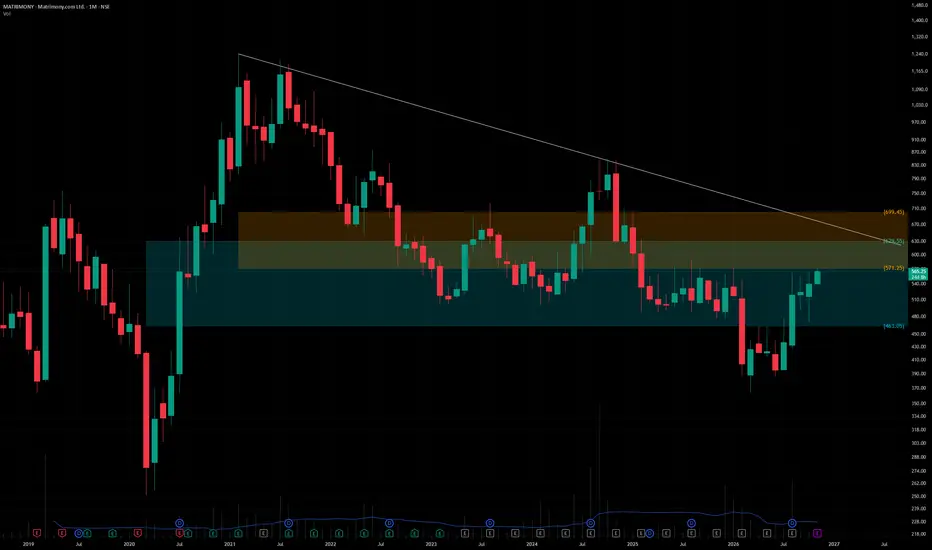
MATRIMONYMatrimony.com Ltd. (CMP ₹566.00, NSE: MATRIMONY) The SmartWay Research Desk | 6 November 2026 A Chennai‑based consumer internet company, incorporated in 2001. Matrimony.com Ltd. is India's leading online matchmaking platform, operating well‑known brands including BharatMatrimony, CommunityMatrimony, EliteMatrimony, and Jodii. The company also has interests in wedding-related services and relationship platforms, serving millions of users across India and overseas markets. Promoter Holding
NSE:MATRIMONYLong
by TechnicalAnalystSucrit
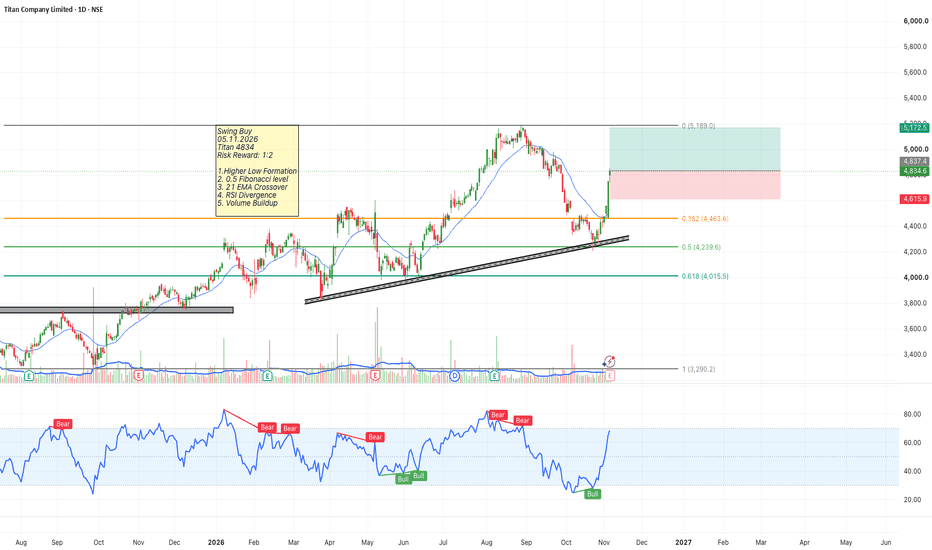
Swing Buy-Titan @4834Swing Buy 05.11.2026 Titan 4834 Risk Reward: 1:2 1.Higher Low Formation 2. 0.5 Fibonacci level 3. 21 EMA Crossover 4. RSI Divergence 5. Volume Buildup NSE:TITAN
NSE:TITANLong
by Swinging_Inside_the_BAR
KEI 1D: Major Weekly Support Zone, Turned Price 11 TimesKEI on the daily chart, at a major weekly support zone: the band where weekly candles turned price 11 times over the last four years. Found by an automated scan of weekly turns; nothing has measured how often such zones hold. Reading the chart The weekly candles turned price at this zone 11 times: wk 6 May 24, wk 22 Jul 24, wk 28 Oct 24, wk 18 Nov 24, wk 23 Jun 25, wk 11 Aug 25, wk 29 Sep 25, wk 3 Nov 25, wk 8 Dec 25, wk 19 Jan 26, wk 23 Mar 26. It changed roles: it was support first, the
NSE:KEI
by dgupta88
LTM (1D) – Symmetrical triangle (up side): broke outLTM on the daily chart, found on the line through the closes by a chart patterns finder. Drawn from closes alone; how often this shape works has not been measured. What the chart shows The shape: Falling highs and rising lows that meet ahead, with no pole before them. The close leaves on either side. Drawn from 30 Jun 2026 to 27 Oct 2026, and known from 5 Nov 2026. A daily close above the breakout line on 5 Nov 2026. The newest closed candle (5 Nov 2026) is above the breakout line.
NSE:LTM
by dgupta88
INDIGO | THE BTF DAILY BLOCK IS STILL DEVELOPING 🧭 #Crude #oil has suffered a sharp selloff, and airline stocks are attracting renewed attention as the market reassesses the outlook for fuel costs. But the more interesting story may be unfolding on the chart. **IndiGo's BTF Daily Trend has transitioned from bearish to bullish**, with successive green daily blocks illustrating the recovery. Despite the recent sharp advance, price remains within the developing bullish Daily BTF block, while the 18-day SMA near ₹4,790 provides a broader dire
NSE:INDIGO
by BallaJi
COFORGE: Why ₹2,000 Is Supply Absorption, Not a Structural TopRetail investors often panic when a stock retests a major round-number resistance like ₹2,000 multiple times, calling it a dangerous "Triple Top" or "Quadruple Top." But institutional money knows the reality: the more times a level is tested without a major breakdown, the weaker that ceiling becomes! Coforge isn't suffering from distribution—big smart money is systematically absorbing every single share being dumped under ₹2,020 to build massive long positions before the next explosive trend.
NSE:COFORGELong
by BallaJi
Updated
4
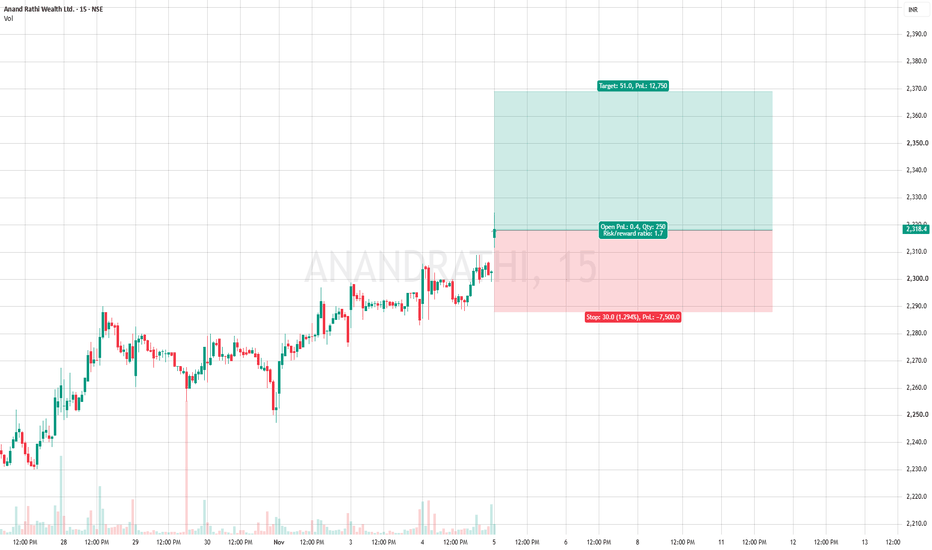
Stoploss @ 7500 Target @ 12750Strategy Execution : Trade calls are provided based on trendline setups. Quantity : Determined by F&O lot sizes. Stop-Loss : Strictly follow the specified stop-loss levels. A stop-loss is considered triggered only after a 15-minute candle closes beyond the level. Position Sizing : Limit exposure to a maximum of two open positions at a time. Important Note : Do not risk more than 2% of your capital per trade.
NSE:ANANDRATHILong
by jayendrawamaj
Updated
GPT Healthcare - Bullish reversalCMP: ₹166.21. The latest available NSE close is ₹166.21, with a recent high of ₹170.40 and 52-week high of ₹175 📈 Setup: Bullish reversal + long-term trendline breakout attempt Long-term trendline: Price is now testing/pressing above the descending trendline you have drawn. Momentum: RSI 62.84 — healthy bullish zone, but not yet overbought. Structure: Strong recovery from ₹115 → ₹166, with higher lows developing. Immediate resistance: ₹170–175 Major breakout: Sustained weekly close above ₹175
NSE:GPTHEALTHLong
by vinaygupta478
Updated
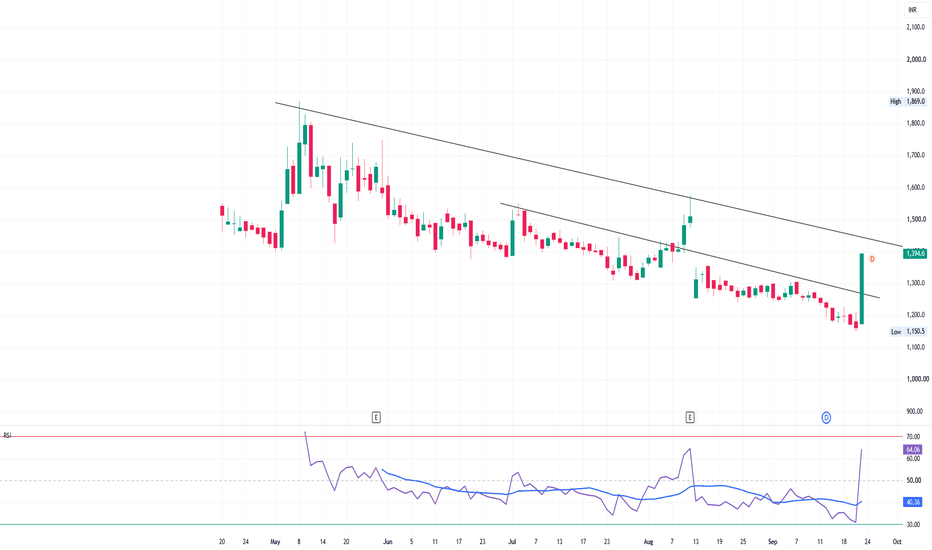
FRONTSP — Major breakout attemptCMP: ₹1,395 📈 Trend: Strong reversal from ₹1,150–1,200. 📐 Trendline: Price has broken the nearer falling trendline around ₹1,250–1,300. The major long-term trendline is still overhead near ₹1,450–1,500. RSI: 64 → strong momentum, not yet overbought. 🔑 Breakout zone: ₹1,450–1,500 🟢 Support: ₹1,300–1,325 🛡️ Stop-loss: ₹1,280 🎯 Targets after ₹1,500: ₹1,600 → ₹1,700 → ₹1,850 Technical rating: 8.8/10 Bottom line: Very interesting breakout candidate. The first trendline breakout is done; ₹1,450–1,5
NSE:FRONTSPLong
by vinaygupta478
Updated
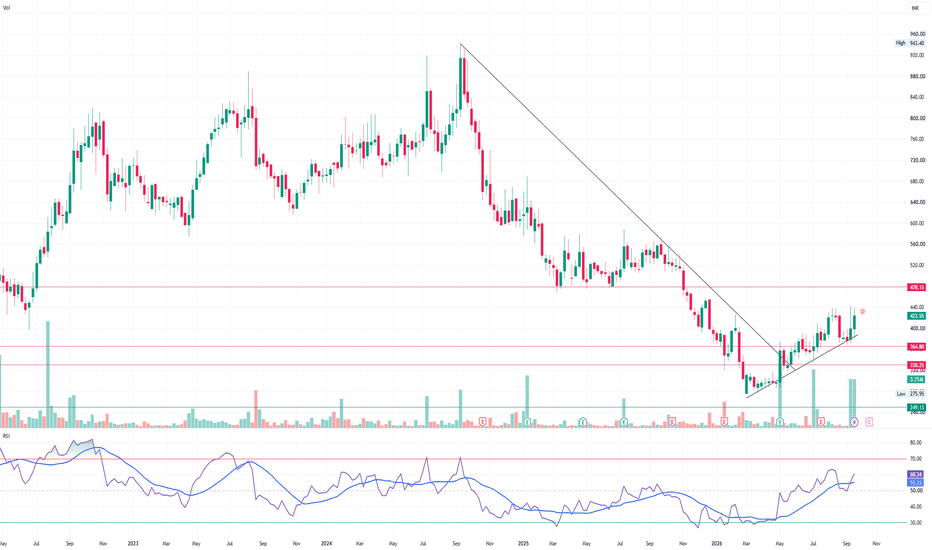
SHOPPERS STOP — Trendline breakout + strong momentumCMP: ₹423.55 | Setup: Bullish reversal 📐 Trendline: Long-term falling trendline has been broken; price is now above the rising support line as well. 📈 Structure: Higher lows from ₹276 → ₹365 → ₹400+. RSI: ~60 — bullish, with room to move. 🔑 Immediate resistance: ₹440–445 Major resistance: ₹478 🟢 Support: ₹400–405 Strong support: ₹365 🛡️ Positional SL: ₹385 🔴 Swing trade — short Not attractive at current price. Only consider a short if: ₹440–445 gets rejected strongly, or ₹400 breaks decisive
NSE:SHOPERSTOPLong
by vinaygupta478
Updated
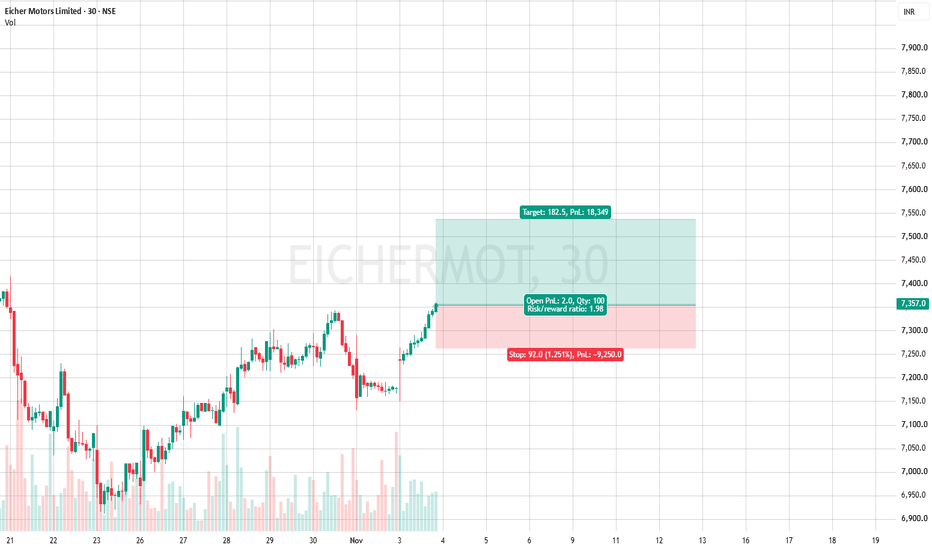
STOPLOSS @ 9250 TARGET @ 18349Strategy Execution : Trade calls are provided based on trendline setups. Quantity : F&O lot sizes. Stop-Loss : Strictly follow the specified stop-loss levels. A stop-loss is considered triggered only after a 15-minute candle closes beyond the level. Position Sizing : Limit exposure to a maximum of two open positions at a time. Important Note : Do not risk more than 2% of your capital per trade.
NSE:EICHERMOTLong
by jayendrawamaj
Updated
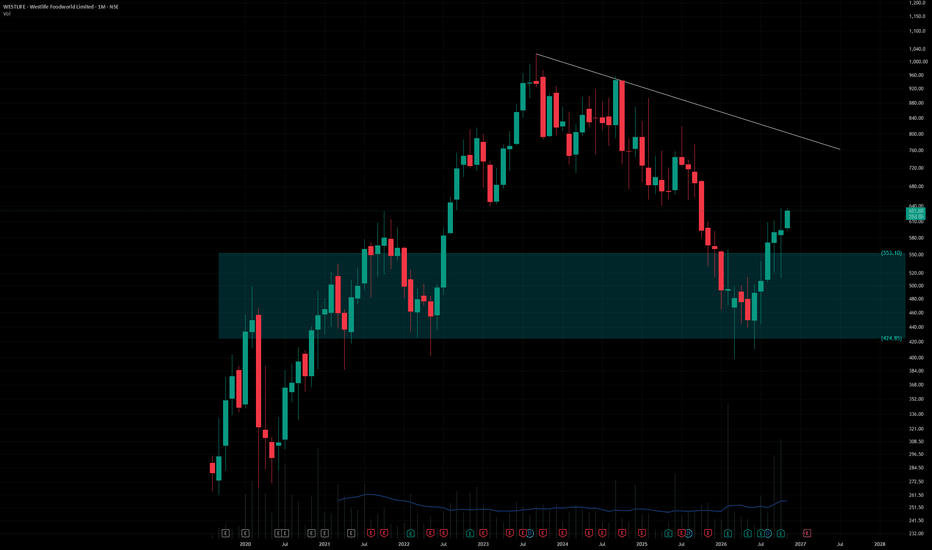
WESTLIFE FOODWORLDWestlife Foodworld Ltd. (CMP ₹632.00, NSE: WESTLIFE) The SmartWay Research Desk | 5 November 2026 A Mumbai‑based quick service restaurant (QSR) company, incorporated in 1982. Westlife Foodworld Ltd. is the master franchisee for McDonald's restaurants in West and South India, operating hundreds of outlets across major cities. The company focuses on quick service dining, digital ordering, delivery platforms, drive‑through formats, and menu innovation, making it one of India's leading organize
NSE:WESTLIFELong
by TechnicalAnalystSucrit
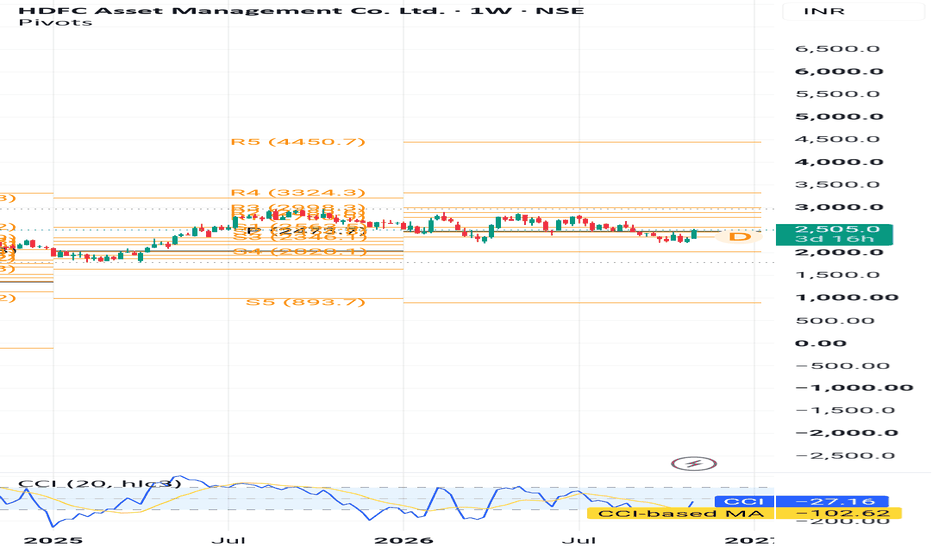
Hdfc Amc📈 STOCK TO WATCH | HDFC AMC A strong momentum setup in India's asset management sector. 🔹 Buy Zone: ₹2,505 🔹 Yearly Pivot: ₹2,473 🔹 Stop Loss: ₹2,216 🎯 Target: ₹3,324 Risk–Reward Analysis • Risk: ₹289/share (11.54%) • Reward: ₹819/share (32.69%) • Risk–Reward: 1:2.83 Technical Snapshot | 4 Nov 2026 • RSI: 82 – exceptionally strong momentum • MACD: Bullish • ADX: 36.6 – strong trend • Price above 20/50/100/200-DMA • Momentum breakout with strong moving-average alignment Research. Plan. Manag
NSE:HDFCAMCLong
by Microcap_Investor
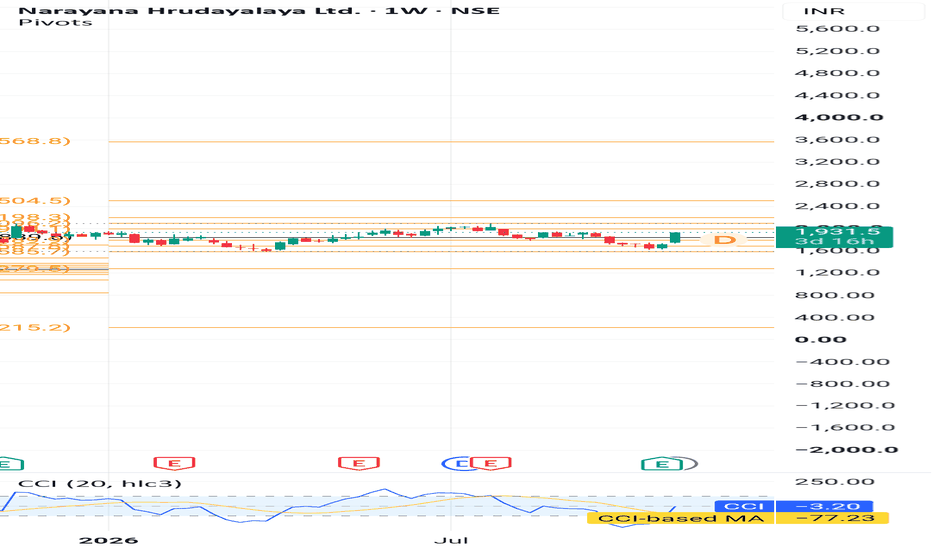
Narayan Hrudalaya 🏥 STOCK TO WATCH | NARAYANA HRUDAYALAYA (NH) Healthcare momentum with a structured swing-trading setup. 🔹 Buy Zone: ₹1,931 🔹 Yearly Pivot: ₹1,839 🔹 Stop Loss: ₹1,628 🎯 Target: ₹2,504 Risk–Reward Analysis • Risk: ₹303/share (15.69%) • Reward: ₹573/share (29.67%) • Risk–Reward: 1:1.89 Technical Snapshot | 4 Nov 2026 • RSI: 64.8 – positive momentum • MACD: Improving • ADX: 30.2 – strong trend intensity • Price above 20/50/200-DMA Research. Plan. Manage Risk. #NarayanaHrudayalaya #NH #StockToW
NSE:NHLong
by Microcap_Investor
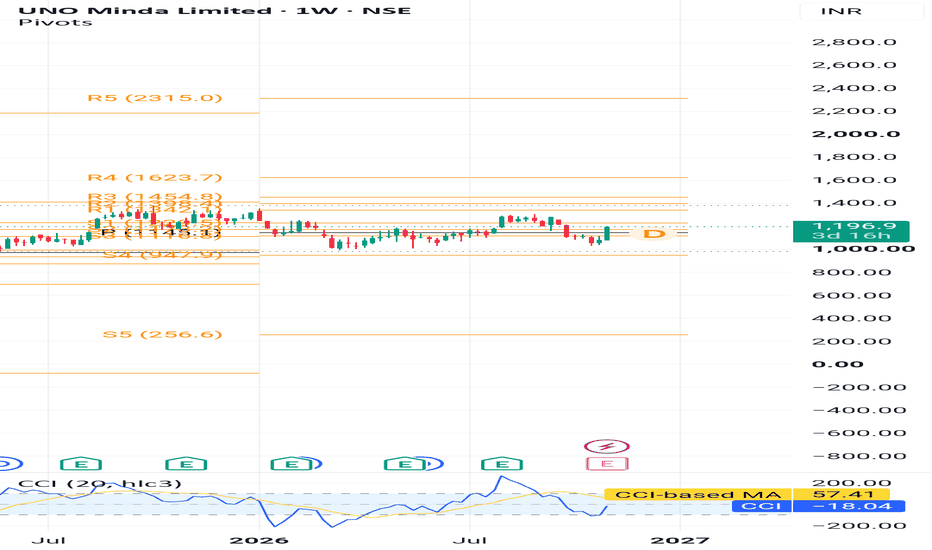
Uno Minda🚀 UNO MINDA: 35.7% UPSIDE POTENTIAL — MOMENTUM BREAKOUT Uno Minda Ltd. (NSE: UNOMINDA) 🟢 Buy Zone: ₹1,196 📍 Pivot: ₹1,145 🛑 Stop Loss: ₹1,037 🎯 Target: ₹1,623 🔍 WHY IT CAUGHT MY ATTENTION - RSI: 80.6 — exceptionally strong momentum, but significantly overbought. - MACD: +25.31 — bullish momentum. - ADX: 37.5 — strong trend intensity. - Moving Averages: Price above 20/50/100/200-day SMAs — bullish alignment. 📊 TRADE MATH - Risk: ₹159/share - Potential Reward: ₹427/share - Risk:Reward: 1:2.6
NSE:UNOMINDALong
by Microcap_Investor
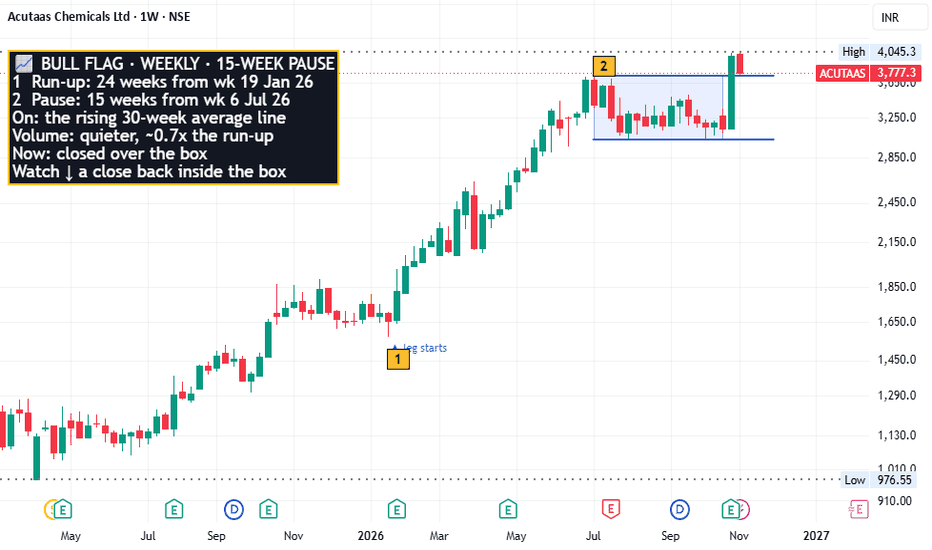
ACUTAAS (1W) – Bull flag: 15-week pause on 30-week averageACUTAAS on the weekly chart has left its flag: after a run-up and 15 weeks of rest on a rising average, a close went over the box. The picture so far Run-up: 24 weeks from 19 Jan 26, in 2 steps. Pause: 15 weeks, 6 Jul 26 to 19 Oct 26 - the shaded box, highest high to lowest low. Under the pause runs the rising 30-week average line - the newest close is well above it. Volume in the pause is quieter than in the run-up: about 0.7x of it. The newest close finished over the box high. A tre
NSE:ACUTAASLong
by dgupta88
NATIONALUM (4H) – Channel breakout (up side): broke outNATIONALUM on the 4 hour chart, found on the line through the closes by a chart patterns finder. Drawn from closes alone; how often this shape works has not been measured. Reading the chart The shape: Two parallel sloping lines. The close breaks out against the slope: a falling channel breaks up, a rising one breaks down. Drawn from 12 Aug 2026 13:15 to 23 Oct 2026 09:15, and known from 27 Oct 2026 13:15. A 4 hour close above the breakout line on 2 Nov 2026 09:15. The newest closed cand
NSE:NATIONALUM
by dgupta88
CAMS (2H) – Channel breakout (up side): broke outCAMS on the 2 hour chart, found on the line through the closes by a chart patterns finder. Drawn from closes alone; how often this shape works has not been measured. What the chart shows The shape: Two parallel sloping lines. The close breaks out against the slope: a falling channel breaks up, a rising one breaks down. Drawn from 8 Oct 2026 13:15 to 29 Oct 2026 13:15, and known from 30 Oct 2026 09:15. A 2 hour close above the breakout line on 3 Nov 2026 09:15. The newest closed candle (
NSE:CAMS
by dgupta88
BAJFINANCE (2H) – Horizontal breakout (up side): broke outBAJFINANCE on the 2 hour chart, found on the line through the closes by a chart patterns finder. Drawn from closes alone; how often this shape works has not been measured. What the chart shows The shape: A flat ceiling the line has turned down from at least twice. The close goes above it, comes back to it, and may clear the high it made after the break. The down side is the same rule under a floor. Drawn from 5 Oct 2026 09:15 to 19 Oct 2026 09:15, and known from 19 Oct 2026 13:15. A 2 ho
NSE:BAJFINANCE
by dgupta88
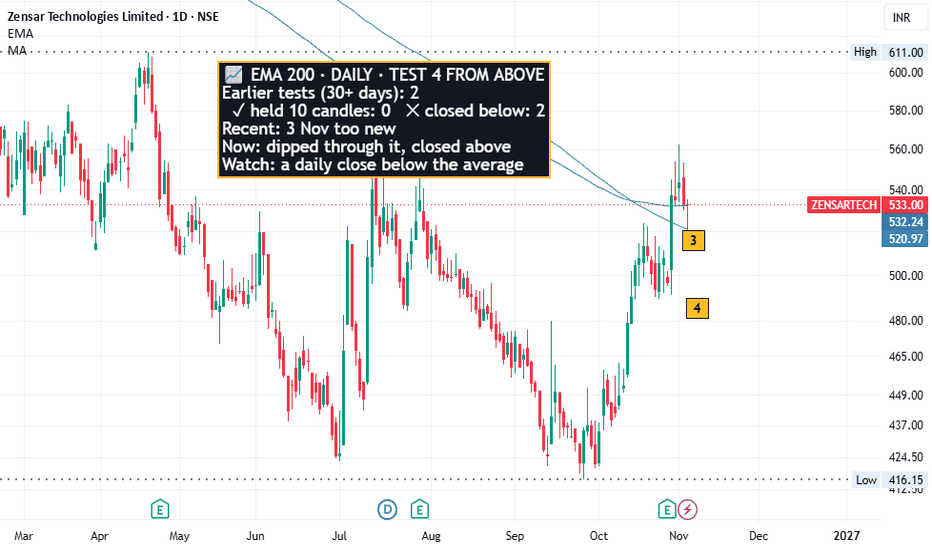
ZENSARTECH 1D: Long Lower Wick at the EMA 200ZENSARTECH on the daily chart pulled back to its EMA 200 and closed above it. The average is drawn as TradingView's own study; the marks are the chart's earlier tests of it. On the chart The low of 4 Nov 26 went through the EMA 200 and the candle closed above it - a red candle with a long lower wick. The three daily candles before it all closed above the average. Honest record on this chart: of 2 earlier tests from above old enough to count, 0 held for ten daily candles and 2 closed belo
NSE:ZENSARTECHLong
by dgupta88
DIXON (1D) – EMA 20, SMA 200, SMA 20DIXON on the daily chart, against its moving averages. What the chart shows EMA 20 (candle on it) close 0.39 ATR above; SMA 200 (candle on it) close 0.42 ATR above; SMA 20 (candle on it) close 0.45 ATR above. The lines drawn: EMA 20, SMA 200, SMA 20 - each worked out on every closed daily candle. What to keep track of Where the next closes finish against these averages. Whether the averages keep their slope. Volume on the candle that moves away from them. For study only. Not
NSE:DIXON
by dgupta88
123456789101112131415161718192021222324252627282930313233343536373839404142
…999

Made by humans

Select market data provided by ICE Data Services. Select reference data provided by FactSet. Copyright © 2026 FactSet Research Systems Inc.Copyright © 2026, American Bankers Association. CUSIP Database provided by FactSet Research Systems Inc. All rights reserved. SEC filings and other documents provided by Quartr.© 2026 TradingView, Inc.

SOC 2 CompliantGDPR Compliant
More than a product
  • Supercharts
Screeners
  • Stocks
  • ETFs
  • Bonds
  • Crypto coins
  • CEX pairs
  • DEX pairs
  • Pine
Heatmaps
  • Stocks
  • ETFs
  • Crypto coins
Calendars
  • Economic
  • Earnings
  • Dividends
  • IPOs
More products
  • News Flow
  • Portfolios
  • Fundamental Graphs
  • Yield Curves
  • Options
  • Macro Maps
  • Pine Script®
  • MCP Server
Apps
  • Mobile
  • Desktop
Community
  • Social network
  • Wall of Love
  • Refer a friend
  • Creator program
  • House Rules
  • Moderators
Ideas
  • Trading
  • Education
  • Editors' picks
Pine Script
  • Indicators & strategies
  • Wizards
  • Freelancers
  • Marketplace
Tools & subscriptions
  • Features
  • Pricing
  • Market data
  • Gift plans
Trading
  • Overview
  • Brokers
  • Brokers comparison
  • The Leap
Special offers
  • CME Group futures
  • Eurex futures
  • US stocks bundle
About company
  • Who we are
  • Space mission
  • Blog
  • Help Center
  • Careers
  • Media kit
Merch
  • Tarot cards for traders
  • The C63 TradeTime
Policies & security
  • Terms of Use
  • Disclaimer
  • Privacy Policy
  • Cookies Policy
  • Accessibility Statement
  • Trust Center
  • Security tips
  • Bug Bounty program
  • Status page
Business solutions
  • Widgets
  • Charting libraries
  • Lightweight Charts™
  • Advanced Charts
  • Trading Platform
Growth opportunities
  • Advertising
  • Brokerage integration
  • Partner program
  • Education program
Community
  • Social network
  • Wall of Love
  • Refer a friend
  • Creator program
  • House Rules
  • Moderators
Ideas
  • Trading
  • Education
  • Editors' picks
Pine Script
  • Indicators & strategies
  • Wizards
  • Freelancers
  • Marketplace
Business solutions
  • Widgets
  • Charting libraries
  • Lightweight Charts™
  • Advanced Charts
  • Trading Platform
Growth opportunities
  • Advertising
  • Brokerage integration
  • Partner program
  • Education program
Look FirstLook First