Bliss GVS Pharma LtdBliss GVS Pharma — Consolidated Trade Quality
Trend Alignment: HTF, MTF and ITF are all UP, confirming broad bullish alignment.
Demand Confluence: Weekly, Daily and ITF demand converge strongly around ₹501–₹553, creating a clear demand cluster.
ITF Confirmation: 240M/180M average ₹516 and 60M average ₹510 reinforce the ₹501–₹553 zone.
Entry Quality: ₹531–₹553 is the preferred entry range, with ₹542 average entry positioned well within the demand structure.
Risk Control: SL ₹501 sits at the common ITF/Weekly/Daily distal level. Risk is ₹41/share (~7.6%).
Reward: Target ₹652 offers ₹110/share, giving approximately 2.7:1 price RR.
Immediate Hurdle: ₹553 is the key breakout/confirmation level. Sustained acceptance above ₹553 strengthens the move toward ₹652.
Positional Target: ₹740 provides additional upside beyond the primary target.
MTF Structure: 50% funding requirement means ₹677.5K capital against ₹1.355M position value.
Profit Potential: At ₹652, gross profit is ₹275K. The revised sheet's ₹495K profit basis corresponds to the ₹740 positional target, not ₹652.
Net Profit: After stated brokerage and 6-month MTF interest, the sheet estimates ~₹456K net profit at the ₹740 positional target.
Execution: Prefer accumulation around ₹531–₹542; avoid aggressive chasing above ₹553.
Invalidation: A decisive break below ₹501 weakens the current Weekly/Daily/ITF demand structure.
Trade Character: Bullish multi-timeframe setup with strong demand confluence, defined risk and a clear path from ₹553 → ₹652 → ₹740.
Trade Plan
BUY: ₹531–₹553
IDEAL ENTRY: ~₹542
SL: ₹501
T1: ₹553 — breakout/confirmation
T2: ₹652 — primary target
POSITION TARGET: ₹740
Key Quality Points:
Trend Alignment → Strong Demand Confluence → ITF Confirmation → Defined SL → 2.7R Primary RR → Positional Upside
Main Concern: Risk is ~7.6%, so entry discipline is important. ₹501 should remain the key structural invalidation level.  Long
Long
Lumax Auto TechnologiesLumax Auto Technologies — Consolidated Trade Quality
Trend Alignment: HTF, MTF and ITF are all UP, giving strong bullish alignment across all timeframes.
Demand Confluence: Weekly, Daily and ITF zones overlap strongly at ₹1,711–₹1,793, creating a high-quality demand cluster.
Entry Quality: ₹1,759–₹1,793 is well positioned within the demand structure; ₹1,776 average entry is appropriate.
ITF Confirmation: 240M and 180M average ₹1,752, while 60M average is ₹1,722, supporting the entry zone.
MTF Support: MTF average ₹1,660 provides a deeper structural support reference.
Risk Control: SL ₹1,711 is aligned with the common Weekly/Daily/ITF distal level. Risk is ₹65/share (~3.7%), giving relatively tight downside control.
Reward Potential: Target ₹2,291 provides ₹515/share potential reward and approximately 7.9:1 price RR.
Resistance Path: ₹1,900 is the first key hurdle, followed by ₹2,100 Trend High, before the ₹2,291 target.
Positional Upside: ₹3,747 Position Target offers significant longer-term upside if the bullish trend remains intact.
MTF Structure: 50% capital requirement means ₹444K own capital against ₹888K position value, keeping leverage moderate.
Profit Potential: Position-target gross profit of ₹985.5K is mathematically consistent with ₹3,747. After stated charges and 6-month interest, the sheet estimates ~₹959.9K net.
Primary Target Profit: At ₹2,291, gross profit is ₹257.5K; therefore the ₹959.9K profit should be clearly labelled as Position Target Profit, not primary-target profit.
Execution: Prefer accumulation around ₹1,759–₹1,776; avoid chasing significantly above ₹1,793.
Invalidation: A decisive break below ₹1,711 weakens the current Weekly/Daily/ITF demand structure.
Trade Character: Strong bullish MTF setup with excellent demand confluence, tight technical risk and substantial upside potential.
Trade Plan
BUY: ₹1,759–₹1,793
IDEAL ENTRY: ~₹1,776
SL: ₹1,711
T1: ₹1,900
T2: ₹2,100
T3: ₹2,291
POSITION TARGET: ₹3,747
Key Quality Points:
Trend Alignment → Multi-Timeframe Demand Confluence → Tight SL → Excellent RR → Strong Positional Upside → Moderate MTF Leverage  Long
Long
Thangamayil Jewellery LtdThangamayil Jewellery — Consolidated Trade Quality
Overall Quality: 🟢 8.5/10 | MTF LONG
Trend Alignment — 10/10: HTF, MTF and ITF are all UP, giving strong directional confirmation.
Demand Confluence — 9.5/10: Weekly, Daily and ITF demand converge around ₹3,433–₹3,875, creating a strong support structure.
Entry Quality — 9/10: ₹3,875–₹3,919 is close to the ITF demand zone; ₹3,875 or below is the preferred accumulation area.
Structure Quality — 9/10: MTF average ₹3,682 and ITF average ₹3,654 support the broader bullish structure.
Risk Control — 6/10: SL ₹3,433 is technically valid but represents ~12% price risk, making the position aggressive under MTF.
Primary Reward — 7.5/10: Target ₹4,964 offers approximately 2.3:1 price RR, acceptable but not exceptional.
Positional Upside — 9/10: Trend High ₹7,441 and Position Target ₹11,449 provide substantial longer-term upside if the bullish structure sustains.
MTF Capital Efficiency — 8/10: ₹779K own capital controls ~₹1.95M position value, creating attractive leverage but requiring strict SL discipline.
Profit Potential — 9/10: At ₹4,964, estimated net profit is ~₹468K; at ₹7,441, ~₹1.71M; at ₹11,449, ~₹3.71M.
Execution Quality — 8/10: Better to accumulate near ₹3,875 rather than chase above ₹3,919.
Key Risk — 🟠: A decisive break below ₹3,433 invalidates the current MTF demand thesis.
Trade Character —: High-quality bullish structure, but high-risk MTF position due to the wide SL.
🎯 Consolidated Trade Plan
BUY: ₹3,875–₹3,919
IDEAL ENTRY: ~₹3,875
SL: ₹3,433
T1: ₹4,149
T2: ₹4,964
T3: ₹7,441
POSITION TARGET: ₹11,449
Final View: 🟢 GOOD MTF LONG
Best quality points:
Trend Alignment + Demand Confluence + ITF Entry + Strong Positional Upside
Main weakness:
Wide SL + leverage risk
Decision: ACCUMULATE ON DEMAND, DON'T CHASE.  Long
Long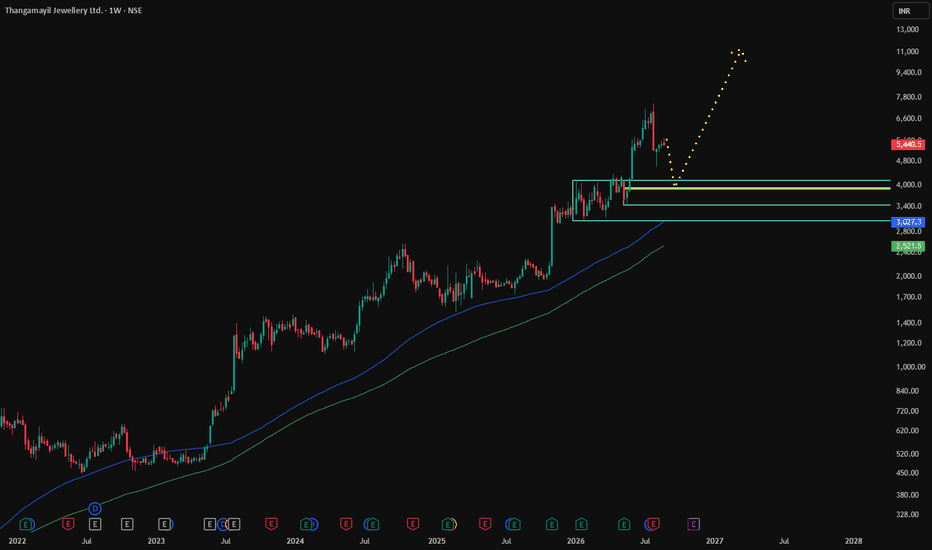
$BOSCHLTD: Inverse H&S Breakout🏎️ 📈 🚘 💎 🚀
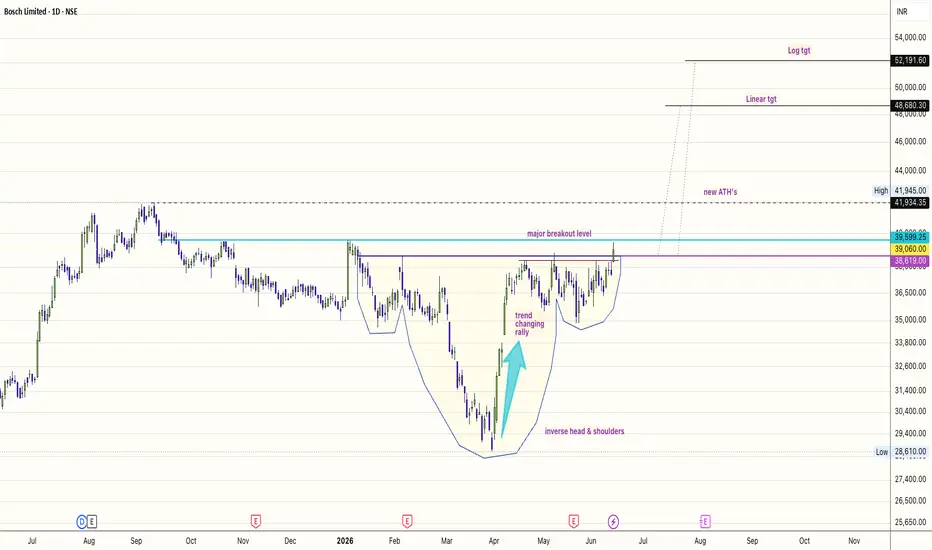
The Macro Setup: Structural Accumulation CompleteLook at the daily chart.
What we are witnessing is a textbook, massive Inverse Head & Shoulders pattern that has been grinding out its accumulation phase since mid-last year.
The Footprint: We saw a definitive trend-changing rally off the 28,600 structural low, followed by a tight, symmetric right shoulder consolidation.
The Breakout: Bosch has cleanly cleared the major breakout level at 39,599, piercing right through local resistance blocks with accelerating momentum.
With price breaking out into new All-Time Highs (ATHs), the overhead supply is completely wiped clean.
This sets up a highly asymmetric expansion phase for the second half of this calendar year.Why Bosch Commands (and Deserves) a Premium Many market participants mistakenly value auto-component players on a linear curve.
Bosch defies this by consistently commanding a steep scarcity premium.
As the industry transitions into advanced powertrain technology, electronics, and stricter safety standards, Bosch isn't just a supplier—they own the core architecture.
Their deep engineering moat justifies every bit of their premium multiple.
1. The MNC Moat vs. Domestic Suppliers
The core of Bosch’s dominance lies in the unique Multinational Parent vs. Domestic Supplier dynamic:Global R&D Leverage: Local domestic suppliers have to build proprietary tech from scratch or pay massive licensing fees.
Bosch India simply plugs straight into the global parent company's multi-billion dollar engineering ecosystem.
The Tech Transition: Whether it’s advanced electronic control units (ECUs), driver-assistance software, or complex fuel-injection systems, the global parent has already battle-tested the technology in Western markets.
Bosch India can localise and deploy these premium products at a speed and margin structure that purely domestic peers cannot match.
Tier-1 Sticky Relationships: Global automotive OEMs demand uniformity across regions. Because Bosch is embedded at the global design level for these manufacturers, they naturally capture the highest-margin component share when those models are manufactured or updated domestically.
2. The H2 Catalyst: Content per Vehicle Tailwinds
The second half of this calendar year will be driven by a massive structural trend:
Premium-isation.
The shift in consumer demand toward premium SUVs and high-spec vehicles plays directly into Bosch’s hands.
As OEMs shift their production mix toward higher-end trims, the dollar-content per vehicle supplied by Bosch scales exponentially.
They aren't just selling more units; they are selling vastly more expensive, tech-heavy systems into every vehicle rolling off the assembly lines.
The Targets & Execution
The breakout confirmation opens up clear outside expansion space:
Immediate Play: Retests of the 39,000–39,600 neckline zone are for aggressive buying.
Linear Target: $48,680
Logarithmic Target: $52,191
TSX:THE accumulation block is broken. Capital is rotating into pure quality.
Disclaimer: This is for educational and idea-sharing purposes only.
#BOSCH #AutomotiveTech #SwingTrading #PriceAction #Breakout #TradingView #ChartPatterns #NiftyAuto #ValueInvesting #TechnicalAnalysis
Manage your risk coordinates dynamically.  Long
Long
 Long
Long
MARUTI | Bullish Trend Intact — Liquidity Grab Before The Run! By analyzing the 🇮🇳 #MARUTI (Maruti Suzuki) chart on the 4H timeframe, we can see that the broader trend remains firmly bullish. Price has been printing bullish BOS along the way, and the current corrective structure looks like it's building the fuel for the next major leg higher.
📊 4H Timeframe
On the 4H, the uptrend is intact — price is still trading well above the Protected Low at ₹10,733.70 , the structural line for the entire bullish thesis. After the last impulsive push, price dropped in a sharp, violent corrective move — in my read, that's most likely wave A of a larger correction. Since then, price has been grinding higher in a rising corrective channel, and that channel is simultaneously building a pool of liquidity at its lows — the classic footprint of a wave B.
Here's the key nuance: for price to launch a genuinely powerful move higher, it likely first needs to sweep all that liquidity resting at the channel lows and dip down into the Flip Zone ( ₹11,034 – ₹12,062 ) — the high-quality demand area where I'd expect buyers to reload. That flush would complete the corrective structure and set the stage for the real impulsive leg.
🎯 The Bias
My base case is bullish continuation, but with patience. The trend stays up as long as price holds above the Protected Low (₹10,733.70). Ideally, I want to see price sweep the channel-low liquidity and tap the Flip Zone (₹11,034 – ₹12,062) before the strong rally — a liquidity grab into demand is the cleaner setup than chasing here. From that zone, the draw is toward the buy-side liquidity (BSL) resting overhead at ₹15,469.40 and then ₹17,375.25 . The one thing that invalidates this: a decisive break below the Protected Low (₹10,733.70) — that would flip the structure bearish and put the bullish idea on hold.
📰 Fundamental Backdrop
The technical setup lines up with a genuinely pivotal fundamental moment. Maruti Suzuki — India's largest passenger-vehicle maker, with Suzuki Motor Corporation holding a 56.21% stake — has confirmed its board will meet on July 31, 2026 to approve Q1 FY27 results, making that the next major catalyst. Early estimates point to a mixed print: strong double-digit revenue growth on the back of solid sales volumes, but profitability could come under pressure — with some estimates flagging a potential ~10% profit decline due to higher raw-material costs. Investors will be watching management commentary on domestic demand, export growth, price hikes and commodity prices very closely. On the shareholder-return front, the company has declared an FY26 final dividend of ₹140 per share, with a record date of August 7, 2026 — a near-term positive for holders. The move comes as India Inc.'s June-quarter earnings season gathers pace, with TCS, HCLTech, Avenue Supermarts and L&T Technology Services already having reported. Net-net: the fundamental engine (volume-driven revenue, market leadership, dividend) supports the bullish structure, but the margin pressure and the July 31 print are the risks to respect before the next leg.
This analysis will be updated as the market evolves. If this breakdown added value, drop a like 👍 and a comment 💬 to support the work — and share where you see Maruti heading next! Best Regards, BigBeluga 🐳 CITY UNION BABNKCity Union Bank — Updated MTF Trade Assessment
This version is much better structured because the Profit based on Positional Target = ₹625K now correctly matches the Position Target ₹273.
🟢 Overall Rating: 9.0 / 10 — STRONG MTF LONG
The setup has excellent multi-timeframe alignment:
HTF UP → MTF UP → ITF UP
And the entry sits directly around the strongest ITF demand zone.
1. Technical Confluence — ⭐⭐⭐⭐⭐
HTF
Yearly: 81–154
6M: 107–166
Quarterly: 145–174
HTF Average: 138
MTF
Monthly: 157–180
Weekly: 194–207
Daily: 204–212
MTF Average: 192
ITF
240M: 211–214
180M: 211–213
60M: 211–214
ITF Average: 212
The key zone is ₹207–214
You have Weekly + Daily + 240M + 180M + 60M demand clustered around the entry.
That is a very strong confluence.
2. Entry — 🟢 Excellent
Entry 1: ₹214
Entry 2: ₹207
Average: ₹210.50
This is a good two-level accumulation strategy.
At 10,000 shares:
Total Buy Value = ₹2,105,000 ✅
Own capital at 40% = ₹842,000 ✅
MTF funding = ₹1,263,000 ✅
These numbers are internally consistent.
3. Stop Loss — 🟢 Good
SL = ₹200
Actual average entry = ₹210.50
Risk:
₹10.50/share
For 10,000 shares:
Gross Risk = ₹105,000 ✅
Risk percentage:
4.98%
This is reasonable for the setup.
4. Primary Target — ₹256
Your primary target remains:
₹256
Reward:
256 − 210.50 = ₹45.50
Price RR:
4.33 : 1
Your sheet shows 4.3, which is correct.
This is a very attractive technical RR.
5. Positional Target — ₹273 🟢
Now your profit calculation is aligned correctly.
₹273 − ₹210.50 = ₹62.50
10,000 shares:
Gross Profit = ₹625,000 ✅
Less:
Brokerage/taxes: ₹10,318
MTF interest: ₹60,354
Net Profit = ₹554,328 ✅
So your current ₹554,328 calculation is mathematically correct based on your stated assumptions.
6. Positional RR
Using actual entry:
Reward = ₹62.50
Risk = ₹10.50
Price RR = 5.95 : 1
Your sheet shows Net RR = 4.81 because you are incorporating transaction costs and MTF interest.
That's a useful measure.
So:
Technical RR = ~5.95:1
Net economic RR = ~4.8:1
🟢 Excellent asymmetry.
7. MTF Risk
This is the only area I would keep under close control.
Your position:
₹2.105M exposure
against
₹842K own capital
At ₹200 SL:
₹105K gross loss
After charges, the immediate loss is around:
₹115K
Before considering accumulated MTF interest.
That's roughly:
13.7% of your ₹842K own capital
If the position takes months to reach the target, interest becomes increasingly important.
8. Target Management
I would not treat ₹273 as the first exit.
Use a staged approach:
₹245 — First milestone
Previous high.
Book 25–30%.
₹256 — Primary Target
Technical target.
Book another 40–50%.
₹273 — Positional Target
Keep the remaining quantity for the extended move.
This protects the trade while preserving upside.
Final Trade Framework
BUY ZONE: ₹207–214
Ideal Average: ₹210.50
SL: ₹200
T1: ₹245
T2: ₹256
Position Target: ₹273
Quantity: 10,000
Exposure: ₹2.105M
Own MTF Capital: ₹842K
MTF Funding: ₹1.263M
Expected economics
At ₹256:
Gross ≈ ₹455K
Net ≈ ₹384K
At ₹273:
Gross = ₹625K
Net = ₹554K
🟢 FINAL VERDICT: 9.0/10
This is now a very clean MTF trade setup.
The strongest factor is not simply the 4.3 RR—it is the confluence of demand zones across Weekly, Daily and ITF, combined with UP trend on every timeframe.
Trade Classification: A-grade MTF Long
Entry: 🟢 Strong
Trend: 🟢 Excellent
Demand: 🟢 Excellent
RR: 🟢 Excellent
Position Target: 🟢 Strong
MTF Economics: 🟢 Attractive
Leverage Risk: 🟠 Manage actively
One final rule: ₹200 should remain the hard thesis-invalidating level. If that level fails decisively, don't allow the attractive ₹554K positional-profit calculation to influence the exit decision. The trade thesis comes first; the projected profit comes second.  Long
Long
 Long
Long
 Long
Long
 Long
Long
 Long
Long

Viyash Scientific Ltd Viyash Scientific Ltd — Revised Trade Assessment
Overall Score: 8.5/10 🟢 STRONG LONG
The strongest feature is the complete MTF alignment:
Yearly ↑ → 6M ↑ → Quarterly ↑ → Monthly ↑ → Weekly ↑ → Daily ↑ → 240M ↑ → 180M ↑ → 60M ↑
That is a very strong trend-confirmation structure.
1. Demand Structure — 9/10
Your demand zones are well aligned:
HTF: 175–205 average structure
Quarterly: 210–258
Monthly: 210–258
Weekly: 248–261
Daily: 245–255
ITF: 245–255
The important observation is that 248–258 is the strongest confluence zone.
Your average entry of 255 sits directly inside this confluence.
This makes 248–255 a high-quality accumulation area.
2. Entry — 8.5/10
Entry 1 = 261
Entry 2 = 248
Average = 255
I prefer this two-stage entry rather than buying the full quantity at 261.
Why?
261 is the Weekly proximal boundary, whereas 248–255 has support from Weekly + Daily + ITF.
So:
248–255 → preferred buying zone
261 → confirmation/momentum entry
3. Stop Loss — 9/10
SL = 210
This is a very logical structural SL.
210 is the distal boundary of both Quarterly and Monthly demand.
Therefore, if price decisively breaks 210, the current MTF thesis becomes substantially weaker.
At average entry 255:
Risk = 255 − 210 = 45 points
Risk percentage:
45 / 255 = 17.65%
This is relatively wide, so position sizing is important.
4. Reward — Excellent
Your revised:
Reward = 360
is consistent with approximately:
Final Target 615 − Entry 255 = 360
Your stated final target is 614, which gives:
614 − 255 = 359
So I would standardize the sheet to either:
Target = 614 → Reward = 359
or
Target = 615 → Reward = 360
Don't mix the two.
5. RR — Important Correction
You have:
RR = 2.8
but your final target is 614.
At entry 255 and SL 210:
Risk = 45
For 2.8R, target should be:
255 + (45 × 2.8) = 381
Therefore:
381 = 2.8R target
Whereas:
614 = ~7.98R target
So your sheet should distinguish between:
Trade RR Target = 2.8R → 381
and
Final Trend Target = 614 → ~8R
This is actually better, because you're not relying on 614 to justify the trade.
6. Profit Calculation — Now Much Better
Your revised calculation:
Buy value = 1,272,500
At target:
5,000 × 614 = 3,070,000
Gross profit:
3,070,000 − 1,272,500 = 1,797,500
Less brokerage/taxes:
1,797,500 − 6,238 = 1,791,262
Less interest:
1,791,262 − 24,323 = 1,766,939
✅ Total Net Profit = 1,766,939
So this part is now logically consistent.
7. But There Is Still One Issue: Net Loss
You have:
Loss = 222,500
That's correct:
(255 − 210) × 5,000 = 225,000
Actually, mathematically it should be:
225,000, not 222,500.
Then adding brokerage:
225,000 + 6,238 = 231,238
So:
Correct Net Loss ≈ 231,238
assuming the ₹6,238 cost applies to the losing trade as well.
Your current 228,738 appears to be understated by ₹2,500.
8. Corrected Trade Economics
Using Entry 255 / SL 210 / Target 614 / Qty 5,000:
Investment / Buy Value: 1,272,500
Capital requirement @ 40%: 509,000
Risk per share: 45
Total gross risk: 225,000
Reward per share: 359
Gross profit at 614: 1,795,000
Less transaction cost: ~6,238
Profit before interest: ~1,788,762
Less 4-month interest: ~24,323
Final net profit: ~1,764,439
There is a ₹2,500 difference from your current ₹1,766,939 because your sheet uses 360 reward / ₹1,797,500 profit, effectively treating the target as 615.
So again, standardize target to 614 or 615.
9. My Preferred Trade Structure
🟢 Entry Zone
248–255
🟡 Confirmation
261
🔴 Structural SL
210
🎯 Targets
T1: 300
T2: 338 — Trend High
T3: 381 — 2.8R
T4: 450 — extended
Final: 614 — long-term trend target
I would not expect 614 as the base case. It should be treated as a stretch target and managed with trailing SL after 338/381.
Final Verdict
Viyash Scientific = STRONG LONG | 8.5/10
Setup quality: ⭐⭐⭐⭐⭐
Trend alignment: ⭐⭐⭐⭐⭐
Demand confluence: ⭐⭐⭐⭐⭐
Entry quality: ⭐⭐⭐⭐½
Risk control: ⭐⭐⭐⭐
Reward potential: ⭐⭐⭐⭐⭐
Trade decision:
BUY / ACCUMULATE 248–255
Add/confirm above 261
SL 210
2.8R = 381
Major trend target = 338 → 381 → 450 → 614  Long
Long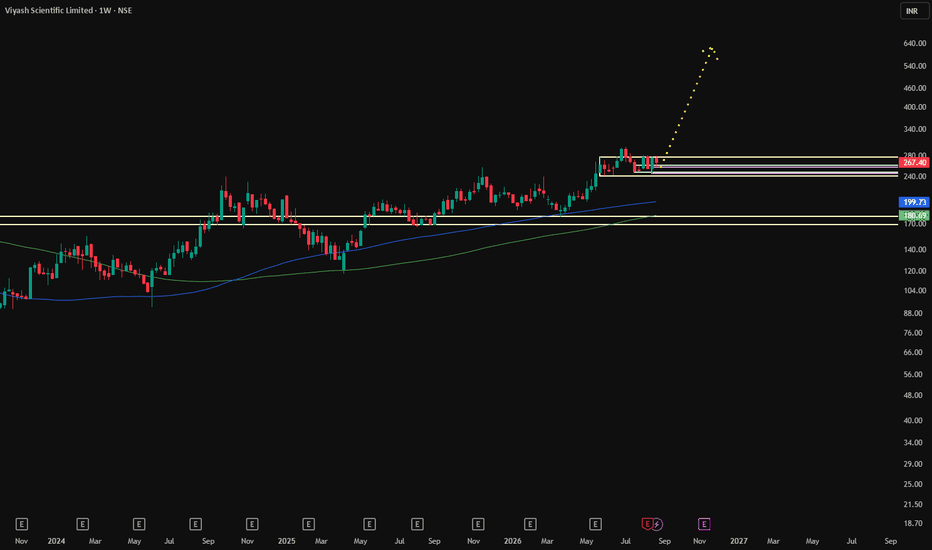
 Long
Long