RR KABEL🔍 Interpretation
Structure: Price pulled back toward the Daily DMIP zone (1,940 – 2,100) visible on your chart.
Bias: As long as price holds above 1,965, the setup favors a continuation toward 2,548.
Risk–Reward: Excellent (> 5 RR) — ideal for tactical swing positioning.
Momentum: Supported by strong prior trend and distance from 91 SMA (1,757) and 141 SMA (1,645).
📊 TRADE SETUP — RR Kabel Ltd. (NSE)
Item Trade 1
Entry 2,039
Stop‑Loss 1,965
Target 2,548
Risk (pts) 69
Reward (pts) 405
RR Ratio 5.87
Probability High
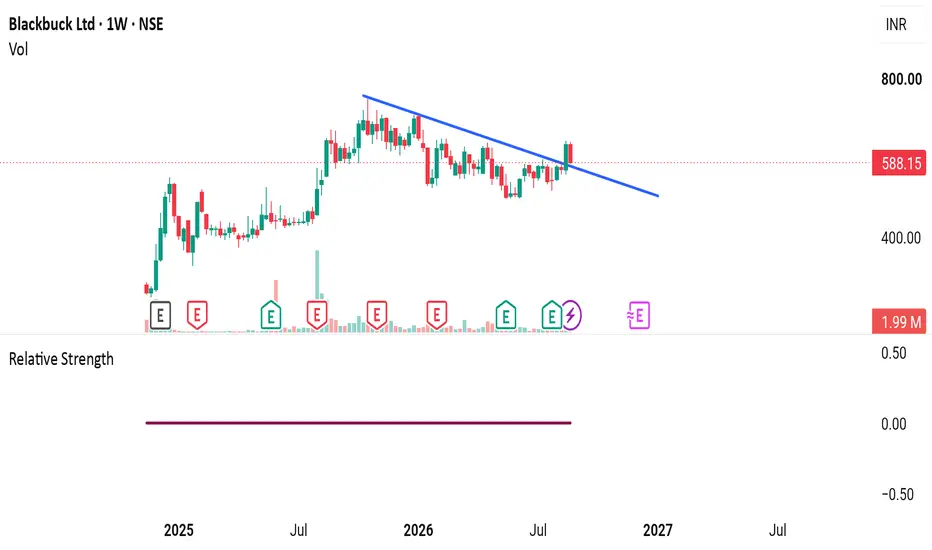
Pattern and timings on WebsolSeeing a flag & pole, and flag is like a falling wedge, while breakout has happened. We need retest on 105 and the next candle to rise up and need to breach its previous resistance at Rs 113, 124 & 129 - then the long term target becomes the length of the pole 70Rs starting from 107Rs. (all this while RSI & ADX is positive - which would hold good in 1yr timeframe)
The recent Q4 Call in Apr 28, 2026 had following in the summary -
FY26 Revenue was 82% YOY, last quarter was the best.
Balance sheet has Net Cash surplus.
Operational Performance - Cell capacity utilization touched 90%
Order book - at 1161 Cr , entire order book expected to be executed in 1yr.
Technology Upgrade & Expansion plans look good.
Debt & Promoter pledge - planning to repay Rs 92Cr IREDA loans (1-2 months), which will lead to release 80%+ pledged promoter shares.
Why $Delhivery is Decoupling from Oil?1. Fresh Earnings Proof (Operating Leverage)
#Delhivery literally just dropped its Q4 FY26 earnings report.
The numbers explain exactly why the chart is coiled like a spring:
Revenue & EBITDA Expansion: Quarterly revenue surged 30% YoY to ₹2,850 Cr, while EBITDA exploded 79.8% YoY to ₹214 Cr. Their EBITDA margins expanded from 5.4% to 7.5%.
The Free Cashflow Milestone: For the first time, the entire business turned Free Cashflow Positive.
The market cares far more about a structural shift to self-sustaining cash generation than it does about short-term fluctuations in global oil prices.
2. The Scale Weapon (Density Erases Fuel Spikes)
Delhivery delivered 1 billion e-commerce parcels this fiscal year alone—which matches the cumulative volume of the company's entire first 10 years of existence.
When you achieve that level of hyper-density in your network, your cost per parcel drops drastically because your trucks are always full and your automated sorting hubs are running at maximum capacity.
This internal operational efficiency completely overwhelms the incremental headwind of rising fuel costs.
3. The Fuel Surcharge Shield
Logistics companies do not just absorb fuel hikes out of pocket. Modern B2B and Partial Truckload (PTL) contracts are heavily structured with automated fuel escalation clauses.
When diesel prices cross certain thresholds, a variable fuel surcharge is automatically added to the customer's invoice.
Delhivery passes the oil pain directly down the line to the e-commerce platforms and enterprise clients, protecting their core margins.
UNIONBANK The Context: The Daily (1D) chart shows a sharp -6.46% drop, closing the session at 163.09. The bears completely took control of the day, pushing price right to the edge of major structural support.
The Demand Zone (Buy Zone): 156.00 – 160.00 (Gray Block). This remains the high-probability interest area. Price is currently hovering just 3 rupees above this floor.
The Supply Overhead (Targets): If demand defends the gray block, initial resistance sits at 164.02 (Green EMA label), followed by a heavy supply cluster between 171.00 – 173.40.
⚡ Execution Strategy: Don't FOMO into the daily close. Let the price bleed into the 156.00 – 160.00 pocket. Look for lower-timeframe exhaustion (wicks or inside bars) to trigger a long position, keeping a tight stop-loss just below 155.00 to target a bounce back toward 171.00+.
AIRTELAirtel – Consolidated Multi-Timeframe Demand Analysis
1. Trend Alignment (Top-Down)
Timeframe Trend Demand Zone Interpretation
Yearly 🟢 Up 1779–1559 Long-term institutional accumulation remains intact.
Half-Yearly 🟢 Up 1779–1408 Major macro support; strongest long-term buying area.
Quarterly 🟢 Up 1765–1669 Fresh institutional demand driving the primary trend.
Monthly 🟢 Up 1765–1669 Confirms continuation of the quarterly trend.
Weekly 🟢 Up 1779–1669 Buyers continue defending the same demand zone.
Daily 🟢 Up 1842–1779 Short-term momentum demand (DMIP).
2. Consolidated Demand Zones
Zone Timeframes Supporting Strength View
1842–1779 Daily ★★★★☆ Immediate momentum demand. Suitable for aggressive swing entries.
1779–1765 Daily + Weekly + Monthly + Quarterly + Yearly ★★★★★ Highest-confluence institutional demand zone.
1765–1669 Quarterly + Monthly + Weekly ★★★★★ Strong institutional accumulation zone for positional buying.
1669–1559 Quarterly + Yearly ★★★★☆ Long-term structural support.
1559–1408 Half-Yearly ★★★★★ Ultimate macro demand; trend invalidation only below this zone.
4. Consolidated Institutional View
Bullish Factors
✅ All six timeframes are in an uptrend.
✅ Quarterly, Monthly, and Weekly demand zones overlap almost perfectly.
✅ Daily demand sits directly above higher-timeframe demand, indicating momentum is aligned with the broader trend.
✅ No higher-timeframe supply zone is currently interrupting the trend.
✅ Strong institutional demand cluster between ₹1765 and ₹1779.
Risk Factors
A break below ₹1669 would weaken the intermediate-term bullish structure.
A sustained break below ₹1559–1408 would invalidate the long-term bullish structure and indicate a major change in trend.
BULLISH VIEW IN JINDAL STEEL-- EDUCATIONAL PURPOSEStock made high 376.85 in Oct 2024, then it corrected and made low 151.60 in Dec 2025 (-60% ) correction in 14-15 months. Stock recovered since Jan 2026 and now higher high higher low structure is formed which indicates uptrend. Stock consolidated for 6-8 weeks before forming Higher high higher low which adds strength to probable initiation of uptrend.
Long position can be initiated on re test level near 243.50
TARGET : 825 (238%) (FIBO)
STOP LOSS : 214 (-12%) ON WEEKLY CLOSING BASIS
RR RATIO : 1:19.7
Time Horizon : 10 years (July 2036)
ONLY FOR INVESTMENT PURSPECTIVE, NOT FOR SHORT TERM TRADING
Mahindra & Mahindra – Bullish Continuation Setup Near ₹3,190 ZonThe price has shown a steady recovery after a recent correction and is currently trading around the ₹3,130–₹3,190 zone. The stock is consolidating near a key resistance level, indicating accumulation and the potential for a bullish continuation if buying momentum sustains.
The key demand/support zone lies near ₹3,088 – ₹3,140, which can act as a strong base on pullbacks.
Trade Plan
Entry Zone:
₹3,130 – ₹3,190 (on consolidation or a sustained breakout above ₹3,190)
Stop Loss:
₹3,088.00 (below key demand zone / invalidation level)
Primary Targets:
₹3,420.60 (near-term resistance level)
₹3,657.45 (major resistance level)
₹3,905.50 – ₹3,908.10 (extended target if momentum continues)
Chart Observations
• Price has recovered from recent lows and is forming higher lows, indicating improving bullish momentum.
• The ₹3,088 – ₹3,140 zone is acting as a strong demand area and recent support.
• Current price action around ₹3,140–₹3,190 suggests consolidation before a potential breakout.
• ₹3,420.60 is the immediate resistance where price may face initial profit booking.
• A breakout above ₹3,420.60 can push the price toward ₹3,657.45 and eventually ₹3,905.50–₹3,908.10.
• The overall trend remains constructive as long as the price holds above the support zone.
Notes
• This is a bullish continuation setup with a favorable risk-reward profile.
• The stop loss at ₹3,088.00 helps manage downside risk effectively.
• Traders may consider partial profit booking near ₹3,420.60 and trail the remaining position toward higher targets.
• A sustained close above ₹3,190 would further strengthen the bullish outlook.
Disclaimer
This idea is for educational purposes only and not financial or investment advice. Markets are volatile and conditions can change quickly. Always do your own analysis and apply proper risk management before taking any trades.
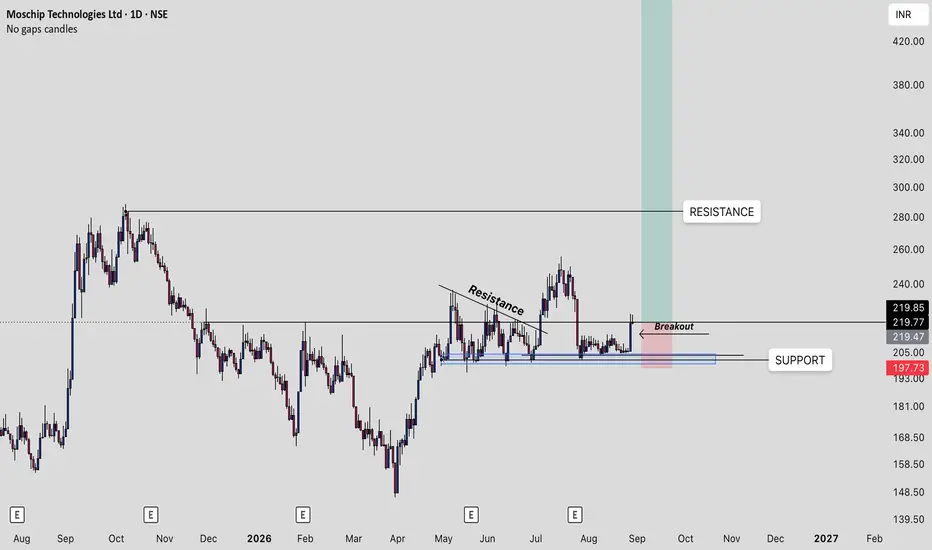
Bullish Flag in Moschip-- Educational purposeMoschip Technologies Ltd is a semiconductor and system design company with a focus on Turnkey ASICs, Mixed Signal IP, semiconductor & product engineering, and IoT solutions catering to aerospace & defence, consumer electronics, automotive, medical and networking & telecommunications
This small cap stock has formed bullish POLE FLAG pattern after downtrend from 288.45 (in Oct 2025) to 146.8 (in March 2026) i.e. almost - 50% correction in 6 -7 months. After making low in March 2026 stock has started rising and now bullish flag is formed with 2 months consolidation phase. Also stock has closed above 0.5 fibo level
Company is listed in Feb 2025 So not much data is available. But looking at the high demand for semiconductors it could be one of the 4x-5x candidate.
Long position can be initiated at around 215-220 level keeping in mind time horizon of 6-7 years.
Its a pure technical signal, fundamentals are not that good.
TARGET : 572 (160%)
STOP LOSS : 193 (-12%) ON WEEKLY CLOSING BASIS
RR RATIO : 1:13
TIME HORIZON 7 YEARS (TILL JULY 2033)
ONLY LONG TERM INVESTMENT PURSPECTIVE, NOT FOR SHORT TERM TRADING
SHILCHAR TechNSE:SHILCTECH NSE:SHILCTECH
Resistance Levels
Resistance 1 - ₹4,550–₹4,650
(Current supply)
Resistance 2 - ₹4,850
Major Resistance - ₹5,250–₹5,350
Previous lifetime high.
Support Levels
Immediate Support - ₹4,200
Strong Support - ₹3,950–₹4,050
Excellent accumulation zone.
Major Support - ₹3,680–₹3,750
Institutional demand zone.
Best Entry Plan
₹3,950–₹4,100
Highest probability area.
₹4,180–₹4,250
Good if price stabilizes with bullish candles.
Current Price - ₹4,390
Not ideal for fresh lump-sum buying because the stock is correcting from resistance.
Long-Term Investors
I'd use staggered buying:
30% around ₹4,250
40% around ₹4,050
30% around ₹3,750 (only if the market corrects) This reduces timing risk.
Exit Targets
Swing (6–12 months)
₹4,800
₹5,250
Long Term (2–3 years)
If earnings continue to compound and the transformer cycle remains strong:
₹6,500
₹7,500+
These are contingent on continued earnings growth and market valuation, not guaranteed outcomes.
SHILCHAR Tech
NSE:SHILCTECH
Resistance Levels
Resistance 1
₹4,550–₹4,650
(Current supply)
Resistance 2
₹4,850
Major Resistance
₹5,250–₹5,350
Previous lifetime high.
Support Levels
Immediate Support
₹4,200
Strong Support
₹3,950–₹4,050
Excellent accumulation zone.
Major Support
₹3,680–₹3,750
Institutional demand zone.
Best Entry Plan
★★★★★ Best Buy
₹3,950–₹4,100
Highest probability area.
★★★★☆
₹4,180–₹4,250
Good if price stabilizes with bullish candles.
★★★☆☆
Current Price
₹4,390
Not ideal for fresh lump-sum buying because the stock is correcting from resistance.
Long-Term Investors
I'd use staggered buying:
30% around ₹4,250
40% around ₹4,050
30% around ₹3,750 (only if the market corrects)
This reduces timing risk.
Exit Targets
Swing (6–12 months)
₹4,800
₹5,250
Long Term (2–3 years)
If earnings continue to compound and the transformer cycle remains strong:
₹6,500
₹7,500+
These are contingent on continued earnings growth and market valuation, not guaranteed outcomes.
Positional or Longterm Opportunity in EclerxGo Long @ 1472.1 for Targets of 1770, 1909 and 2048 with SL 1341.1
Reasons to go Long :
1. On Weekly timeframe If we draw Fibonacci retracement from the recent swing low (A) to the swing high (B) then the stock took support from the 0.618 Fibonacci level.
2. On Weekly timeframe there is a strong demand zone (marked with a purple color) from which the stock is taking support.
3. The stock formed a Bullish Double Bottom (W) Pattern.
4. Also there is a strong Trendline (marked with green color) which supports the stock.
PPAP AUTOMOTIVE LIMITEDNSE:PPAP
256 on 03-07-2026
Key levels
Current Price: ~₹256.5
Major Resistance: ₹275–285
Breakout Confirmation: Weekly close above ₹315
Support 1: ₹240–245
Support 2: ₹225–230
Strong Support: ₹205–210
Best accumulation zones
🟢 Zone 1 (Best): ₹225–235
Good risk-reward
Near previous demand area
Suitable for the first allocation
🟢 Zone 2 (Aggressive): ₹205–215
Strong historical support
Attractive if the broader market corrects
Consider a larger allocation only if the business thesis remains intact
🟡 Breakout Buy: Above ₹315
Only after a weekly closing breakout with strong volume
Suitable for momentum investors
Zone to avoid
🔴 ₹270–310
This is a resistance/supply area where the stock has struggled historically.
Risk of rejection is higher than reward for fresh buying.
Suggested position sizing
30% allocation at ₹235–240
40% allocation at ₹220–225
30% allocation only if it dips to ₹205–210
If instead the stock breaks above ₹315 on strong weekly volume, you could buy the breakout rather than waiting for a pullback.
Long-term targets (if execution remains strong)
12–18 months: ₹350–380
2–3 years: ₹500–650
5+ years (if margins improve, ROCE rises, and the order book converts into earnings): ₹900–1,200
The long-term targets depend on the company delivering on its growth plans and improving profitability; they are not guaranteed.
For now, I would wait for either:
A pullback into ₹225–235 (preferred), or
A confirmed weekly breakout above ₹315.
That offers a better balance between upside potential and downside risk than buying aggressively around ₹256. NSE:PPAP
POWERICA | Buy @600 | Strict SL below 570 on closing basisPOWERICA | Buy @600 | Strict SL below 570 on closing basis | Targets 735, 825, 920
*********************************************************************
The stock market involves risk, risk, and only risk. To survive in the market, accepting stop-loss with discipline and without hesitation. There is no other way to protect you capital.
Any stock I share is either already part of my existing holding or I take a fresh entry at the same level I mention. I always place the stop-loss in my system at the time of buying, and I give the highest importance to stop-loss more than the target. Once the target is achieved, I usually book profit once and then wait for either a retest or a fresh breakout.
Disclaimer (Please Read Carefully):
This is not investment advice. The stocks shared here are purely for educational and informational purposes. Please do your own research or consult with a financial advisor before making any investment decisions.