Black Box ⚙️ STOCK TO WATCH ⚙️
Black Box Ltd.
₹760–₹770 → ₹1,195 → ₹2,210 👀
A digital infrastructure and technology-solutions company appearing on my Weekly R4 Breakout Scanner.
📌 Buy Zone: ₹760–₹770
📌 Breakout Zone: ₹757
🛑 Stop Loss: ₹522
🎯 Target 1: ₹1,195
🎯 Target 2: ₹2,210
Why Black Box?
🌐 Provides digital infrastructure solutions spanning data centres, enterprise networking and connectivity.
🤖 Its exposure to AI-ready infrastructure and hyperscale data-centre requirements gives it a strong structural growth theme.
📈 FY26 order backlog reached approximately $792 million (~₹7,000 crore), up 57% YoY, providing strong revenue visibility.
🚀 FY26 revenue rose 6% to ₹6,322 crore, while EBITDA increased 7% to ₹570 crore and PAT rose 6% to ₹218 crore.
📊 Weekly Camarilla R4 Breakout Setup.
Why It Caught My Attention
✅ Strong AI & digital-infrastructure theme
✅ Exposure to data-centre growth
✅ 57% YoY increase in order backlog
✅ Improving profitability and business mix
✅ Weekly R4 Momentum Breakout
⚠️ High Risk – High Reward Setup. Always follow strict stop-loss and disciplined position sizing.
📢 Disclaimer: This content is for educational purposes only and not investment advice. Please do your own due diligence before making any investment decisions.
Risk Defined. Reward Visible.
© 20K Microcap Investing | R4 Momentum Desk
#BlackBox #BBOX #DigitalInfrastructure #DataCenters #AIInfrastructure #TechnologyStocks #StockMarketIndia #IndianStocks #StocksToWatch #R4Breakout #20KMicrocap  Long
Long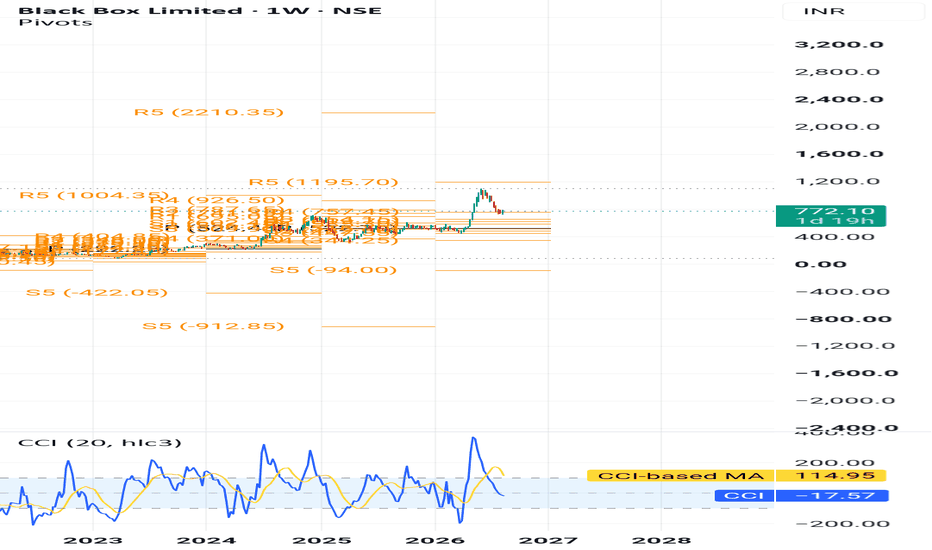
KEI Industries ⚙️ STOCK TO WATCH ⚙️
KEI Industries Ltd.
₹5,650–₹5,700 → ₹8,414 👀
A leading wires and cables manufacturer appearing on my Weekly R4 Breakout Scanner.
📌 Buy Zone: ₹5,650–₹5,700
📌 Breakout Zone: ₹5,642
🛑 Stop Loss: ₹4,657
🎯 Target: ₹8,414
Why KEI Industries?
⚡ One of India's leading manufacturers of wires and cables, serving residential, commercial and industrial markets.
🏗️ Exposure to India's infrastructure, power transmission, construction and real-estate capex cycle.
📈 Q1 FY27 revenue grew 22.97% YoY to ₹3,185 crore, while net profit increased 40.05% YoY to ₹274 crore.
🚀 EBITDA rose nearly 40% YoY, with margin improving to 13.04%, supporting the ongoing operating-efficiency story.
📊 Weekly Camarilla R4 Breakout Setup.
Why It Caught My Attention
✅ Strong wires & cables theme
✅ Beneficiary of India's power & infrastructure capex
✅ Strong Q1 FY27 earnings momentum
✅ Improving operating margins
✅ Weekly R4 Momentum Breakout
⚠️ High Risk – High Reward Setup. Always follow strict stop-loss and disciplined position sizing.
📢 Disclaimer: This content is for educational purposes only and not investment advice. Please do your own due diligence before making any investment decisions.
Risk Defined. Reward Visible.
© 20K Microcap Investing | R4 Momentum Desk
#KEIIndustries #KEI #WiresAndCables #PowerInfrastructure #CapitalGoods #Manufacturing #StockMarketIndia #IndianStocks #StocksToWatch #R4Breakout #20KMicrocap  Long
Long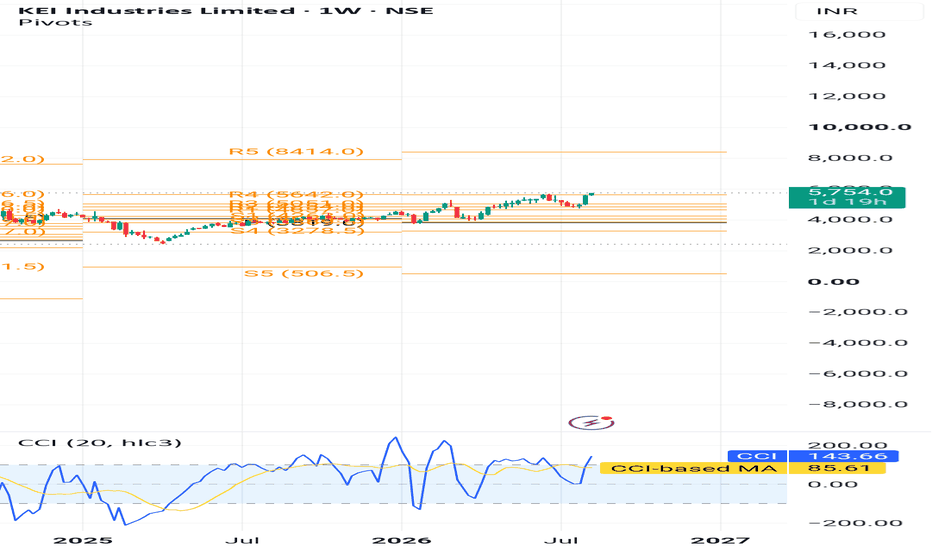
 Long
Long
 Long
Long
 Long
Long
 Long
Long
 Long
Long
ITC time To Make Long For Long-Term Hold
ITC Limited has evolved from being primarily a cigarette company into a **diversified Indian consumer and enterprise business**. Its business model is built around strong brands, extensive distribution, agricultural sourcing, manufacturing capabilities and vertical integration.
### 1. Cigarettes – The Cash Generation Engine
Cigarettes remain ITC's most important profit-generating business.
Major brands include:
* Gold Flake
* Classic
* Wills Navy Cut
* India Kings
* American Club
The cigarette business benefits from:
* Strong brand loyalty
* Large distribution network
* High entry barriers
* Pricing power
* Manufacturing scale
* Significant operating cash flows
The cash generated from cigarettes has historically helped ITC invest in and build its FMCG businesses.
**Business Model:**
**Tobacco sourcing → Manufacturing → Strong brands → Distribution → Consumers → Cash Flow**
---
### 2. FMCG – The Long-Term Growth Engine
FMCG is one of ITC's biggest strategic priorities.
The company has built a large portfolio across food, personal care, stationery and other consumer categories.
**Major Food Brands**
* Aashirvaad
* Sunfeast
* Bingo!
* YiPPee!
* Candyman
* Kitchens of India
**Personal Care**
* Fiama
* Vivel
* Engage
* Savlon
**Stationery**
* Classmate
**Other Categories**
* Mangaldeep
* Matches and household products
The objective is to build **large, scalable brands** that can generate recurring consumer demand.
ITC's advantage comes from combining its brands with its nationwide distribution network and manufacturing capabilities.
---
### 3. Agri Business – Backward Integration
ITC's Agri Business is an important part of its integrated business model.
The company sources and trades commodities such as:
* Wheat
* Rice
* Tobacco
* Coffee
* Spices
* Soya
* Other agricultural commodities
This gives ITC direct access to agricultural supply chains.
The model can be simplified as:
**Farmers → ITC sourcing → Processing → Manufacturing → ITC Brands → Consumers**
This creates advantages in:
* Raw-material sourcing
* Quality control
* Supply-chain management
* Export opportunities
* Cost efficiency
ITC's large agricultural sourcing network also supports its FMCG businesses.
---
### 4. Paperboards, Paper & Packaging
ITC operates a significant **B2B paper and packaging business**.
It produces:
* Paperboards
* Specialty papers
* Packaging products
* Value-added packaging solutions
The major strategic advantage is the connection between this business and ITC's FMCG operations.
For example:
**ITC FMCG Products → Packaging Requirement → ITC Packaging Capability**
This creates vertical integration and can improve supply-chain efficiency.
The business also serves external customers across industries such as FMCG, food, beverages and tobacco.
---
### 5. Hotels – Demerged Business
ITC historically operated a major hotel business under the group.
However, the Hotels business was demerged into **ITC Hotels Limited**, creating a separate listed company.
Therefore, when analysing ITC today, the Hotels business should be considered separately from ITC's core operating businesses.
---
### 6. ITC Infotech – Technology Services
ITC also has a presence in technology services through **ITC Infotech**.
It provides technology and digital transformation services to enterprise customers across industries.
This gives the broader ITC ecosystem exposure to the technology-services sector.
---
# ITC's Business Model Advantage
The biggest strength of ITC is not just its individual brands. It is the **ecosystem created between its different businesses**.
### Integrated Business Ecosystem
**Agriculture**
↓
**Raw Material Sourcing**
↓
**Manufacturing**
↓
**FMCG Brands**
↓
**Packaging**
↓
**Distribution Network**
↓
**Consumers**
↓
**Cash Flow**
This creates multiple points of competitive advantage.
---
## ITC Business Model at a Glance
| Business | Nature | Strategic Role |
| ----------------- | ---------------- | ------------------------------------- |
| Cigarettes | B2C | **Cash & Profit Generator** |
| FMCG | B2C | **Long-Term Growth Engine** |
| Agri Business | B2B/B2C | **Supply-Chain & Sourcing Advantage** |
| Paper & Packaging | B2B | **Vertical Integration** |
| ITC Infotech | B2B | **Technology Services** |
| Hotels | Separate Company | **ITC Hotels Limited** |
---
## The Core Investment Thesis
ITC can broadly be understood through **three layers**:
### 1. Cigarettes → Cash Generator
A mature, high-margin business that generates substantial cash flow.
### 2. FMCG → Growth Engine
ITC is attempting to build a diversified portfolio of large consumer brands beyond cigarettes.
### 3. Agri + Packaging → Competitive Moat
These businesses provide sourcing, manufacturing and supply-chain capabilities that support the wider ecosystem.
### In One Sentence
**ITC's business model is to use the strong cash generation of its cigarette business to build a diversified FMCG-led consumer portfolio, supported by agricultural sourcing, manufacturing, packaging, distribution and technology capabilities.**
### Key Risks
* Government taxation and regulation on cigarettes
* Increasing competition in FMCG
* Raw-material price volatility
* Changing consumer preferences
* Slower growth in mature cigarette markets
* Execution risk in scaling newer FMCG categories
**For an investor, ITC should therefore not be viewed simply as a cigarette company; it is increasingly a diversified consumer-business platform with cigarettes providing the financial foundation and FMCG providing the long-term growth opportunity.**
 Long
Long
POLYPLEX LTD MONTHLY ANALYSIS# POLYPLEX LTD. — LONG-TERM BULLISH TRAJECTORY
### **Liquidity Sweep → Discount Accumulation → FVG Repricing**
**Timeframe:** Monthly
**CMP:** ₹1,229.60
**Structure:** **Bullish reversal / long-term accumulation**
## Executive Summary
POLYPLEX has undergone a prolonged corrective phase from the 2022 peak near ₹2,870 and has now returned to a **deep discount region**, where the chart shows a major bullish FVG/demand zone.
The most important structural event is the sweep of the **52-week low / external sell-side liquidity around ₹750** followed by a strong bullish displacement.
This creates the foundation for a potential **multi-stage repricing toward higher liquidity pools**.
### Primary thesis:
**₹750 liquidity sweep → accumulation → bullish displacement → retracement → ₹1,474 → ₹1,698 → ₹2,441 → ₹2,523+**
---
## 🟢 TRADE BIAS: LONG
### Preferred Accumulation Zone
**₹850–₹1250**
The chart's highlighted demand/FVG region provides the preferred area for accumulating on weakness rather than chasing the current expansion.
### Current Price
**₹1,229.60**
Price has already moved substantially away from the original demand zone, so fresh entries at current levels carry less attractive risk/reward.
---
## 🎯 TRAJECTORY
### TP1 — ₹1,474
First major buy-side liquidity objective.
A sustained move above this level would confirm that the current recovery is progressing beyond the initial reversal phase.
### TP2 — ₹1,698
Major historical liquidity/resistance.
This is the next significant structural objective after ₹1,474.
### TP3 — ₹2,441
Major bearish imbalance / **-IFVG** zone.
This region represents a substantial repricing target and should be treated as a major reaction area.
### TP4 — ₹2,523
Buy-side liquidity above the previous structural level.
A successful breakout through ₹2,523 opens the path toward the broader premium region.
### Extended Objective — ₹2,868+
The previous major high represents the ultimate long-term liquidity objective visible on the chart.
---
## MARKET STRUCTURE
POLYPLEX experienced a major decline from approximately **₹2,870 → ₹750**, creating a large long-term discount.
The important change occurred around the **₹750 region**, where price swept external sell-side liquidity and subsequently produced a strong bullish reaction.
The current structure therefore has three major phases:
**1. Distribution**
₹2,870 → ₹1,500+
**2. Capitulation / Liquidity Sweep**
₹1,500 → ₹750
**3. Accumulation & Repricing**
₹750 → ₹1,229+
The third phase is currently developing.
---
## 🔥 WHY THE SETUP IS INTERESTING
### 1. External SSL Sweep
The market traded into the **₹750 region**, taking the external sell-side liquidity marked on the chart.
### 2. Discount Location
The entire current accumulation structure remains substantially below the historical high.
### 3. Bullish FVG
The green FVG around **₹750–₹960** represents the principal demand/repricing zone.
### 4. Structural Recovery
Price has moved from the ₹750 region to above ₹1,200, indicating meaningful displacement away from the lows.
### 5. Multiple Buy-Side Liquidity Pools
Above the current price, the chart provides a clear sequence:
**₹1,474 → ₹1,698 → ₹2,441 → ₹2,523 → ₹2,868**
This creates a well-defined long-term liquidity roadmap.
---
# 📈 PROJECTED PATH
**₹1,229**
↓
**₹1,474**
↓
**₹1,698**
↓
**₹2,000–₹2,200**
↓
**₹2,441**
↓
**₹2,523**
↓
**₹2,868+**
The path does **not** imply a straight-line rally. Retracements and consolidation should be expected between each major liquidity objective.
---
## ⚠️ INVALIDATION
The bullish thesis materially weakens if price loses the major accumulation structure and begins accepting below the **₹750 external SSL region**.
A sustained breakdown below the structural low would indicate that the liquidity sweep did not establish a durable long-term reversal.
---
## EXECUTION FRAMEWORK
For a fresh position, the preferred approach is:
**DO NOT CHASE THE EXPANSION.**
Instead:
**Retracement → FVG/Demand → Confirmation → Long**
The **₹850–₹980 region** is therefore more attractive from a risk/reward perspective than entering aggressively after the current expansion.
---
# FINAL VIEW
POLYPLEX is transitioning from a prolonged **discounted accumulation structure into a potential long-term repricing phase**.
The key event was the **external sell-side liquidity sweep near ₹750** followed by bullish displacement.
If the structure remains intact, the higher-timeframe liquidity roadmap points toward:
### **₹1,474 → ₹1,698 → ₹2,441 → ₹2,523 → ₹2,868+**
The most important principle is **patience**. The strongest asymmetric opportunity would come from a controlled retracement into the highlighted demand/FVG rather than chasing price after a large expansion.
**LONG-TERM BIAS: 🟢 BULLISH**
*This publication is for educational and informational purposes only and does not constitute financial, investment, or trading advice. The projected levels are technical scenarios, not guaranteed targets. Equities can experience significant volatility and drawdowns. Conduct independent research, define risk in advance, and use appropriate position sizing before taking any position.*
 Long
Long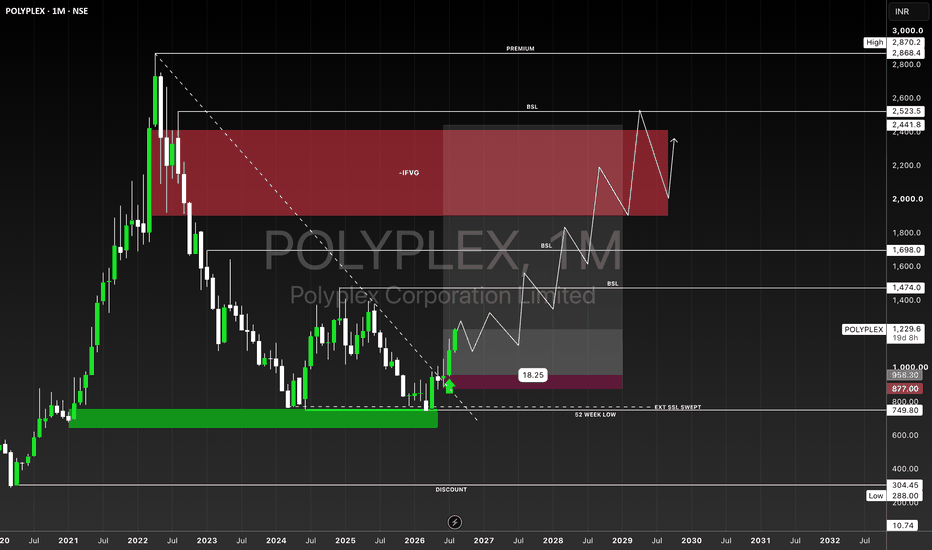
 Long
Long
INDO AMINES LTD MONTHLY ANALYSIS# INDO AMINES LTD. — MONTHLY STRUCTURAL TRAJECTORY
### **Sell-Side Liquidity Sweep → Discount Recovery → Repricing Toward Buy-Side Liquidity**
**NSE:** INDOAMIN
**Timeframe:** 1M
**CMP on chart:** ₹133.00
**Bias:** 🟢 **Bullish, but confirmation-dependent**
**Setup:** Long-term positional / swing
Indo Amines operates in the **Chemicals / Specialty Chemicals** segment, manufacturing fatty amines, amine derivatives, fine chemicals and performance chemicals used across industries including pharma, agrochemicals, plastics, petrochemicals and road construction. Moneycontrol currently shows a market cap of about **₹927 crore** based on its latest available quote data. ( )
---
## EXECUTIVE SUMMARY
The monthly structure is developing a potential **bullish reversal from deep discount**.
Price has recovered from the **₹82–₹90 region** and is now around **₹133**, following a visible sweep of external sell-side liquidity around **₹124.89**.
The important question now is whether this recovery can develop into a larger repricing cycle.
### Primary trajectory:
**₹133 → ₹148.71 → ₹183.04 → ₹210.56 → ₹246.59**
The setup becomes particularly attractive on a controlled retracement toward the **₹119–₹125 region**, provided the bullish structure remains intact.
---
# 🧭 STRUCTURAL ANALYSIS
### 1. Deep-Discount Location
The long-term range shown on the chart extends approximately from:
**₹69 → ₹246.59**
The current price of ₹133 remains below the midpoint of that broader range.
Therefore, the stock is still positioned within the **discount half of the long-term structure** rather than at extreme premium.
---
### 2. External Sell-Side Liquidity Sweep
The chart explicitly marks:
### **EXT SSL SWEPT — ₹124.89**
Price moved into this liquidity region and subsequently reacted higher.
This is an important structural event because the market first accessed downside liquidity before attempting a bullish repricing.
---
### 3. Current Recovery
After the sweep, price recovered toward:
### **₹133**
The recent candles show stabilization and a potential transition from the previous bearish sequence into a recovery structure.
However, **₹148.71 remains the first major confirmation level**.
---
# 🎯 KEY LEVELS
| Level | Role |
| ----------: | ---------------------------------- |
| **₹246.59** | Major long-term high / premium |
| **₹210.56** | Major upside liquidity objective |
| **₹183.04** | 52-week high |
| **₹148.71** | Immediate structural resistance |
| **₹133.00** | Current price |
| **₹124.89** | External sell-side liquidity sweep |
| **₹118.96** | Immediate structural support |
| **₹82.53** | Major discount region |
| **₹70.11** | Long-term external low |
---
# 🚀 LIQUIDITY ROADMAP
## TP1 — ₹148.71
### **FIRST MAJOR RESISTANCE**
From ₹133:
**≈ +11.8%**
This is the first level that needs to be reclaimed.
A decisive monthly acceptance above ₹148.71 would improve the probability of continuation toward the next liquidity pool.
---
## TP2 — ₹183.04
### **52-WEEK HIGH**
From ₹133:
**≈ +37.6%**
This becomes the next major objective after a successful reclaim of ₹148.71.
The market is likely to encounter meaningful supply around this previous high.
---
## TP3 — ₹210.56
### **MAJOR HIGHER-TIMEFRAME OBJECTIVE**
From ₹133:
**≈ +58.3%**
This is the major intermediate liquidity objective shown on the chart.
A break above the 52-week high would expose this level.
---
## TP4 — ₹246.59
### **LONG-TERM PREMIUM / EXTERNAL HIGH**
From ₹133:
**≈ +85.4%**
This represents the extended monthly trajectory and the upper boundary of the visible range.
Reaching this level would constitute a substantial long-term repricing.
---
# 🔄 RETRACEMENT SCENARIO
The chart shows a potential risk/reward structure around:
### **₹119–₹125**
This region is particularly important because it combines the recent sell-side liquidity sweep with the lower portion of the current structure.
A controlled retracement toward this region followed by bullish confirmation could provide a better entry than chasing price after expansion.
### Preferred sequence:
**₹133**
↓
**₹125–₹119**
↓
Bullish reaction
↓
**₹148.71**
↓
**₹183.04**
↓
**₹210.56**
---
# 🟢 BULLISH CONTINUATION SCENARIO
If price holds above the recent liquidity-sweep structure and successfully reclaims ₹148.71:
### **₹148.71 → ₹183.04 → ₹210.56 → ₹246.59**
This would represent progressive consumption of buy-side liquidity.
The **₹183.04 52-week high** is the critical intermediate test.
---
# 🔴 FAILURE SCENARIO
The bullish thesis becomes weaker if price loses the recent structural support around:
### **₹118.96**
A sustained breakdown below this region would suggest that the recent sell-side sweep has not produced sufficient bullish displacement.
The next major downside area would be:
### **₹82.53**
followed by the long-term external low around:
### **₹70.11**
---
# 📊 RISK/REWARD OBSERVATION
At ₹133:
**TP1 ₹148.71 → +11.8%**
**TP2 ₹183.04 → +37.6%**
**TP3 ₹210.56 → +58.3%**
**TP4 ₹246.59 → +85.4%**
The upside asymmetry is attractive **if the ₹119–₹125 structure holds**.
The setup is therefore better characterized as:
> **Bullish recovery with a confirmation requirement — not an unconditional breakout call.**
---
# 🧠 MARKET NARRATIVE
The monthly structure can be summarized as:
### **LONG-TERM DISTRIBUTION**
↓
### **DECLINE**
↓
### **DEEP DISCOUNT**
↓
### **SELL-SIDE LIQUIDITY SWEEP**
↓
### **DEMAND RESPONSE**
↓
### **RECOVERY**
↓
### **BUY-SIDE LIQUIDITY TARGETING**
The next major structural transition is a reclaim of **₹148.71**.
If achieved, the market has room to challenge the **₹183.04 52-week high** and potentially extend toward **₹210.56–₹246.59**.
---
# 🔥 FINAL VIEW
### **BIAS: 🟢 BULLISH**
**CMP:** ₹133
### Immediate target:
**₹148.71**
### Major target:
**₹183.04**
### Extended target:
**₹210.56**
### Long-term target:
**₹246.59**
### Preferred retracement:
**₹119–₹125**
### Structural support:
**₹118.96**
### Major downside reference:
**₹82.53**
### External low:
**₹70.11**
**The chart presents a credible long-term recovery thesis after the sell-side liquidity sweep. The key confirmation is ₹148.71. Above that level, the trajectory toward ₹183 → ₹210 → ₹246 becomes increasingly relevant. A loss of ₹118.96 would invalidate the immediate bullish structure.**
---
### ⚠️ DISCLAIMER
This publication is for **educational and informational purposes only** and does not constitute investment advice, financial advice, or a recommendation to buy or sell INDOAMIN.
The projected levels are **technical scenarios derived from the chart structure**, not guaranteed targets. Technical structures can fail without warning.
Investors and traders should conduct their own due diligence and use appropriate position sizing and risk management.
**Trade the structure. Manage the risk. Let price confirm the thesis.**
: www.moneycontrol.com "Indo Amines Share Price, Indo Amines Stock Price, Indo Amines Ltd. Stock Price, Share Price, Live BSE/NSE, Indo Amines Ltd. Bids Offers. Buy/Sell Indo Amines Ltd. news & tips, & F&O Quotes, NSE/BSE Forecast News and Live Quotes - Moneycontrol.com"
 Long
Long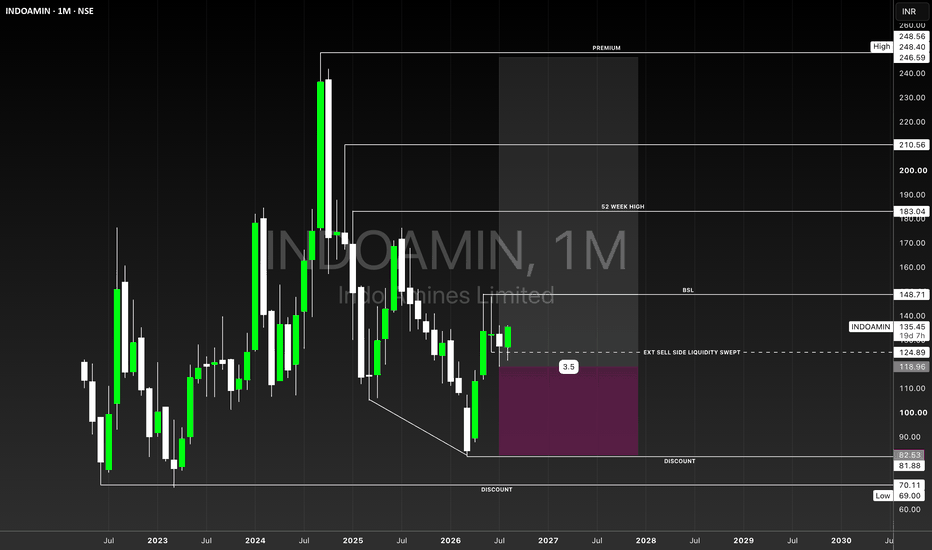
GUJARAT INDUSTRIES VIEW# GIPCL — GUJARAT INDUSTRIES POWER COMPANY LTD.
### **Monthly Structural Analysis | Discount Repricing → Liquidity Expansion**
**NSE:** GIPCL
**Timeframe:** 1M
**CMP:** ₹164.64
**Bias:** 🟢 **Bullish**
**Setup:** Long-term positional / swing
---
## EXECUTIVE SUMMARY
GIPCL is showing a constructive long-term recovery after a major sell-side liquidity sweep and reaction from the **₹120–₹130 demand/FVG region**.
The monthly chart indicates that price has transitioned from deep discount into a recovery phase, with the immediate structure now focused on reclaiming **₹175.26** and subsequently attacking the higher-timeframe liquidity at **₹211.42**.
The broader trajectory visible on the chart is:
### **₹155 → ₹175 → ₹185 → ₹211 → ₹245 → ₹270**
The key feature is the **external sell-side liquidity sweep near ₹53.55**, followed by the large multi-year advance and subsequent retracement into the monthly FVG.
---
# 🧭 MARKET STRUCTURE
### 1. Major Sell-Side Liquidity Sweep
The chart identifies external sell-side liquidity around:
### **₹53.55**
This area was swept during the earlier accumulation phase.
After the sweep, price produced a substantial multi-year expansion toward the ₹250–₹270 region.
That makes the lower structure important: the market has already demonstrated a willingness to aggressively reprice after taking downside liquidity.
---
## 2. Major Demand / FVG
The green monthly **+FVG** sits approximately around:
### **₹120–₹140**
Price subsequently returned toward this area and produced a strong reaction.
The important low established around:
### **₹120.54**
currently acts as the major 52-week structural reference.
This is the foundation of the current bullish thesis.
---
# 🟢 CURRENT STRUCTURE
GIPCL is currently trading around:
### **₹164.64**
The chart shows price recovering from the ₹120 region and developing a higher-value structure above the demand zone.
The immediate challenge is the **₹175.26 BSL**.
A sustained break and acceptance above ₹175.26 would strengthen the continuation scenario.
---
# 🎯 KEY LEVELS
| Level | Significance |
| ----------: | ------------------------------------------- |
| **₹269.75** | Major long-term high / premium |
| **₹245.07** | 52-week high |
| **₹211.42** | Future MSNR / major upside objective |
| **₹185.00** | Future re-entry / intermediate objective |
| **₹175.26** | Buy-side liquidity |
| **₹164.64** | Current price |
| **₹155.00** | Best R:R re-entry zone |
| **₹153.37** | Short-term structural reference |
| **₹142.27** | Invalidation |
| **₹120.54** | 52-week low |
| **₹73.70** | External liquidity |
| **₹53.55** | Previous external sell-side liquidity sweep |
---
# 🚀 TRAJECTORY
## TP1 — ₹175.26
### **BUY-SIDE LIQUIDITY**
This is the first important hurdle.
From ₹164.64:
**≈ +6.4%**
Price may experience a reaction around this level because it represents identifiable buy-side liquidity.
A clean reclaim would strengthen the bullish structure.
---
## TP2 — ₹185
### **FUTURE RE-ENTRY / INTERMEDIATE OBJECTIVE**
From ₹164.64:
**≈ +12.4%**
This becomes relevant once ₹175.26 is successfully reclaimed.
---
## TP3 — ₹211.42
### **FUTURE MSNR**
This is the major projected objective on the chart.
From ₹164.64:
**≈ +28.4%**
This is the level where a larger reaction or consolidation should be anticipated.
---
## TP4 — ₹245.07
### **52-WEEK HIGH**
From ₹164.64:
**≈ +48.8%**
A successful attack on ₹211 followed by continuation would put the previous annual high into focus.
---
## TP5 — ₹269.75
### **MAJOR PREMIUM / EXTERNAL HIGH**
From ₹164.64:
**≈ +63.8%**
This represents the extended long-term objective shown on the chart.
A move toward ₹270 would complete a major recovery toward the previous premium region.
---
# 🔄 BEST RISK/REWARD ZONE
One of the most important observations from the chart is:
### **₹155**
marked as the **BEST R:R ENTRY**.
If price retraces toward ₹155 and holds the underlying bullish structure, the setup becomes considerably more attractive.
Potential trajectory:
**₹155**
↓
**₹175**
↓
**₹185**
↓
**₹211**
↓
**₹245**
↓
**₹270**
This provides significantly better asymmetry than chasing price after a large expansion.
---
# 🧠 WHY ₹155 MATTERS
₹155 sits close to the current structural transition zone and provides a better location relative to the invalidation at:
### **₹142.27**
Approximate risk from ₹155 to ₹142.27:
**₹12.73/share**
Potential upside to:
* ₹175 → ~₹20
* ₹185 → ~₹30
* ₹211 → ~₹56
* ₹245 → ~₹90
* ₹270 → ~₹115
Therefore, the setup becomes increasingly asymmetric if the market provides a controlled retracement toward ₹155.
---
# ⚠️ INVALIDATION
### **₹142.27**
This is the key technical invalidation shown on the chart.
A sustained monthly acceptance below ₹142.27 would materially weaken the current bullish thesis.
The next major structural reference would then become the:
### **₹120.54 — 52-WEEK LOW**
A breakdown below ₹120.54 would represent a much more serious deterioration of the current structure.
---
# 📈 BULLISH SCENARIO
### Scenario A — Immediate Continuation
If price holds above the current structure:
**₹164**
→ **₹175**
→ **₹185**
→ **₹211**
→ **₹245**
→ **₹270**
This would represent progressive consumption of buy-side liquidity.
---
# 🔄 RETRACEMENT SCENARIO
### Scenario B — Better Entry
Price may first retrace:
**₹164**
↓
**₹155**
↓
Bullish reaction
↓
**₹175**
↓
**₹185**
↓
**₹211**
This would offer a better risk-adjusted entry than chasing the current price.
---
# 🔴 BEARISH FAILURE SCENARIO
If price loses **₹142.27** on a sustained basis:
**₹142**
↓
**₹130**
↓
**₹120.54**
The bullish trajectory would require reassessment.
A break of the 52-week low would invalidate the current recovery structure and expose the possibility of a deeper move toward the historical demand/liquidity zones.
---
# 💎 LONG-TERM MARKET NARRATIVE
The broader monthly structure can be interpreted as:
### **SELL-SIDE LIQUIDITY SWEEP**
↓
### **ACCUMULATION**
↓
### **MAJOR EXPANSION**
↓
### **CORRECTION**
↓
### **FVG REACTION**
↓
### **REPRICING**
↓
### **BUY-SIDE LIQUIDITY EXPANSION**
The market has already demonstrated significant demand from the lower range.
The next question is whether that demand can generate a sustained reclaim of **₹175.26** and eventually attack **₹211.42**.
---
# 🔥 FINAL VIEW
### **BIAS: 🟢 BULLISH**
**Current:** ₹164.64
### Immediate liquidity:
**₹175.26**
### Intermediate:
**₹185**
### Primary target:
**₹211.42**
### Extended:
**₹245.07**
### Long-term:
**₹269.75**
### Preferred re-entry:
**₹155**
### Invalidation:
**₹142.27**
### Major structural low:
**₹120.54**
**The setup remains constructive above ₹142.27. A controlled retracement toward ₹155 would improve the risk/reward profile, while a decisive reclaim of ₹175.26 would strengthen the continuation thesis toward ₹211.42 and beyond.**
> **Do not confuse a bullish trajectory with a guaranteed outcome. The levels are scenarios; price confirmation remains the final authority.**
---
### ⚠️ DISCLAIMER
This publication is for **educational and informational purposes only** and does not constitute investment advice, financial advice, or a recommendation to buy or sell GIPCL.
All levels and projected trajectories are derived from the **technical structure visible on the chart** and should be treated as scenarios rather than guaranteed targets.
Markets can invalidate technical structures without warning. Consider liquidity, volatility, position sizing and personal risk tolerance before taking any trade or investment.
**Trade the structure. Manage the risk. Let price confirm the thesis.**
 Long
Long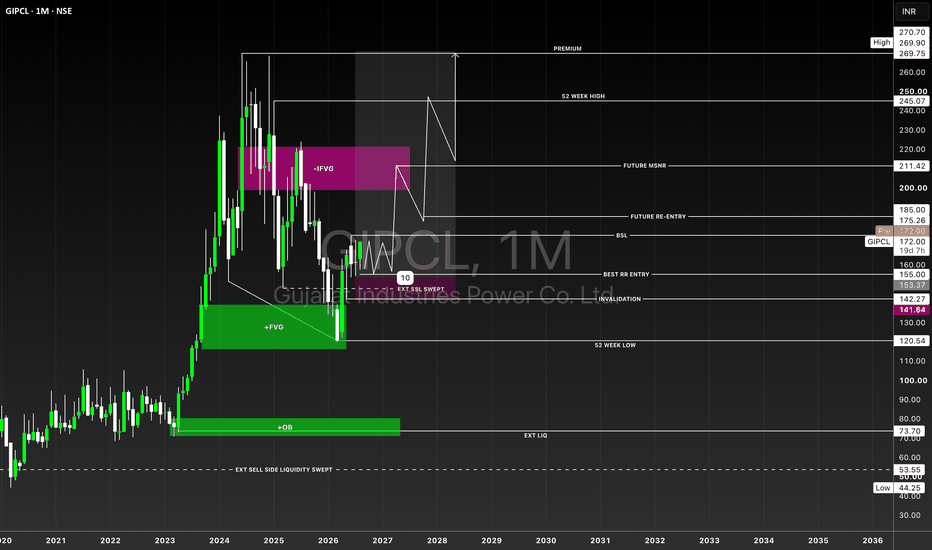
 Long
Long
 Long
Long