Long
Long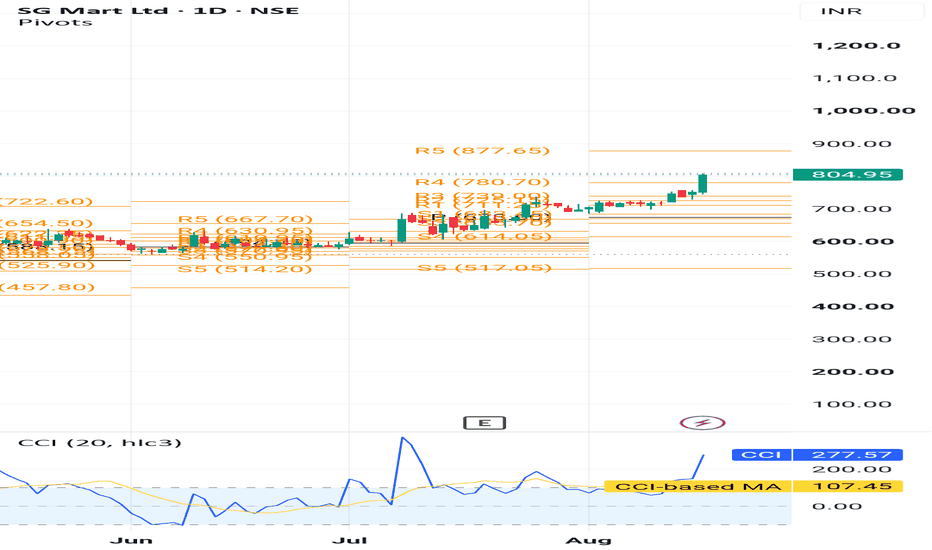
 Long
Long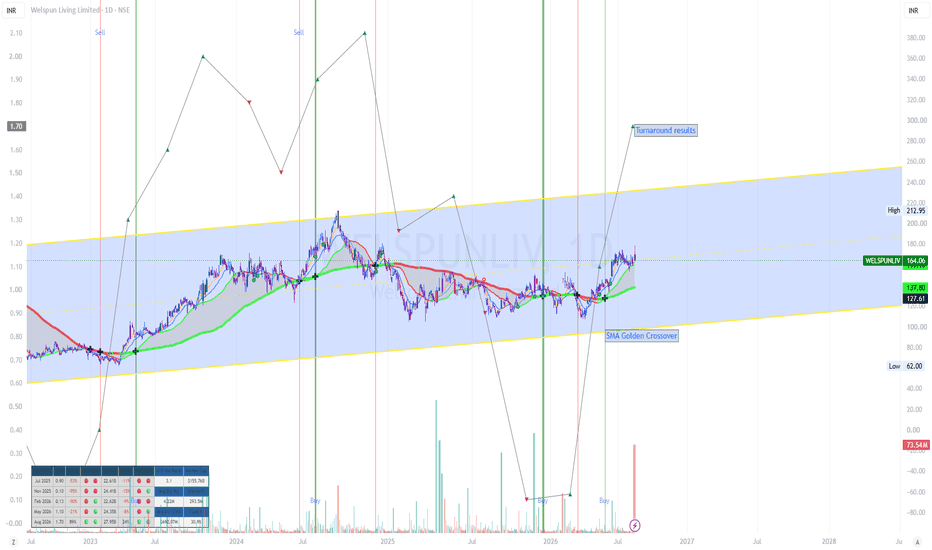
Hindustan Foods⚙️ STOCK TO WATCH ⚙️
Hindustan Foods Ltd.
₹625–₹630 → ₹844 → ₹1,409 👀
A diversified FMCG contract manufacturer appearing on my Weekly R4 Breakout Scanner.
📌 Buy Zone: ₹625–₹630
📌 Breakout Zone: ₹621
🛑 Stop Loss: ₹516
🎯 Target 1: ₹844
🎯 Target 2: ₹1,409
Why Hindustan Foods?
🏭 Diversified FMCG manufacturing: HFL operates across multiple categories and manufactures for established consumer brands. Its FY26 total income reached ₹4,264.7 crore, up 17% YoY, while PAT rose 29% to ₹149 crore.
📈 Fresh Q1 FY27 momentum: Revenue was about ₹1,200 crore, up roughly 21% YoY, while PAT rose about 35% to ₹42.8 crore; EBITDA reached approximately ₹100 crore.
🚀 Capacity-led growth: The company has continued investing heavily in new capacities, with FY27 capex plans and new projects across Home & Personal Care, Ice Cream, Food & Beverages and other categories.
📊 Weekly Camarilla R4 Breakout Setup.
Why It Caught My Attention
✅ Strong FMCG manufacturing theme
✅ Diversified business verticals
✅ Double-digit revenue growth
✅ Improving profitability
✅ Large capacity-expansion pipeline
✅ Weekly R4 Momentum Breakout
⚠️ High Risk – High Reward Setup. Always follow strict stop-loss and disciplined position sizing.
📢 Disclaimer: This content is for educational purposes only and not investment advice. Please do your own due diligence before making any investment decisions.
Risk Defined. Reward Visible.
© 20K Microcap Investing | R4 Momentum Desk
#HindustanFoods #FMCGStocks #FMCG #ContractManufacturing #ConsumerStocks #StockMarketIndia #IndianStocks #StocksToWatch #R4Breakout #MomentumInvesting #20KMicrocap  Long
Long
 Long
Long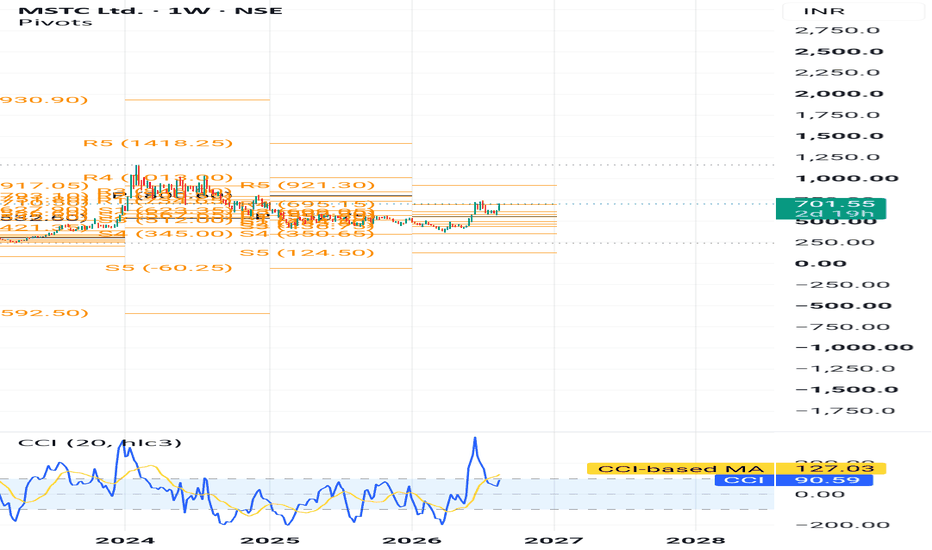
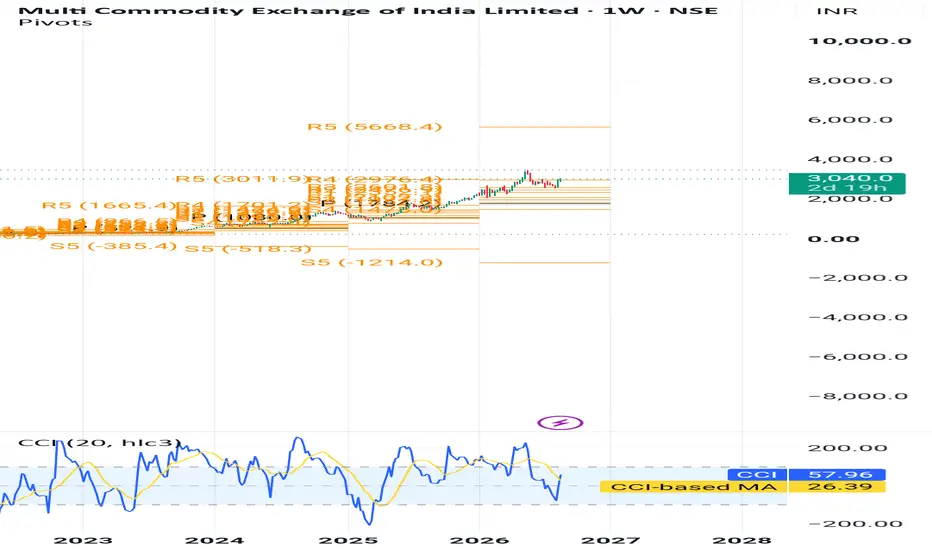
MCX⚙️ STOCK TO WATCH ⚙️
Multi Commodity Exchange of India Ltd. (MCX)
₹2,989–₹3,000 → ₹5,668 👀
India’s largest commodity derivatives exchange appearing on my Weekly R4 Breakout Scanner.
MCX has been seeing strong participation and commodity-derivatives activity, while recent regulatory developments and new product launches add to the growth narrative.
📌 Buy Zone: ₹2,989–₹3,000
📌 Breakout Zone: ₹2,976
🛑 Stop Loss: ₹2,352
🎯 Target: ₹5,668
Why MCX?
📈 Strong earnings growth: Q1 FY27 revenue from operations rose 88% YoY to ₹702 crore, while PAT jumped 103% YoY to ₹413 crore.
🔥 Commodity participation remains strong: MCX benefited from increased commodity derivatives activity, with strong bullion and metals participation.
🌍 Market leadership: MCX describes itself as India's largest commodity derivatives exchange and the world's fourth-largest by number of commodity derivative contracts traded.
🚀 New products: MCX recently introduced crude sunflower oil futures, expanding its commodity product portfolio.
📊 Weekly Camarilla R4 Breakout Setup.
Why It Caught My Attention
✅ Strong Q1 FY27 earnings growth
✅ Dominant commodity-exchange position
✅ Rising trading participation
✅ New product launches
✅ Regulatory tailwinds
✅ Weekly R4 Momentum Breakout
⚠️ High Risk – High Reward Setup. Always follow strict stop-loss and disciplined position sizing.
📢 Disclaimer: This content is for educational purposes only and not investment advice. Please do your own due diligence before making any investment decisions.
Risk Defined. Reward Visible.
© 20K Microcap Investing | R4 Momentum Desk
#MCX #MultiCommodityExchange #CommodityStocks #CommodityTrading #StockMarketIndia #IndianStocks #StocksToWatch #R4Breakout #MomentumInvesting #20KMicrocap  Long
Long
 Long
Long
 Long
Long
 Long
Long
 Long
Long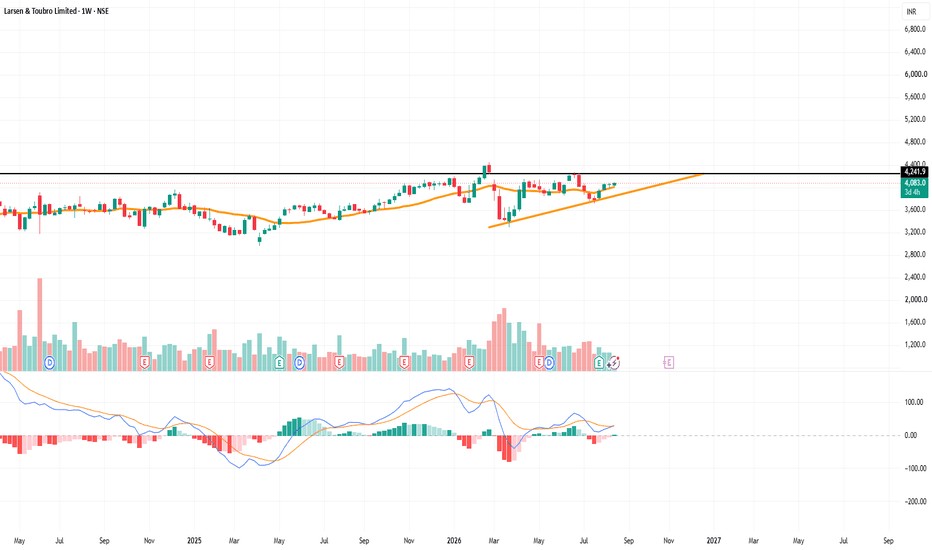
CERA IS Stuck In Loop No Fresh Long Made Here ## CERA Sanitaryware – Business Model
**CERA Sanitaryware Limited** is an Indian building-materials company focused on bathroom and home solutions. Its business model combines **in-house manufacturing, outsourcing, distribution, premiumization and brand-led retail expansion**. The company was established in 1980 and has expanded from sanitaryware into faucets, tiles, bathroom accessories and wellness products. ( )
### 1. Core Business Segments
| Segment | Business |
| ------------------------ | ----------------------------------------------------------------------- |
| **Sanitaryware** | Wash basins, water closets, urinals, etc. |
| **Faucetware** | Taps, mixers, showers and related fittings |
| **Tiles** | Ceramic/vitrified tiles and related products |
| **Bathroom Accessories** | Mirrors, accessories and allied bathroom products |
| **Wellness** | Premium showers, steam cubicles, whirlpools and water-massage solutions |
CERA is increasingly positioning itself as a **complete bathroom solutions provider** rather than only a sanitaryware manufacturer. ( )
### 2. Revenue Mix – FY2024-25
CERA's revenue was approximately **₹1,915 crore in FY2024-25**. The broad segment mix was:
* **Sanitaryware:** ~49%
* **Faucetware:** ~39%
* **Tiles:** ~10%
* **Wellness:** ~2%
This indicates that **sanitaryware remains the largest segment, while faucetware has become an increasingly important growth driver.** ( )
### 3. Manufacturing + Outsourcing Model
CERA follows a **hybrid production model**.
**In-house manufacturing**
* Gives the company greater control over quality and product development.
* Particularly important for core sanitaryware and faucetware.
* Faucetware manufacturing capacity was increased to around **4 lakh pieces per month** by FY2024-25. ( )
**Outsourcing**
* Allows CERA to expand its product range without investing in manufacturing capacity for every product.
* Helps the company offer a wider bathroom portfolio while keeping capital requirements relatively flexible.
In FY2024-25, around **43% of revenues came from products manufactured by the company**, while approximately **57% came from outsourced products**, according to the annual report. ( )
### 4. Distribution Model
CERA primarily reaches customers through:
**Manufacturers → Distributors/Dealers → Retailers → Consumers**
It also serves **institutional customers involved in building and construction projects**. ( )
The company has significantly expanded its retail reach, with **24,400+ CERA retail points as of March 2025**, compared with 14,600+ in March 2023. ( )
### 5. Premiumization Strategy
One of the most important elements of CERA's current business model is **premiumization**.
The company is gradually moving from a predominantly price-sensitive product portfolio toward higher-value bathroom solutions.
Its premium portfolio includes brands such as:
* **Senator**
* **Isvea**
* Premium CERA collections
* Wellness products
Premium sanitaryware and faucetware contributed approximately **42.6% of revenues in FY2024-25**. ( )
### 6. Brand-Led Business Model
CERA's major competitive asset is its **brand**.
The company attempts to differentiate itself through:
* Brand trust
* Product quality
* Design
* Innovation
* Water-saving products
* After-sales service
* Premium product positioning
This helps CERA compete on **value rather than only price**. ( )
### 7. Technology as a Competitive Advantage
CERA invests in advanced manufacturing technologies such as:
* Robotic grinding and polishing
* Robotic glazing
* Automatic chrome plating
* 3D prototype printing
* Pressure casting
The objective is to improve **quality consistency, productivity and product innovation**. ( )
### 8. How CERA Makes Money
The basic economic model is:
**Product Design → Manufacturing/Outsourcing → Distribution → Retail → Consumer**
Revenue is generated primarily through the sale of:
**Sanitaryware + Faucetware + Tiles + Bathroom Accessories + Wellness Products**
Margins can improve through:
**Premium products + Better product mix + Manufacturing efficiency + Brand strength + Higher retail penetration**
### 9. Key Growth Drivers
**1. Premiumization**
Increasing contribution from premium sanitaryware and faucets.
**2. Faucetware growth**
Expansion of its own faucet manufacturing capacity.
**3. Retail expansion**
Increasing the number of customer-facing retail outlets.
**4. Complete Bathroom Solution**
Increasing the number of products sold to the same customer/dealer.
**5. Wellness**
Expansion into showers, steam cubicles, whirlpools and water-massage products.
**6. Pan-India penetration**
Reducing dependence on individual regions by expanding its nationwide presence. ( )
### 10. Business Model Strengths
* Strong and established brand
* Large dealer/retailer network
* Wide product portfolio
* Combination of manufacturing and outsourcing
* Increasing premium-product penetration
* Strong presence across India's bathroom-products market
* Growing faucetware business
* Relatively asset-light expansion possible through outsourcing
### 11. Key Risks
* Competition from **Jaquar, Hindware, Parryware and other organised players**
* Competition from unorganised/local manufacturers
* Raw-material and energy-cost volatility
* Real-estate and construction-cycle dependence
* Premiumization may face consumer price sensitivity
* Outsourcing creates dependence on external suppliers
* Demand can be affected by housing and renovation cycles
### 12. Investment Perspective
**CERA's business model can be understood as:**
> **“A branded bathroom-solutions company using a hybrid manufacturing/outsourcing model, supported by a large distribution network and increasingly focused on premiumization.”**
The key long-term opportunity is not simply selling more toilets or faucets. It is **increasing the value of every bathroom through a broader product basket, premium products and wellness solutions.**
**Business Model Scorecard**
| Factor | Assessment |
| ---------------------- | ---------- |
| Brand Strength | ⭐⭐⭐⭐½ |
| Product Portfolio | ⭐⭐⭐⭐⭐ |
| Distribution | ⭐⭐⭐⭐⭐ |
| Premiumization | ⭐⭐⭐⭐½ |
| Manufacturing | ⭐⭐⭐⭐ |
| Growth Potential | ⭐⭐⭐⭐ |
| Competitive Advantage | ⭐⭐⭐⭐ |
| Business Model Quality | **Strong** |
*Figures above primarily reference FY2024-25 disclosures; CERA has subsequently reported FY2025-26 financial information as well, so current valuation/profitability analysis should be done separately.* ( )
TCS Bullish POV Fair Valuation# TCS – Business Model
## 1. Company Overview
Tata Consultancy Services Limited (TCS) is one of the world's largest **IT services, consulting and business solutions companies** and a key company within the Tata Group.
TCS helps large enterprises **transform, modernize and operate their technology and business processes**. Its services cover application development and management, cloud, artificial intelligence, data and analytics, cybersecurity, engineering, consulting, enterprise solutions and business operations. ( )
Unlike an FMCG or consumer company, TCS does not primarily make money by selling physical products. Its most important assets are:
**Human Talent + Technology Expertise + Customer Relationships + Intellectual Property + Delivery Infrastructure**
---
# 2. How TCS Makes Money
TCS follows a **B2B technology-services business model**.
### Basic Business Flow
**Client Business Problem**
↓
**Consulting & Solution Design**
↓
**Technology Implementation**
↓
**Application / Infrastructure Management**
↓
**Managed Services**
↓
**Long-Term Client Relationship**
↓
**Recurring & Project-Based Revenue**
TCS earns revenue by providing technology and business services to large enterprises, governments and other organizations.
---
# 3. Major Business Areas
## A. IT Consulting
TCS helps organizations determine:
* What technology they should adopt
* How to modernize their IT systems
* How to improve business processes
* How to use AI and cloud
* How to reduce technology costs
* How to improve customer experience
Consulting often becomes the starting point for larger technology-transformation contracts.
---
## B. Application Development & Management
TCS develops, modernizes and manages enterprise applications.
Services include:
* Software development
* Application modernization
* Application maintenance
* Enterprise application management
* Legacy-system transformation
* Digital application development
This creates long-term relationships because clients often continue using TCS to maintain and upgrade the systems it helps implement.
---
# 4. Cloud Services
Cloud transformation is a major part of TCS's business.
TCS helps companies:
* Migrate applications to the cloud
* Modernize infrastructure
* Manage cloud environments
* Improve cloud security
* Optimize cloud costs
* Build cloud-native applications
The company works across major cloud ecosystems and combines cloud capabilities with its consulting and industry expertise. ( )
---
# 5. Artificial Intelligence & Data
AI is becoming an increasingly important part of TCS's business model.
Services include:
* Artificial Intelligence
* Generative AI
* Data analytics
* Machine learning
* AI-enabled business transformation
* Enterprise AI
* Intelligent automation
TCS has stated that its strategy is to become an **AI-led technology services company**, embedding AI across its services, operating model and investments. ( )
The important opportunity is that AI can create demand for:
**Data Modernization + Cloud + Application Modernization + AI Implementation + AI Operations**
---
# 6. Cybersecurity
Businesses increasingly require protection against:
* Cyberattacks
* Data theft
* Identity risks
* Cloud security threats
* Regulatory risks
TCS provides cybersecurity services including security transformation, monitoring, identity management and cyber-risk solutions.
Cybersecurity also has strong recurring-revenue characteristics because customers require continuous monitoring and protection.
---
# 7. Enterprise Solutions
TCS helps companies modernize their enterprise systems.
Areas include:
* ERP
* Supply-chain management
* Finance
* Procurement
* Customer management
* Human resources
* Enterprise integration
TCS also develops industry-specific solutions and platforms to accelerate enterprise transformation. ( )
---
# 8. Engineering & Digital Engineering
TCS provides engineering services to companies developing physical and digital products.
Areas include:
* Product engineering
* Internet of Things
* Embedded systems
* Connected products
* Smart manufacturing
* Electric vehicles
* Digital engineering
This allows TCS to participate in the technology transformation of manufacturing and other industrial sectors.
---
# 9. Business Process Services
TCS does not only manage technology. It also helps clients operate business processes.
Examples include:
* Finance & accounting
* Human resources
* Customer service
* Procurement
* Supply chain
* Business operations
This creates opportunities for **long-term managed-service contracts**.
---
# 10. Industry-Based Business Model
TCS organizes its go-to-market approach primarily around industry verticals rather than simply selling generic IT services.
Major industry groups include:
### BFSI
Banking, Financial Services & Insurance
### Consumer Business
Retail, consumer products and related businesses
### Communication, Media & Technology
### Life Sciences & Healthcare
### Manufacturing
### Others
Including:
* Energy
* Resources
* Utilities
* Public services
* Other industries
This industry specialization helps TCS understand the specific technology and business requirements of each sector. ( )
---
# 11. Revenue Model
TCS generates revenue through several types of engagements.
### Project-Based Revenue
Clients pay TCS for specific technology projects.
Examples:
* ERP implementation
* Cloud migration
* Application modernization
* Digital transformation
### Time & Material Model
Revenue is linked to:
* Number of employees
* Hours worked
* Skills required
* Project duration
### Managed Services
TCS manages a client's IT or business operations for an agreed period.
This can provide recurring revenue.
### Long-Term Contracts
Large enterprises often sign multi-year contracts with TCS.
These contracts provide:
**Revenue Visibility + Customer Stickiness + Recurring Business**
---
# 12. Customer Relationship Model
One of TCS's biggest strengths is its ability to develop **long-term relationships with large global companies**.
The relationship often evolves as:
**Small Project**
↓
**Large Transformation Project**
↓
**Multiple Technology Services**
↓
**Managed Services**
↓
**Strategic Technology Partnership**
This increases the company's **share of wallet** within existing customers. TCS specifically highlights deeper customer relationships and increased service intensity as important elements of its strategy. ( )
---
# 13. Global Delivery Model
TCS uses a globally distributed delivery model.
Work can be performed through:
* India-based delivery centers
* Global delivery centers
* Client locations
* Distributed technology teams
This model allows TCS to combine:
**Indian Talent Cost Advantage + Global Client Presence**
It can therefore deliver technology services at competitive costs while maintaining global scale.
---
# 14. Human Capital – The Core Asset
Unlike a manufacturing company, TCS's most important asset is its workforce.
The company depends on:
* Software engineers
* Data scientists
* AI specialists
* Cloud professionals
* Cybersecurity experts
* Consultants
* Project managers
* Industry specialists
Therefore:
**More Skilled Employees → More Delivery Capacity → More Projects → More Revenue**
However, TCS must continuously train employees because technology changes rapidly.
---
# 15. Intellectual Property
TCS increasingly supplements manpower-based services with:
* Proprietary platforms
* Software products
* Industry solutions
* Automation tools
* AI solutions
* Cloud solutions
Examples include platforms such as **TCS BaNCS, TCS iON, ignio and TCS Crystallus**. ( )
This is strategically important because proprietary platforms can increase productivity and differentiate TCS from pure manpower-based IT vendors.
---
# 16. Key Competitive Advantages
### 1. Tata Brand
TCS benefits from the reputation and global presence of the Tata Group.
### 2. Global Customer Base
TCS serves many of the world's largest enterprises.
### 3. Scale
Large scale provides advantages in:
* Talent
* Delivery
* Technology investment
* Training
* Sales
* Research
### 4. Deep Domain Knowledge
TCS combines technology expertise with industry-specific knowledge.
### 5. Long-Term Contracts
Long customer relationships provide revenue visibility.
### 6. Global Delivery Model
India-based delivery provides cost efficiency while global centers provide proximity to clients.
### 7. Strong Balance Sheet
The business is relatively asset-light compared with manufacturing companies and historically generates substantial cash.
---
# 17. Geographic Business Model
TCS has a global presence across:
* North America
* Latin America
* United Kingdom
* Continental Europe
* Asia Pacific
* India
* Middle East & Africa
North America is its largest market, while Europe and other regions provide additional diversification. ( )
This geographic diversification reduces dependence on a single economy, although TCS remains exposed to global technology spending cycles.
---
# 18. Cost Structure
TCS's major costs include:
* Employee salaries
* Employee training
* Technology infrastructure
* Subcontracting
* Sales and marketing
* Travel
* Research and development
* Delivery centers
* Administrative expenses
Employee costs are the largest structural cost because TCS is fundamentally a knowledge-based business.
---
# 19. Operating Leverage
TCS can generate operating leverage when revenue grows faster than employee and other operating costs.
### Example:
**Revenue Growth**
↓
**Higher Utilization**
↓
**Better Employee Productivity**
↓
**Operating Margin Improvement**
However, excessive salary inflation or weak demand can put pressure on margins.
---
# 20. Utilization & Employee Productivity
Two important metrics for an IT-services company are:
### Utilization
Percentage of employees engaged in revenue-generating work.
Higher utilization generally means better utilization of available talent.
### Revenue Per Employee
Measures how much revenue is generated per employee.
Improving:
**Automation + AI + Productivity + Higher-Value Services**
can potentially increase revenue generated per employee.
---
# 21. Growth Drivers
### AI & Generative AI
Companies are increasing investment in AI transformation.
### Cloud Adoption
Businesses continue moving infrastructure and applications toward cloud platforms.
### Digital Transformation
Companies need to modernize legacy systems.
### Cybersecurity
Growing cyber threats increase demand for security services.
### Data & Analytics
Organizations increasingly depend on data for decision-making.
### Enterprise Modernization
Legacy technology systems require modernization.
### Outsourcing
Companies continue outsourcing non-core technology and business functions to specialized providers.
---
# 22. Major Risks
### 1. Global Economic Slowdown
Companies may postpone technology spending during economic uncertainty.
### 2. US Market Dependency
A large proportion of TCS revenue comes from North America, making US technology spending important.
### 3. Employee Attrition
Loss of skilled employees can increase recruitment and training costs.
### 4. Wage Inflation
Higher employee compensation can pressure margins.
### 5. AI Disruption
AI can automate some traditional IT services, potentially reducing demand for certain manpower-intensive activities.
However, AI can simultaneously create new demand for AI implementation, cloud, data and modernization services.
### 6. Currency Fluctuations
A significant portion of TCS's revenue is generated outside India, creating foreign-exchange exposure.
### 7. Competition
TCS competes with:
* Infosys
* HCLTech
* Wipro
* Accenture
* Cognizant
* Capgemini
* IBM
* Other global and regional technology companies
---
# 23. TCS Business Model – Simplified
| Component | TCS |
| ------------------------ | ------------------------------------------------------------------- |
| **Industry** | IT Services & Technology Consulting |
| **Business Model** | B2B |
| **Core Revenue** | IT Services, Consulting & Business Solutions |
| **Major Services** | Cloud, AI, Data, Cybersecurity, Applications, Engineering |
| **Customers** | Large Enterprises, Governments & Institutions |
| **Revenue Model** | Projects + Time & Material + Managed Services + Long-Term Contracts |
| **Key Asset** | Human Capital & Intellectual Property |
| **Geography** | Global |
| **Largest Market** | North America |
| **Key Strength** | Scale + Talent + Client Relationships |
| **Major Growth Drivers** | AI, Cloud, Digital Transformation, Cybersecurity |
| **Major Risks** | Economic Slowdown, Wage Inflation, Attrition, AI Disruption |
---
# 24. TCS Business Model in One Line
**TCS follows a global B2B technology-services model in which it combines skilled talent, industry expertise, proprietary platforms and technology capabilities to help large enterprises transform, modernize and manage their technology and business operations through project-based and recurring long-term contracts.**
## Investment Perspective
TCS can be viewed as a **high-quality, asset-light technology-services business** where the fundamental growth equation is:
**Global IT Spending**
* **Digital Transformation**
* **Cloud Adoption**
* **AI & GenAI**
* **Cybersecurity**
* **Enterprise Modernization**
* **Outsourcing**
TCS's FY2025-26 investor information reports approximately **US$30 billion revenue, US$40.7 billion total contract value, 25% operating margin and 19.8% net margin**, highlighting the scale and profitability of the business. ( )
The key metrics to monitor are **revenue growth, order book/TCV, operating margin, utilization, attrition, revenue per employee, large-deal wins, free cash flow and growth in AI/cloud-related services**.
 Long
Long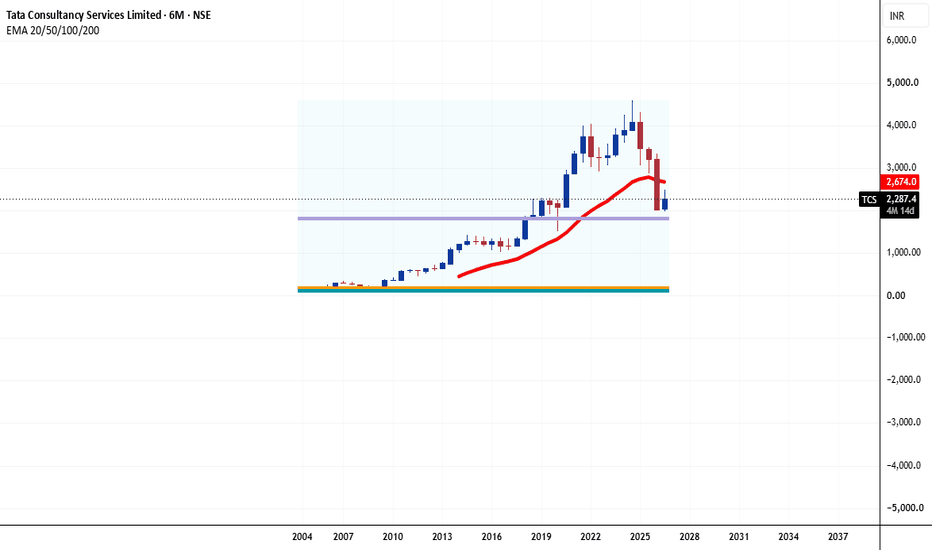
Bullish View at This Price POV below 2K # Hindustan Unilever Limited (HUL) – Business Model
## 1. Company Overview
Hindustan Unilever Limited (HUL) is one of India's largest **FMCG (Fast-Moving Consumer Goods)** companies and a subsidiary of the global Unilever Group.
HUL operates across everyday consumer categories such as **beauty and personal care, home care, foods, refreshments and consumer health-related products**.
Its business model is built around:
**Strong Brands + Mass Distribution + High Product Penetration + Repeat Consumption**
Because most HUL products are used regularly, the company benefits from **frequent purchases and recurring consumer demand**.
---
# 2. Major Business Categories
HUL operates across several major FMCG categories.
### A. Beauty & Personal Care
Products include:
* Skin care
* Hair care
* Oral care
* Personal washing
* Deodorants
* Beauty products
Important brands include:
* Dove
* Lux
* Lifebuoy
* Clinic Plus
* Sunsilk
* TRESemmé
* Pond's
* Lakmé
* Vaseline
---
## B. Home Care
HUL has a strong presence in household cleaning products.
Major categories include:
* Laundry detergents
* Fabric care
* Dishwashing
* Household cleaning
* Surface cleaners
* Water purification
Major brands include:
* Surf Excel
* Rin
* Comfort
* Vim
* Domex
* Cif
---
## C. Foods & Refreshments
HUL participates in several food and beverage categories.
Products include:
* Tea
* Coffee
* Ice cream
* Foods and condiments
* Nutrition-related products
Major brands include:
* Brooke Bond
* Bru
* Kissan
* Horlicks
* Kwality Wall's
---
# 3. How HUL Makes Money
HUL follows a **high-volume, repeat-purchase FMCG business model**.
### Basic Business Flow
**Raw Materials**
↓
**Manufacturing / Sourcing**
↓
**Brand Development**
↓
**Marketing & Advertising**
↓
**Distributors**
↓
**Retailers / E-commerce**
↓
**Consumers**
↓
**Repeat Purchase**
The company earns revenue primarily by selling branded consumer products through a large distribution ecosystem.
---
# 4. Why HUL's Business Model Is Powerful
The key strength of HUL is that its products are used frequently.
For example:
**Morning → Toothpaste / Personal Care**
**Breakfast → Tea / Coffee / Food Products**
**Laundry → Detergent**
**Bathing → Soap / Personal Care**
**House Cleaning → Home Care Products**
This creates a business model based on **high consumption frequency and repeat purchases**.
Unlike automobiles or electronics, consumers do not purchase HUL products once every several years. Many products are purchased **weekly or monthly**.
---
# 5. Customer Segments
HUL serves almost every major consumer segment in India.
### Rural Consumers
HUL has extensive penetration in rural India through its distribution network.
### Urban Consumers
Urban households are an important market for premium personal care, home care and food products.
### Mass-Market Consumers
Affordable products address price-sensitive consumers.
### Premium Consumers
Premium brands and higher-value products target consumers looking for:
* Better quality
* Premium ingredients
* Convenience
* Lifestyle benefits
---
# 6. Brand-Led Business Model
One of HUL's biggest competitive advantages is its **portfolio of powerful brands**.
Instead of selling generic products, HUL invests heavily in:
* Advertising
* Brand building
* Product innovation
* Consumer research
* Packaging
* Distribution
This creates consumer loyalty and allows the company to charge a premium for certain products.
### Example
A consumer may purchase detergent based on:
**Brand Trust → Product Performance → Habit → Repeat Purchase**
This creates significant competitive advantages for established FMCG companies.
---
# 7. Distribution Model
Distribution is one of HUL's most important strengths.
The company reaches consumers through:
* Distributors
* Wholesalers
* Kirana stores
* Supermarkets
* Modern retail
* E-commerce
* Quick commerce
* Institutional channels
The distribution network allows HUL to reach both:
**Metro Cities + Small Towns + Rural Markets**
---
# 8. Rural Distribution
Rural India is particularly important for HUL.
The company has historically invested heavily in rural distribution through initiatives designed to increase product availability in villages and smaller markets.
The rural opportunity comes from:
* Rising rural income
* Increasing consumption
* Better distribution infrastructure
* Increasing smartphone penetration
* Greater brand awareness
However, rural demand can be sensitive to:
* Monsoon
* Agricultural income
* Inflation
* Rural employment
* Commodity prices
---
# 9. Urban Distribution
Urban consumers provide significant opportunities for premiumization.
Urban consumers increasingly demand:
* Premium skincare
* Personal grooming
* Health-conscious products
* Convenient food products
* Premium detergents
* Specialized household products
This allows HUL to increase its **average revenue per consumer**.
---
# 10. Premiumization Strategy
Premiumization is an important growth strategy.
The company attempts to move consumers from:
**Basic Product → Better Product → Premium Product**
For example:
A consumer may move from a basic soap to a premium personal-care product.
Premium products generally provide:
* Higher selling price
* Better margins
* Higher brand value
* Increased consumer engagement
Therefore:
**Premiumization → Higher Revenue per Unit → Potential Margin Expansion**
---
# 11. Product Innovation
HUL continuously introduces new products and improves existing products.
Innovation can involve:
* New formulations
* New fragrances
* New packaging
* New product formats
* Health-oriented products
* Premium products
* Convenience products
* Environment-friendly products
Product innovation helps HUL respond to changing consumer preferences.
---
# 12. Advertising & Marketing
Advertising is a critical part of HUL's business model.
The company invests significantly in:
* Television advertising
* Digital marketing
* Social media
* Influencer marketing
* Celebrity endorsements
* In-store promotions
* Consumer campaigns
The objective is to maintain:
**Brand Awareness + Consumer Loyalty + Market Share**
Strong brands create an entry barrier for new competitors.
---
# 13. Manufacturing Model
HUL uses a combination of:
* Company-operated manufacturing
* Third-party manufacturing
* Contract manufacturing
* Strategic suppliers
* Local sourcing
This allows the company to optimize:
* Manufacturing costs
* Capacity utilization
* Product availability
* Supply-chain efficiency
---
# 14. Raw Materials
HUL's products require a wide range of raw materials.
Important inputs include:
* Palm oil
* Crude-oil derivatives
* Packaging materials
* Chemicals
* Milk-related inputs
* Tea
* Coffee
* Agricultural commodities
Therefore, commodity inflation can significantly influence profitability.
### Example
**Higher Input Costs**
↓
**Higher Manufacturing Cost**
↓
**Margin Pressure**
Unless HUL can offset the increase through:
* Price increases
* Cost savings
* Premiumization
* Product mix improvement
---
# 15. Pricing Power
HUL benefits from strong brands and therefore has some ability to pass higher costs to consumers.
However, pricing power is not unlimited.
If prices increase too aggressively:
**Higher Price → Lower Volume → Consumers Shift to Cheaper Alternatives**
Therefore, HUL needs to balance:
**Price Growth + Volume Growth + Market Share**
---
# 16. E-Commerce & Quick Commerce
Consumer buying behaviour is changing rapidly.
HUL increasingly participates through:
* E-commerce
* Quick-commerce platforms
* Digital marketplaces
* Direct-to-consumer channels
Quick commerce is particularly important for FMCG because consumers increasingly purchase everyday products through fast-delivery platforms.
This creates both:
### Opportunity
Higher consumer accessibility and faster product discovery.
### Risk
Higher promotional requirements and changing channel economics.
---
# 17. Competitive Advantages
### 1. Strong Brands
HUL has a large portfolio of well-known consumer brands.
### 2. Distribution Network
Its extensive distribution network creates high barriers to entry.
### 3. Scale
Large volumes provide advantages in:
* Procurement
* Manufacturing
* Advertising
* Distribution
### 4. Consumer Understanding
Decades of consumer research provide deep knowledge of Indian consumption patterns.
### 5. Product Portfolio
HUL operates across numerous everyday-use categories.
### 6. Pricing Power
Strong brands can provide some ability to pass input-cost inflation to consumers.
---
# 18. HUL's Economic Moat
HUL's business has several characteristics of a strong consumer-company moat:
**Brand Loyalty**
*
**Distribution Reach**
*
**Scale**
*
**Consumer Habit**
*
**Advertising Strength**
*
**Product Innovation**
Together, these factors make it difficult for smaller companies to replicate HUL's overall market position.
---
# 19. Revenue Growth Drivers
HUL's growth can broadly come from:
### Volume Growth
More products sold.
### Price Growth
Higher prices.
### Premiumization
Consumers purchasing higher-value products.
### Market Expansion
Increasing penetration in rural and underdeveloped markets.
### New Products
Launching products in emerging categories.
### Market Share Gains
Taking customers from competitors.
### Digital Channels
Growth through e-commerce and quick commerce.
---
# 20. Cost Structure
Major costs include:
* Raw materials
* Packaging
* Manufacturing
* Employee costs
* Advertising
* Distribution
* Logistics
* Warehousing
* Research & development
* Trade promotions
Among these, **raw-material costs and advertising/marketing expenses** are particularly important.
---
# 21. Major Risks
### 1. Commodity Inflation
Higher palm oil, crude-linked inputs, packaging and agricultural commodity prices can pressure margins.
### 2. Competition
HUL competes with:
* Indian FMCG companies
* Multinational FMCG companies
* Regional brands
* Private labels
* Digital-first brands
### 3. Rural Slowdown
Weak rural income can reduce FMCG consumption.
### 4. Consumer Downtrading
During inflationary periods, consumers may move from premium products toward cheaper alternatives.
### 5. Regulatory Changes
Changes in taxation, product regulations or environmental rules can affect operations.
### 6. Changing Consumer Preferences
Consumers increasingly demand:
* Healthier products
* Natural ingredients
* Sustainable products
* Convenience
* Premium experiences
HUL must continuously adapt.
---
# 22. HUL Business Model – Simplified
| Component | HUL |
| ------------------------ | ----------------------------------------------------------------- |
| **Industry** | FMCG |
| **Core Business** | Consumer Products |
| **Major Categories** | Beauty & Personal Care, Home Care, Foods & Refreshments |
| **Revenue Model** | Product Sales |
| **Customers** | Mass Market + Premium Consumers |
| **Distribution** | Distributors, Retailers, Modern Trade, E-commerce, Quick Commerce |
| **Key Strength** | Brands + Distribution + Scale |
| **Major Growth Drivers** | Volume, Premiumization, Rural Growth, Innovation |
| **Major Costs** | Raw Materials, Advertising, Manufacturing, Distribution |
| **Major Risks** | Commodity Inflation, Competition, Rural Slowdown |
| **Business Nature** | High-Volume, Repeat-Purchase |
---
# 23. Business Model in One Line
**HUL operates a brand-led, high-volume FMCG business model in which strong consumer brands are manufactured and distributed through an extensive multi-channel network, generating recurring revenue from frequent purchases across India's urban and rural markets.**
## Investment Perspective
HUL can be viewed as a **defensive, brand-led consumer business** with a strong distribution network and recurring demand.
Its long-term growth equation can be simplified as:
**Population Growth**
* **Rising Income**
* **Higher Consumption**
* **Premiumization**
* **Rural Penetration**
* **Market Share Gains**
* **New Product Categories**
The key metrics to monitor are **volume growth, revenue growth, EBITDA margin, rural versus urban demand, premiumization, market share, raw-material costs and free cash flow**.
The biggest structural advantage of HUL is that it participates in **everyday consumption**, making its business relatively resilient compared with highly cyclical industries.
 Long
Long
OBEROI REALTYOberoi Realty Ltd. (CMP ₹1,931.00, NSE: OBEROIRLTY)
The SmartWay Research Desk | 18 August 2026
A Mumbai‑based real estate developer, incorporated in 1998. Oberoi Realty is one of India’s leading luxury and premium real estate companies, with projects spanning residential, commercial, retail, and hospitality segments, primarily in Mumbai and expanding into other metros.
FY22–FY26 Snapshot
Revenue Growth: FY26 revenue ₹4,842 Cr vs ₹4,212 Cr in FY25 (+15.0% YoY). → Good
Net Profit: FY26 PAT ₹1,212 Cr vs ₹1,042 Cr in FY25 (+16.3% YoY). → Good
Operating Margin: FY26 EBITDA ₹1,812 Cr, margin 37.4% vs 36.8% last year (+60 bps). → Good
Equity Capital: Stable, face value ₹10. → Good
Dividend Policy: Dividend ₹8.00/share declared for FY26. → Good
Asset Building: Investments in luxury residential towers, malls, and hotels. → Good
Sales: Strong demand from Mumbai luxury housing and commercial leasing. → Good
Expense: Land acquisition and construction costs remain high. → Neutral/Good
EPS: FY26 EPS ₹33.25 vs ₹28.60 last year (+16.2%). → Good
Institutional Interest & Ownership Trends (Mar 2026)
Promoter Holding: ~67.7% (no pledges)
FII Holding: ~14.2%
DII Holding: ~12.1%
Retail & Others: ~6.0%
Strategic Moves & Innovations
Expansion in luxury residential projects in Goregaon, Worli, and Thane.
Focus on commercial leasing and retail malls.
Partnerships with global hospitality brands for premium hotels.
Diversification into mixed‑use developments and township projects.
Cash Flow & Balance Sheet Strength
Market cap ~₹70,200 Cr.
Debt‑to‑equity ratio ~0.38 (moderate leverage).
Book value per share ₹412.00; P/B ~4.7.
EPS (TTM) ₹33.25; P/E ~58.0.
Risk Factors
High P/E ratio ~58.0, valuations expensive.
Dependence on Mumbai real estate demand cycles.
Exposure to regulatory approvals and RERA compliance.
Competition from DLF, Godrej Properties, and Prestige Estates.
Investor Takeaway
Oberoi Realty has delivered steady FY26 performance, supported by luxury housing demand, commercial leasing, and hospitality expansion. With strong promoter backing, dividend payouts, and leadership in premium Mumbai real estate, Oberoi Realty remains a large‑cap real estate play. At CMP ₹1,931.00, valuations are expensive (P/E ~58.0, P/B ~4.7), reflecting growth expectations but also sectoral risks.  Long
Long
Long 
Long 
 Long
Long
 Long
Long
Avt Natural ⚙️ STOCK TO WATCH ⚙️
AVT Natural Products Ltd.
₹84 → ₹139 → ₹191 👀
A vertically integrated natural-ingredients company appearing on my Weekly R4 Breakout Scanner. AVT Natural serves food & beverage, animal nutrition, nutraceutical, cosmetics and personal-care markets with plant-based extracts and natural ingredient solutions.
📌 Buy Zone: ₹84
📌 Breakout Zone: ₹84
🛑 Stop Loss: ₹67
🎯 Target 1: ₹139
🎯 Target 2: ₹191
Why AVT Natural?
🌱 Natural ingredients play: Plant extracts and botanical solutions across food, beverage, animal health, cosmetics and crop science.
🌍 Global presence: Operations and sales reach markets across India, Europe, North America, Mexico and the UAE.
🏭 Vertical integration: The company processes around 70,000 tonnes of plant material and 5,000 tonnes of plant extracts annually through two manufacturing facilities.
🔥 Fresh earnings momentum: Q1 FY27 revenue was reported at about ₹241 crore, up 82% YoY, while PAT rose to around ₹31 crore, up sharply YoY.
📊 Weekly Camarilla R4 Breakout Setup.
Why It Caught My Attention
✅ Strong natural-ingredients theme
✅ Global food & nutrition exposure
✅ Vertical integration advantage
✅ Strong Q1 FY27 growth
✅ Weekly R4 Momentum Breakout
⚠️ High Risk – High Reward Setup. Always follow strict stop-loss and disciplined position sizing.
📢 Disclaimer: This content is for educational purposes only and not investment advice. Please do your own due diligence before making any investment decisions.
Risk Defined. Reward Visible.
© 20K Microcap Investing | R4 Momentum Desk
#AVTNatural #NaturalIngredients #FoodIngredients #AnimalNutrition #Nutraceuticals #FMCG #StockMarketIndia #IndianStocks #StocksToWatch #R4Breakout #MomentumInvesting #20KMicrocap  Long
Long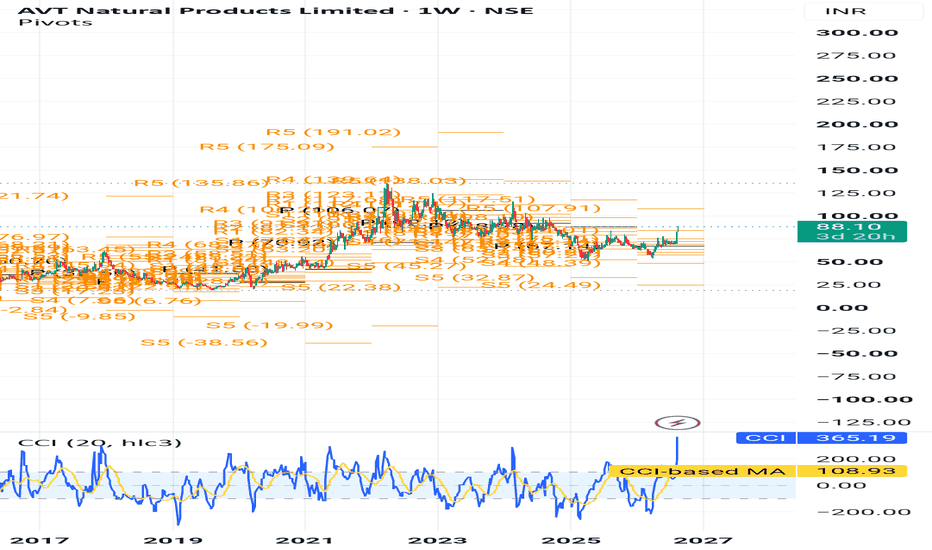
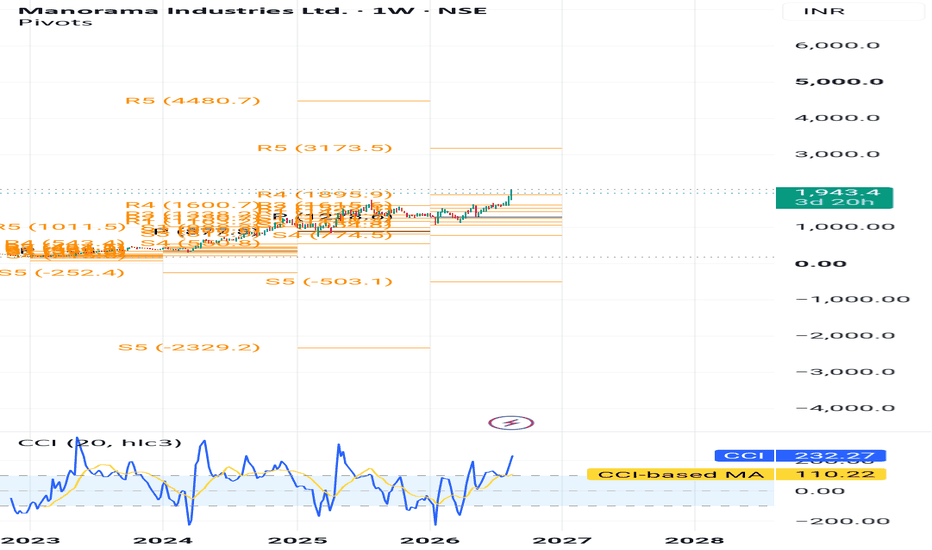
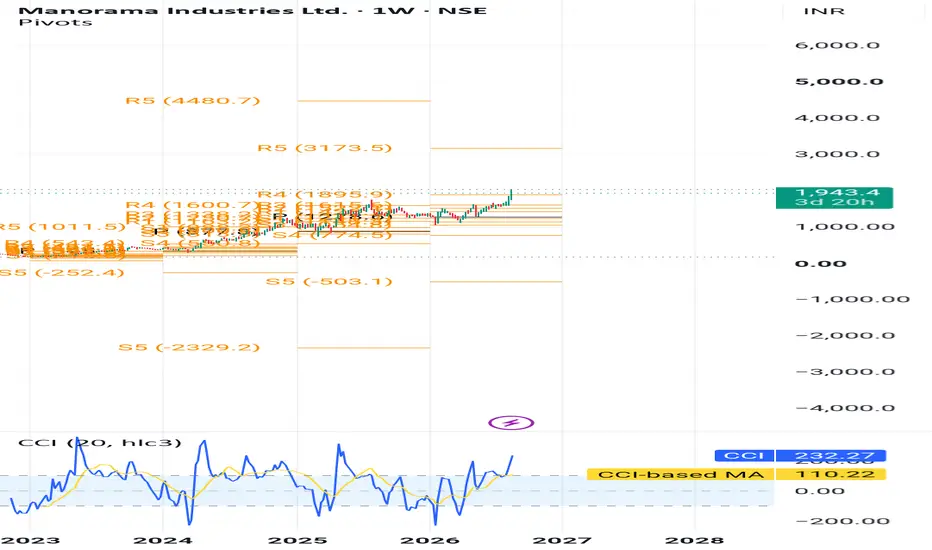
Manorama Industries ⚙️ STOCK TO WATCH ⚙️
Manorama Industries Ltd.
₹1,900–₹1,920 → ₹3,173 → ₹4,480 👀
A specialty fats and ingredients company appearing on my Weekly R4 Breakout Scanner.
📌 Buy Zone: ₹1,900–₹1,920
📌 Breakout Zone: ₹1,893
🛑 Stop Loss: ₹1,522
🎯 Target 1: ₹3,173
🎯 Target 2: ₹4,480
Why Manorama Industries?
🧈 A key player in specialty fats and cocoa-butter equivalents, serving chocolate, confectionery, food and cosmetics applications.
🌍 Global demand and increasing value-added product contribution remain important growth drivers.
📈 Q1 FY27 revenue rose 39.5% YoY to ₹404 crore, while consolidated net profit jumped 67.6% YoY to ₹78 crore.
🔥 The stock gained over 8% following the Q1 results, moving close to its 52-week high, highlighting strong market momentum.
🚀 Management has been targeting volume-led growth and higher utilisation of expanded capacity, with increasing contribution from value-added products.
📊 Weekly Camarilla R4 Breakout Setup.
Why It Caught My Attention
✅ Strong Q1 FY27 earnings momentum
✅ Specialty fats & ingredients theme
✅ Global demand exposure
✅ Value-added product expansion
✅ Strong post-results price momentum
✅ Weekly R4 Momentum Breakout
⚠️ High Risk – High Reward Setup. Always follow strict stop-loss and disciplined position sizing.
📢 Disclaimer: This content is for educational purposes only and not investment advice. Please do your own due diligence before making any investment decisions.
Risk Defined. Reward Visible.
© 20K Microcap Investing | R4 Momentum Desk
#ManoramaIndustries #SpecialtyFats #CocoaButter #FoodIngredients #FMCG #StockMarketIndia #IndianStocks #StocksToWatch #R4Breakout #MomentumInvesting #20KMicrocap  Long
Long