Symmetrical Triangle Breakout Setup 📈 Symmetrical Triangle Breakout Setup NSE:COHANCE
After a sharp decline from the higher levels, price formed a significant bottom around the 280–300 zone and subsequently staged a strong recovery toward 480–510.
Price is now consolidating inside a symmetrical triangle, characterized by:
Lower highs forming a descending resistance trendline.
Higher lows forming an ascending support trendline.
Gradually narrowing price action, indicating compression and a potential volatility expansion.
The pattern is developing after a strong upward recovery, making an upside continuation breakout a possibility.
🔑 Key Levels
Resistance / Breakout Zone
The upper triangle trendline currently converges around 480–510, with the major horizontal resistance near 510–532.
Support:
The rising triangle support is currently around 390–410.
Current Price:
Approximately 476at the time of analysis.
🚀 Bullish Scenario
A convincing candle close above the triangle's upper trendline, preferably accompanied by increased volume, would provide confirmation of an upside breakout.
The first important hurdle is the 510–532 resistance zone. A successful break and close above this area could open the way toward higher levels.
A measured-move target can be estimated by taking the maximum height of the triangle and projecting it upward from the breakout point.
⚠️ Bearish / Invalidating Scenario
If price fails to break the upper trendline and instead breaks below the ascending support trendline*, the bullish setup would weaken.
A sustained move below approximately **390–400** would invalidate the immediate bullish triangle thesis and could lead to a deeper retracement.
📊 Volume Confirmation
Volume is an important factor for this setup. Ideally:
Triangle consolidation → declining/normalizing volume → breakout → volume expansion
An upside breakout without meaningful volume should be treated cautiously because it may represent a false breakout.
🎯 Trade Approach
Rather than entering solely because price is inside the triangle, wait for confirmation:
Bullish entry: Breakout + candle close above resistance
Confirmation: Increased volume / successful retest
Stop-loss: Below the breakout structure or below the most recent higher low
Targets: Previous resistance levels followed by the measured-move projection
📝 Conclusion
The chart is currently showing a symmetrical triangle after a strong bullish recovery. The compression between lower highs and higher lows suggests that a larger move may be approaching.
The key level to watch is the upper trendline and 510–532 resistance zone. A confirmed breakout with strong volume would strengthen the bullish case, while a breakdown below the rising support would invalidate the setup.
Wait for confirmation — don't treat the pattern itself as a guaranteed breakout.
This is a technical-analysis observation, not financial advice. Always manage risk according to your own trading plan.
 Long
Long
 Long
Long
 Long
Long
ETERNAL LTD S/R
Support and Resistance Levels:
Support Levels: These are price points (green line/shade) where a downward trend may be halted due to a concentration of buying interest. Imagine them as a safety net where buyers step in, preventing further decline.
Resistance Levels: Conversely, resistance levels (red line/shade) are where upward trends might stall due to increased selling interest. They act like a ceiling where sellers come in to push prices down.
Breakouts:
Bullish Breakout: When the price moves above resistance, it often indicates strong buying interest and the potential for a continued uptrend. Traders may view this as a signal to buy or hold.
Bearish Breakout: When the price falls below support, it can signal strong selling interest and the potential for a continued downtrend. Traders might see this as a cue to sell or avoid buying.
MA Ribbon (EMA 20, EMA 50, EMA 100, EMA 200) :
Above EMA: If the stock price is above the EMA, it suggests a potential uptrend or bullish momentum.
Below EMA: If the stock price is below the EMA, it indicates a potential downtrend or bearish momentum.
Trendline: A trendline is a straight line drawn on a chart to represent the general direction of a data point set.
Uptrend Line: Drawn by connecting the lows in an upward trend. Indicates that the price is moving higher over time. Acts as a support level, where prices tend to bounce upward.
Downtrend Line: Drawn by connecting the highs in a downward trend. Indicates that the price is moving lower over time. It acts as a resistance level, where prices tend to drop.
Disclaimer:
I am not SEBI registered. The information provided here is for learning purposes only and should not be interpreted as financial advice. Consider the broader market context and consult with a qualified financial advisor before making investment decisions. BALRAMPUR CHINI S/R
Support and Resistance Levels:
Support Levels: These are price points (green line/shade) where a downward trend may be halted due to a concentration of buying interest. Imagine them as a safety net where buyers step in, preventing further decline.
Resistance Levels: Conversely, resistance levels (red line/shade) are where upward trends might stall due to increased selling interest. They act like a ceiling where sellers come in to push prices down.
Breakouts:
Bullish Breakout: When the price moves above resistance, it often indicates strong buying interest and the potential for a continued uptrend. Traders may view this as a signal to buy or hold.
Bearish Breakout: When the price falls below support, it can signal strong selling interest and the potential for a continued downtrend. Traders might see this as a cue to sell or avoid buying.
MA Ribbon (EMA 20, EMA 50, EMA 100, EMA 200) :
Above EMA: If the stock price is above the EMA, it suggests a potential uptrend or bullish momentum.
Below EMA: If the stock price is below the EMA, it indicates a potential downtrend or bearish momentum.
Trendline: A trendline is a straight line drawn on a chart to represent the general direction of a data point set.
Uptrend Line: Drawn by connecting the lows in an upward trend. Indicates that the price is moving higher over time. Acts as a support level, where prices tend to bounce upward.
Downtrend Line: Drawn by connecting the highs in a downward trend. Indicates that the price is moving lower over time. It acts as a resistance level, where prices tend to drop.
Disclaimer:
I am not SEBI registered. The information provided here is for learning purposes only and should not be interpreted as financial advice. Consider the broader market context and consult with a qualified financial advisor before making investment decisions.  Long
Long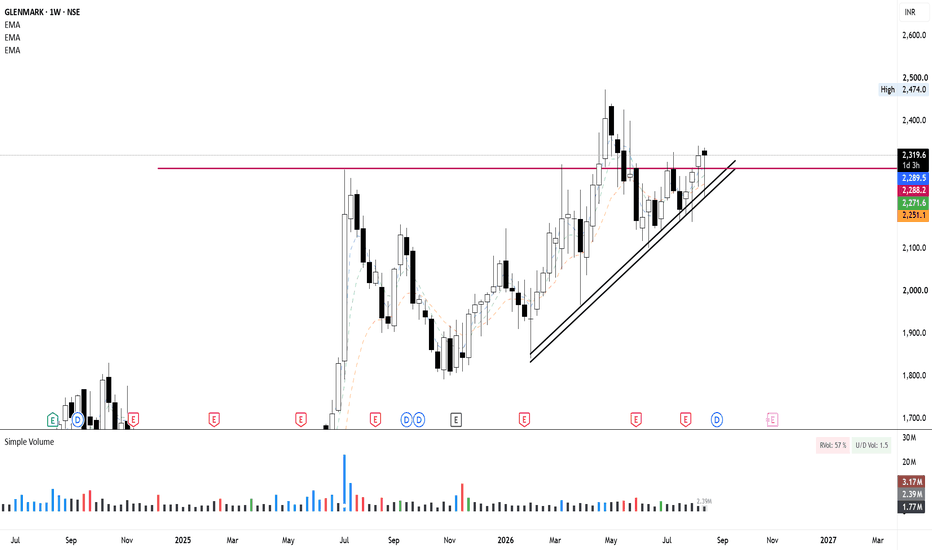
 Education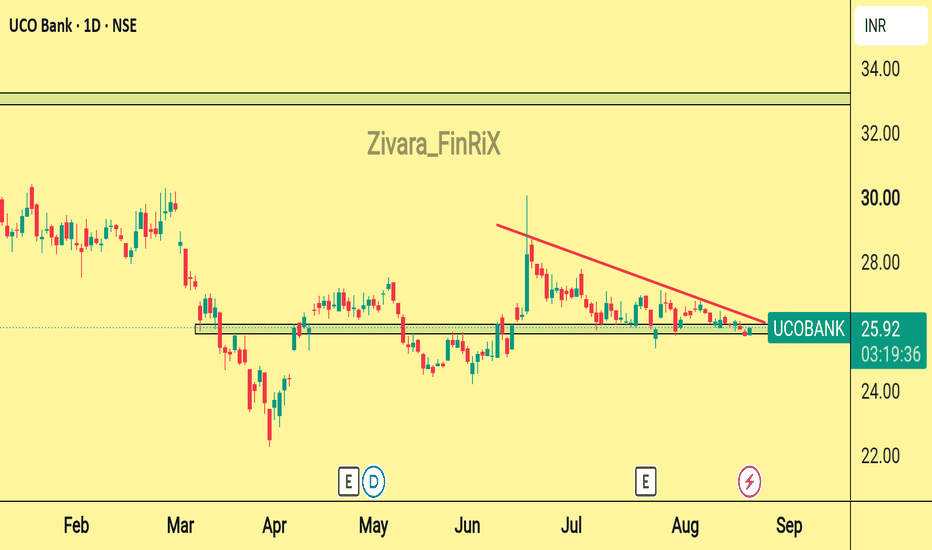
ACME SOLAR S/R
Support and Resistance Levels:
Support Levels: These are price points (green line/shade) where a downward trend may be halted due to a concentration of buying interest. Imagine them as a safety net where buyers step in, preventing further decline.
Resistance Levels: Conversely, resistance levels (red line/shade) are where upward trends might stall due to increased selling interest. They act like a ceiling where sellers come in to push prices down.
Breakouts:
Bullish Breakout: When the price moves above resistance, it often indicates strong buying interest and the potential for a continued uptrend. Traders may view this as a signal to buy or hold.
Bearish Breakout: When the price falls below support, it can signal strong selling interest and the potential for a continued downtrend. Traders might see this as a cue to sell or avoid buying.
MA Ribbon (EMA 20, EMA 50, EMA 100, EMA 200) :
Above EMA: If the stock price is above the EMA, it suggests a potential uptrend or bullish momentum.
Below EMA: If the stock price is below the EMA, it indicates a potential downtrend or bearish momentum.
Trendline: A trendline is a straight line drawn on a chart to represent the general direction of a data point set.
Uptrend Line: Drawn by connecting the lows in an upward trend. Indicates that the price is moving higher over time. Acts as a support level, where prices tend to bounce upward.
Downtrend Line: Drawn by connecting the highs in a downward trend. Indicates that the price is moving lower over time. It acts as a resistance level, where prices tend to drop.
Disclaimer:
I am not SEBI registered. The information provided here is for learning purposes only and should not be interpreted as financial advice. Consider the broader market context and consult with a qualified financial advisor before making investment decisions.  Long
Long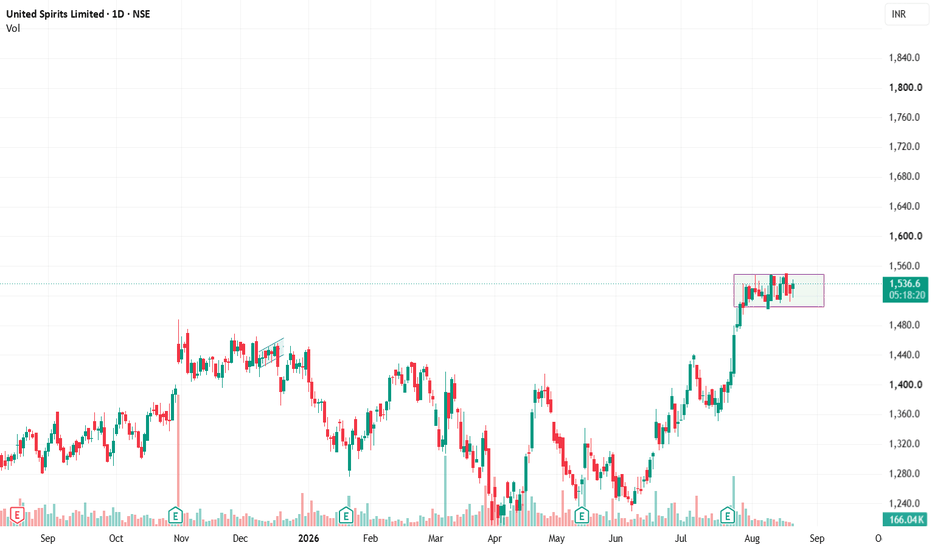
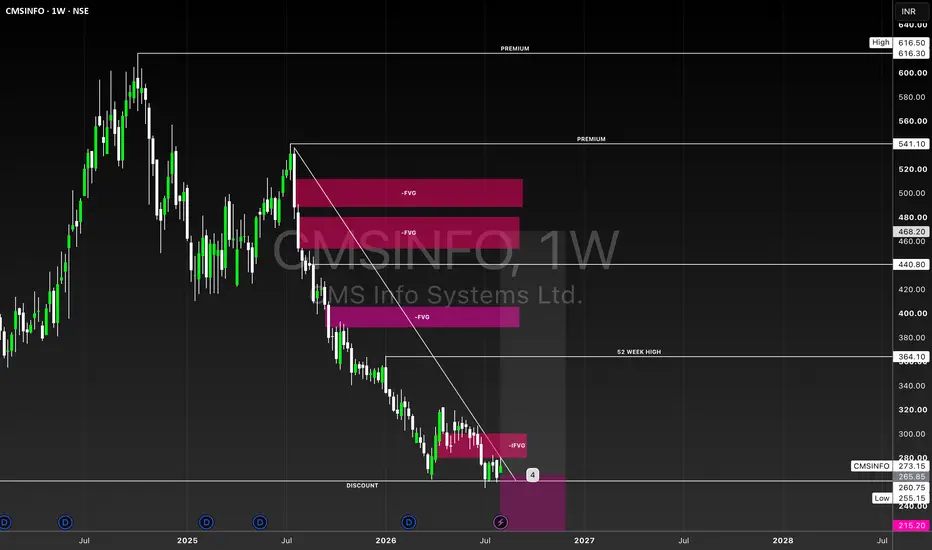
CAMS SWING SETUP# **CMSINFO | Weekly Trade Analysis**
## 📌 Executive Summary
**Ticker:** CMSINFO
**Timeframe:** 1W
**CMP:** ~₹273
**Bias:** 🟢 **Bullish reversal setup — confirmation required**
**Preferred Entry:** **₹255–₹266**
**Stop Loss:** **₹215**
**Setup Quality:** **7.8/10**
CMSINFO is trading deep inside the **weekly discount region** after a prolonged bearish decline. The current location is attractive for a **high-timeframe reversal**, but the weekly structure has **not yet completely shifted bullish**.
The key is therefore **location + confirmation**, rather than buying simply because price is cheap.
---
## 1. 🧭 Market Structure
The weekly chart shows a clear sequence of:
**Major high → lower highs → lower lows → sustained distribution/decline**
Price previously traded above ₹600 and subsequently declined toward the ₹255–₹265 region.
The important observation now is that price has reached the **lower end of the established weekly range**, while several significant inefficiencies remain above.
### Current structural condition
* 🔴 Long-term structure: **Bearish**
* 🟡 Current location: **Deep discount**
* 🟢 Reversal potential: **High**
* 🟡 Confirmation: **Still required**
Therefore, this is better classified as a **reversal-at-discount setup**, rather than an already-confirmed bullish trend.
---
# 2. 🎯 Primary Entry Zone
### **₹255–₹266**
This is the most important area on the chart.
Price is approaching the previous external low around the **₹255–₹266 region**, creating an attractive location for a potential liquidity-based reversal.
### Preferred execution
**Scenario A — Ideal**
₹255–₹266
↓
Liquidity sweep / rejection
↓
Bullish displacement
↓
Entry
↓
₹300+
This gives considerably better asymmetry than entering immediately around ₹273.
### Scenario B — Price does not retrace
If CMSINFO moves directly above ₹300, **do not chase the move**.
Wait for either:
* retest of ₹280–₹300, or
* deeper retracement toward the original entry zone.
---
# 3. 🛑 Stop Loss
### **₹215**
The ₹215 area is the structural invalidation region for this setup.
A decisive weekly breakdown below this level would indicate that the current discount reaction is insufficient and that price may continue searching for lower liquidity.
**Risk per share from ₹260 entry:**
≈ ₹45
Therefore, position sizing should be calculated from the ₹45 risk rather than from the target distance.
---
# 4. 📈 Liquidity Roadmap
The chart provides a very clear upside roadmap.
### **TP1 — ₹300**
First major objective.
This corresponds to the nearest visible **IFVG / imbalance area**.
At this level:
* Take partial profits.
* Move SL toward breakeven if price confirms acceptance.
* Observe whether price can reclaim the next structure.
---
### **TP2 — ₹364**
This is particularly important because the chart identifies approximately **₹364 as the 52-week high**.
A move from ₹260 → ₹364 represents approximately:
**+40%**
This is the first major external liquidity objective.
---
### **TP3 — ₹401–₹410**
This area contains the next significant weekly imbalance.
Expected behavior:
**₹364 liquidity → continuation → ₹401–₹410 FVG**
Partial profit-taking is appropriate here.
---
### **TP4 — ₹440**
₹440 is another important structural level and represents the next major upside objective.
From ₹260:
**~69% potential upside**
---
### **TP5 — ₹468–₹480**
This is a significant **weekly bearish FVG / supply region**.
Expect potentially stronger selling pressure here because price previously displaced lower from this area.
This should **not** be treated as a guaranteed breakout zone.
---
### **TP6 — ₹500–₹510**
Major overhead imbalance/supply.
This is where the bullish reversal thesis begins approaching the origin of the previous major decline.
---
### **TP7 — ₹541**
Major HTF premium level.
This is a much more ambitious target and should only remain active if CMSINFO demonstrates sustained bullish structure.
---
### **Extended Target — ₹616**
The previous major external high.
This represents the full-range recovery scenario.
It is **not the base-case target**; it is the extended scenario if the entire bearish structure is successfully reversed.
---
# 5. 📊 Risk/Reward Structure
Using approximately **₹260 entry / ₹215 SL**:
| Target | Price | Approx. R:R |
| -------- | ----: | ----------: |
| SL | ₹215 | **-1R** |
| TP1 | ₹300 | **0.89R** |
| TP2 | ₹364 | **2.31R** |
| TP3 | ₹405 | **3.22R** |
| TP4 | ₹440 | **4.00R** |
| TP5 | ₹475 | **4.78R** |
| TP6 | ₹505 | **5.44R** |
| TP7 | ₹541 | **6.24R** |
| Extended | ₹616 | **7.91R** |
The setup becomes significantly more attractive **above TP2**, provided the market confirms the reversal.
---
# 6. 🔍 Major Confluences
### Bullish Factors
✅ **Weekly discount**
Price is trading near the lower extreme of the established range.
✅ **External low proximity**
Price is approaching the major external downside liquidity area.
✅ **Multiple upside imbalances**
There are several visible FVG/IFVG zones above current price.
✅ **Large liquidity vacuum**
If price begins reclaiming ₹300 and ₹364, there is substantial room toward the higher imbalance zones.
✅ **Asymmetric upside**
A controlled entry near ₹260 offers substantially greater upside than downside if the reversal succeeds.
---
### Bearish Factors
⚠️ **Weekly trend remains bearish**
The chart has not yet produced a complete higher-high/higher-low reversal structure.
⚠️ **Descending trendline**
The long-term descending structure remains relevant.
⚠️ **Large overhead supply**
₹400–₹510 contains multiple bearish inefficiencies.
⚠️ **Potential dead-cat bounce**
A reaction from discount does not automatically mean a complete trend reversal.
---
# 7. 🧠 Execution Model
### **Aggressive Entry**
**₹255–₹266**
Only if price shows a clear rejection/liquidity response.
### **Conservative Entry**
Wait for:
**₹255–₹266 sweep → bullish displacement → reclaim → retest**
Then enter.
This sacrifices some entry price but significantly improves structural confirmation.
### **Avoid**
❌ Chasing ₹300+ after a large displacement
❌ Full-size position at the first touch
❌ Ignoring the ₹215 invalidation
❌ Assuming every FVG will be filled immediately
---
# 8. 🔄 Alternative Bearish Scenario
If CMSINFO fails to hold the ₹255–₹266 region:
**₹255 breakdown → weak recovery → continued downside**
In that situation, the long setup is invalidated.
The key level is therefore not simply the current price—it is whether the market can **defend the discount/external-low region**.
---
# 9. 🏆 Overall Assessment
### **Setup Rating: 7.8/10**
**Location:** ⭐⭐⭐⭐⭐
**Liquidity:** ⭐⭐⭐⭐⭐
**Upside asymmetry:** ⭐⭐⭐⭐⭐
**Structure confirmation:** ⭐⭐⭐
**Immediate trend:** ⭐⭐
### Final thesis
> **CMSINFO is at an attractive weekly discount location for a potential long-term reversal, but the bearish HTF structure means confirmation is mandatory. The preferred strategy is to accumulate only around ₹255–₹266 after a liquidity reaction, protect below ₹215, and systematically target ₹300 → ₹364 → ₹405 → ₹440 → ₹475 → ₹505 → ₹541, with ₹616 as the extended external-liquidity objective.**
**Trade type:** HTF reversal / positional
**Preferred action:** **WAIT → CONFIRM → EXECUTE**
**Invalidation:** **₹215**
**Primary objective:** **₹364**
**Maximum mapped objective:** **₹616**
EDUCATIONAL
Educational Disclaimer:
This analysis is for educational purposes only and reflects the ICT methodology. It is not financial advice. Always conduct your own research and apply disciplined risk management before making any investment or trading decisions.  Long
Long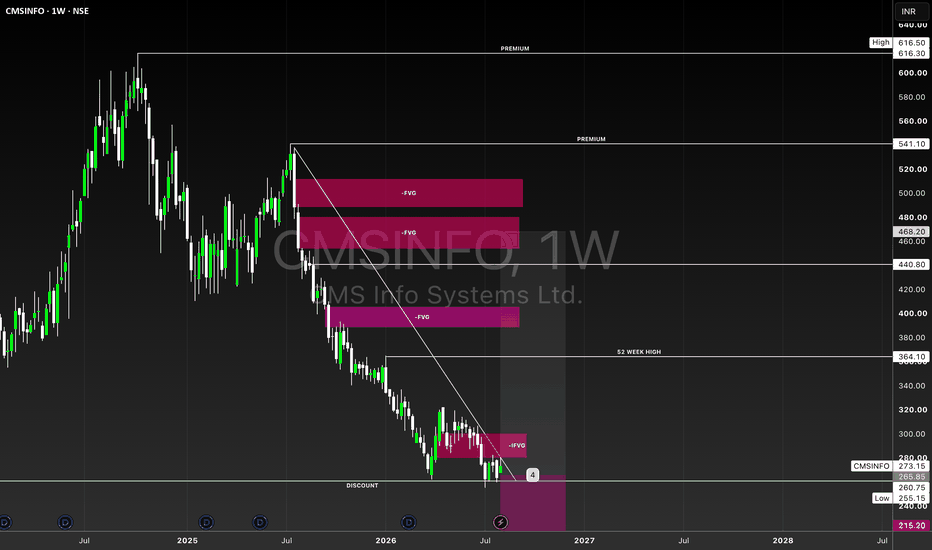
 Long
Long
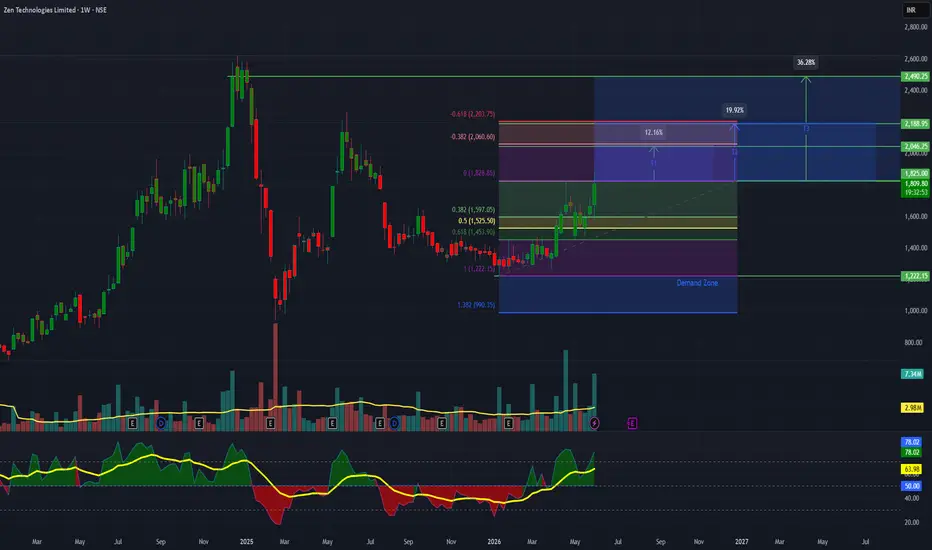
ZEN Technologies Reclaims Key Weekly Levels | Potential 36%ZEN Technologies is showing strong signs of a bullish continuation on the weekly timeframe after defending the ₹1,220 demand zone and reclaiming key Fibonacci retracement levels. Price has established a sequence of higher lows while momentum and volume continue to improve.
The immediate hurdle lies near ₹1,825. A successful breakout above this level could open the path toward ₹2,046, ₹2,189 and eventually ₹2,490. The structure remains constructive as long as the stock holds above the ₹1,525 support region on a weekly closing basis.
This setup offers a favorable risk-reward profile for positional traders looking to participate in a potential medium-term continuation move.
Aggressive Entry
Current levels while price sustains above ₹1,700
Conservative Entry
Weekly close above ₹1,825 with volume confirmation
Demand Zone
₹1,220 – ₹1,450
Current Price
₹1,801
Immediate Resistance
₹1,825
Major Resistance Levels
₹2,046
₹2,189
₹2,490
Targets
🎯 Target 1 (T1)
₹2,046
Potential Gain: +12%
🎯 Target 2 (T2)
₹2,189
Potential Gain: +20%
🎯 Target 3 (T3)
₹2,490
Potential Gain: +36%
Disclaimer
This analysis is for educational and informational purposes only and should not be construed as investment advice. Markets involve risk, and all trading or investing decisions should be based on your own research and risk tolerance. Always use appropriate position sizing and stop-loss management.  Long
Long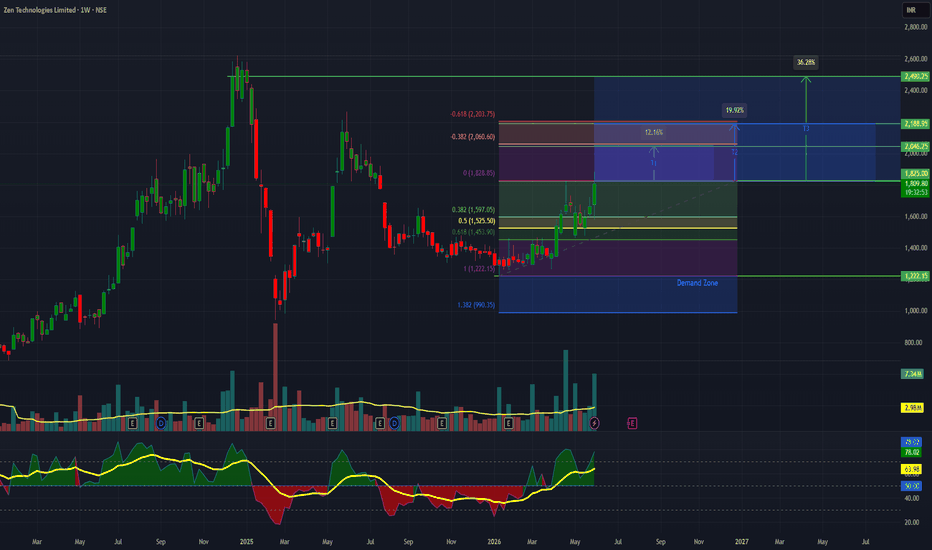
 Long
Long
PNB Housing Finance Ltd — Daily Breakout Above Fibonacci Res....PNB Housing Finance Ltd — Daily Breakout Above Fibonacci Resistance
PNB Housing Finance has delivered a strong bullish breakout on the daily timeframe after reclaiming the crucial ₹1,125 resistance zone. The breakout is supported by a wide-range bullish candle, indicating renewed buying interest and improving momentum.
After consolidating around the ₹1,030–₹1,100 region, the stock has now moved above its previous swing resistance, suggesting that buyers are attempting to initiate the next leg of the uptrend.
As long as price sustains above the breakout zone, the bullish structure remains intact.
Technical Structure
The chart highlights a constructive bullish setup characterized by:
✅ Strong breakout above the ₹1,125 resistance
✅ Price trading above key Fibonacci retracement levels
✅ Higher low formation after a healthy correction
✅ Bullish momentum returning with a wide-range candle
✅ Trend continuation setup within the broader uptrend
The breakout candle has shifted short-term sentiment in favor of the bulls, with the next resistance zone located near ₹1,175–₹1,192.
Key Levels
Current Price: ₹1,134
Immediate Support: ₹1,125
Secondary Support: ₹1,055
Breakout Level: ₹1,125
Target 1: ₹1,174
Target 2: ₹1,192
Major Resistance: ₹1,236
Trade Plan
Aggressive Entry
Enter while price holds above ₹1,125 with confirmation on lower timeframes.
Conservative Entry
Wait for a successful retest of ₹1,125 as support before initiating fresh positions.
Targets
🎯 Target 1
₹1,174
Potential Gain: +3.7%
🎯 Target 2
₹1,192
Potential Gain: +5.3%
Extended Target
₹1,236 (if momentum and volume remain strong)
Stop Loss
Swing Traders
Daily close below ₹1,100
Positional Traders
Daily close below ₹1,055
Technical Observations
Strong bullish breakout candle from a consolidation base.
Price has reclaimed an important Fibonacci resistance level.
Higher lows continue to define the uptrend.
Breakout is occurring above a rising trendline, supporting the bullish bias.
The ₹1,125 level now becomes the key support to monitor.
Why This Setup Matters
PNB Housing Finance appears to be transitioning from a consolidation phase into a continuation move. Breakouts from well-defined resistance levels often attract fresh momentum buying, especially when accompanied by strong price expansion.
The immediate focus is on the ₹1,175–₹1,192 resistance zone. A sustained move above this area could open the path toward ₹1,236 in the coming weeks. However, traders should watch for confirmation through follow-through buying and healthy volume before expecting a larger trend extension.
TradingView Publish Write-up
PNB Housing Finance has broken above the key ₹1,125 resistance after several sessions of consolidation, signaling renewed bullish momentum. The stock is trading above important Fibonacci levels while maintaining a sequence of higher lows, indicating that buyers remain in control.
If the breakout sustains, the next upside targets are ₹1,174 and ₹1,192, with a possible extension toward ₹1,236. The ₹1,125 zone now becomes an important support level, and holding above it would strengthen the bullish continuation scenario. This setup offers an attractive short-term swing opportunity with a favorable risk-to-reward profile, provided price action confirms the breakout.
Disclaimer
This analysis is shared for educational and informational purposes only and should not be considered investment or trading advice. Financial markets are subject to risk, and no chart pattern guarantees future performance. Always conduct your own research, use appropriate risk management, and consult a qualified financial advisor before making investment decisions.  Long
Long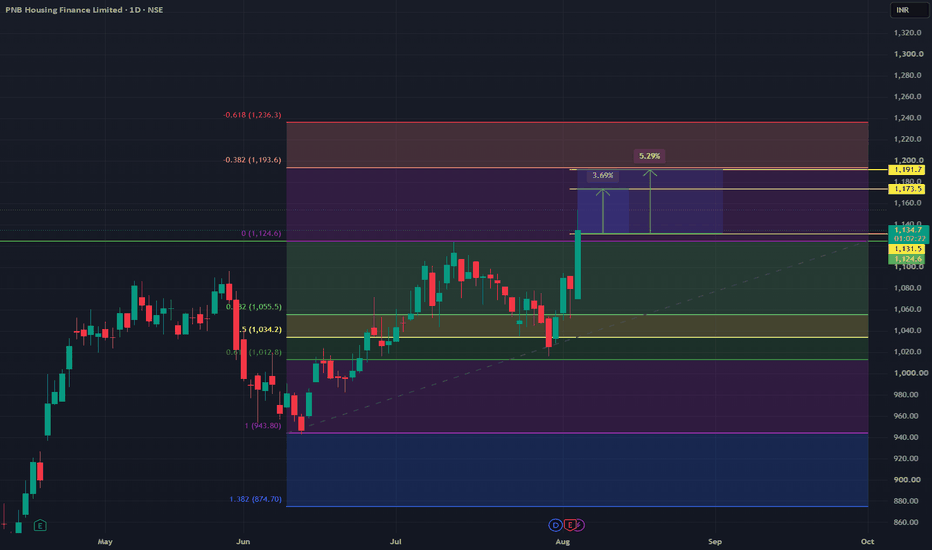
ORIENTAL HOTELSOriental Hotels Ltd. (CMP ₹139.00, NSE: ORIENTHOT)
The SmartWay Research Desk | 20 August 2026
A Chennai‑based hospitality company, incorporated in 1970. Oriental Hotels operates a portfolio of luxury and premium hotels under the Taj brand, managed by Indian Hotels Company Ltd. (IHCL). The company’s properties are spread across South India, including Chennai, Bengaluru, Kochi, and Thiruvananthapuram.
FY22–FY26 Snapshot
Revenue Growth: FY26 revenue ₹842 Cr vs ₹712 Cr in FY25 (+18.2% YoY). → Good
Net Profit: FY26 PAT ₹112 Cr vs ₹92 Cr in FY25 (+21.7% YoY). → Good
Operating Margin: FY26 EBITDA ₹212 Cr, margin 25.2% vs 24.5% last year (+70 bps). → Good
Equity Capital: Stable, face value ₹1. → Good
Dividend Policy: Dividend ₹2.00/share declared for FY26. → Good
Asset Building: Investments in renovation of Taj Coromandel and expansion of premium properties. → Good
Sales: Strong demand from business travel, leisure tourism, and MICE events. → Good
Expense: Operating costs remain high due to hospitality inflation. → Neutral/Good
EPS: FY26 EPS ₹3.25 vs ₹2.70 last year (+20.4%). → Good
Institutional Interest & Ownership Trends (Mar 2026)
Promoter Holding (IHCL/Tata Group): ~63.8% (no pledges)
FII Holding: ~12.2%
DII Holding: ~14.1%
Retail & Others: ~9.9%
Strategic Moves & Innovations
Expansion in luxury and premium hotels under Taj brand.
Focus on renovation and modernization of flagship properties.
Partnerships with IHCL for hospitality synergies.
Diversification into banqueting, conferences, and wellness tourism.
Cash Flow & Balance Sheet Strength
Market cap ~₹2,600 Cr.
Debt‑to‑equity ratio ~0.42 (moderate leverage).
Book value per share ₹42.00; P/B ~3.3.
EPS (TTM) ₹3.25; P/E ~42.8.
Risk Factors
High P/E ratio ~42.8, valuations expensive.
Dependence on tourism and corporate travel cycles.
Exposure to hospitality inflation and regulatory risks.
Competition from Indian Hotels, EIH Ltd., and Lemon Tree Hotels.
Investor Takeaway
Oriental Hotels has delivered steady FY26 performance, supported by tourism recovery, corporate travel demand, and Taj brand strength. With promoter backing, dividend payouts, and leadership in South India’s premium hospitality segment, Oriental Hotels remains a small‑cap hospitality play. At CMP ₹139.00, valuations are expensive (P/E ~42.8, P/B ~3.3), reflecting growth expectations but also sectoral risks.  Long
Long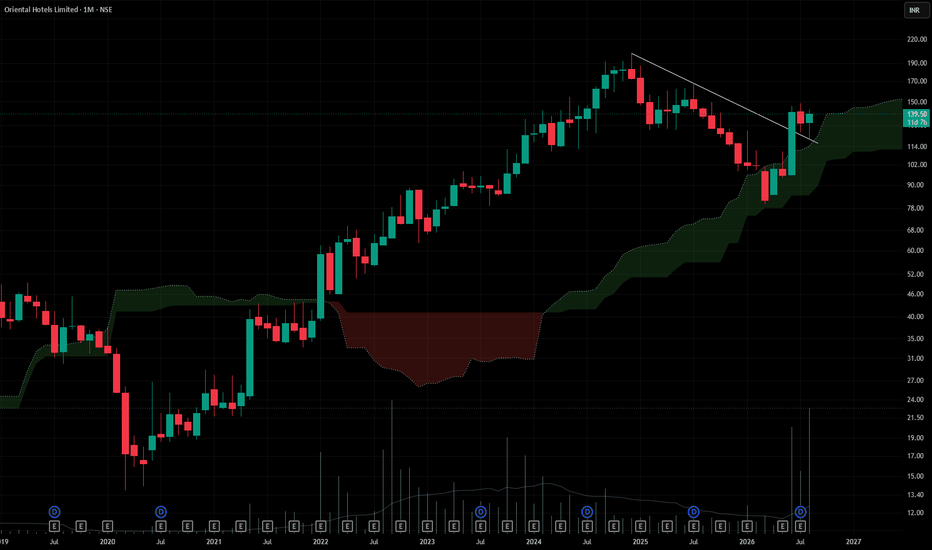
 Long
Long
 Long
Long
 Short
Short
 Long
Long
Can HUL Achieve 200 Months Level ?# HUL – Business Model
Hindustan Unilever Limited (HUL) is one of India’s largest FMCG companies, operating through a portfolio of well-known consumer brands across home care, beauty & wellbeing, personal care and foods. In FY 2025–26, HUL reported turnover of approximately **₹63,763 crore**, with **4% underlying volume growth**. ( )
## 1. Core Business Model
HUL follows a **high-volume, brand-led FMCG business model**.
The company:
**Manufactures Products → Builds Strong Brands → Distributes Through Multiple Channels → Reaches Millions of Consumers → Generates Repeat Purchases → Reinvests in Brands & Innovation**
Its strength comes from combining **brand power, distribution reach, consumer understanding, product innovation and scale**.
---
## 2. Major Business Segments
### A. Home Care
Products include:
* Laundry detergents
* Fabric conditioners
* Dishwashing products
* Home cleaning products
* Hygiene products
Major brands include **Surf Excel, Comfort and Vim**.
Home Care remains HUL's largest revenue segment, generating around **₹23,672 crore** in FY 2025–26. ( )
### B. Beauty & Wellbeing
This segment covers:
* Hair care
* Skin care
* Beauty products
* Wellbeing products
Major brands include **Dove, TRESemmé and other beauty & wellbeing brands**.
FY 2025–26 revenue was approximately **₹14,990 crore**. ( )
### C. Personal Care
Products include:
* Soaps
* Body wash
* Deodorants
* Oral care
* Skin cleansing products
Important brands include **Lux, Closeup and other personal-care brands**.
FY 2025–26 revenue was approximately **₹9,564 crore**. ( )
### D. Foods
HUL operates in categories such as:
* Ketchup and condiments
* Coffee
* Nutrition products
* Beverages
* Cooking-related products
Important brands include **Kissan, Horlicks and Boost**.
FY 2025–26 revenue was approximately **₹14,061 crore**. ( )
---
## 3. How HUL Makes Money
HUL primarily earns revenue by selling FMCG products through a very large distribution network.
Its revenue engine can be understood as:
**Strong Brands + Large Distribution + High Consumption Frequency + Pricing + Premiumisation = Revenue Growth**
Many HUL products are consumed regularly, which creates **repeat purchase behaviour**.
For example:
**Surf Excel → Household Laundry → Frequent Consumption → Repeat Purchase**
This provides HUL with relatively predictable recurring demand.
---
## 4. Brand-Led Strategy
Brand strength is one of HUL's biggest competitive advantages.
Instead of competing only on price, HUL invests heavily in:
* Advertising
* Consumer awareness
* Product innovation
* Premium products
* Digital marketing
* Consumer research
* Brand positioning
The objective is to create **consumer preference and brand loyalty**.
HUL's current strategy specifically focuses on creating **modern, desirable brands**, strengthening consumer segmentation and concentrating resources on fewer, larger growth opportunities. ( )
---
## 5. Distribution Model
Distribution is a major moat for HUL.
Products reach consumers through:
* General trade
* Modern retail
* E-commerce
* Quick commerce
* Wholesale
* Institutional channels
This **omnichannel distribution model** allows HUL to reach consumers across urban and rural markets. ( )
---
## 6. Premiumisation
One important growth strategy is **premiumisation**.
HUL attempts to move consumers from basic products toward higher-value products.
For example:
**Basic Soap → Premium Soap → Body Wash**
or
**Basic Shampoo → Premium Shampoo → Specialized Hair Care**
Higher-priced products can increase:
* Revenue per consumer
* Gross margin
* Profitability
* Brand value
HUL has identified premiumisation and high-growth demand spaces as important parts of its growth strategy. ( )
---
## 7. Innovation
Innovation is critical because FMCG markets are highly competitive.
HUL continuously develops:
* New products
* New formulations
* New packaging
* Premium variants
* New categories
* Convenience-oriented products
The company uses consumer insights, scientific research and technology to identify changing consumer preferences. ( )
---
## 8. Pricing Power
HUL's strong brands provide a degree of **pricing power**.
When raw-material costs increase, the company can attempt to protect margins through:
**Price Increase + Product Mix + Cost Efficiency + Premiumisation**
However, pricing power is not unlimited because FMCG consumers remain sensitive to price and competitors can offer alternatives.
---
## 9. Competitive Advantages / Moats
HUL's major competitive advantages include:
1. **Powerful brands**
2. **Large distribution network**
3. **High consumer penetration**
4. **Strong advertising capabilities**
5. **Economies of scale**
6. **Product innovation**
7. **Wide product portfolio**
8. **Strong relationships with retailers**
9. **Ability to premiumise products**
10. **Deep understanding of Indian consumers**
These advantages make it difficult for a new competitor to replicate HUL's entire business infrastructure.
---
## 10. Cost Structure
Major costs include:
* Raw materials
* Manufacturing
* Packaging
* Advertising and marketing
* Employee costs
* Distribution
* Logistics
* Research & development
* Trade promotions
Because HUL operates at enormous scale, it can spread many fixed costs over a large sales base.
---
## 11. Key Growth Drivers
HUL's future growth can come from:
### Volume Growth
Selling more units to existing and new consumers.
### Premiumisation
Moving consumers toward higher-value products.
### Rural Penetration
Increasing consumption in India's rural and semi-urban markets.
### E-commerce & Quick Commerce
Capturing consumers through rapidly expanding digital channels.
### New Categories
Entering high-growth consumer categories.
### Innovation
Launching products that address changing consumer needs.
### Acquisitions
Adding attractive brands and businesses to the portfolio.
HUL has also been using portfolio transformation to shift resources toward **Future Core and Market Makers** categories. ( )
---
## 12. HUL Business Model – Simple Flow
**Consumers**
↓
**Consumer Research & Insights**
↓
**Product Development & Innovation**
↓
**Manufacturing**
↓
**Strong Brands**
↓
**Distribution Network**
↓
**General Trade + Modern Trade + E-commerce + Quick Commerce**
↓
**Consumers**
↓
**Repeat Purchases**
↓
**Revenue & Cash Flow**
↓
**Reinvestment in Brands, Innovation & Distribution**
---
## 13. Investment Perspective
From a business-model perspective, HUL is essentially a **brand + distribution + scale + recurring consumption** business.
Its biggest strengths are:
**Strong Brands**
**Large Distribution**
**Recurring Demand**
**Scale Economics**
**Premiumisation**
**Pricing Ability**
The key risks are:
* Weak consumer demand
* Commodity inflation
* Intense competition
* Rural slowdown
* Input-cost volatility
* Private-label/low-cost competition
* Regulatory changes
### Bottom Line
**HUL's business model is built on selling everyday consumer products at enormous scale, supported by powerful brands and one of India's strongest distribution networks.**
Its long-term value creation depends primarily on **volume growth, premiumization, innovation, efficient cost management and continued strengthening of its brands and distribution ecosystem.