Tasty Bite⚙️ STOCK TO WATCH ⚙️
Tasty Bite Eatables Ltd.
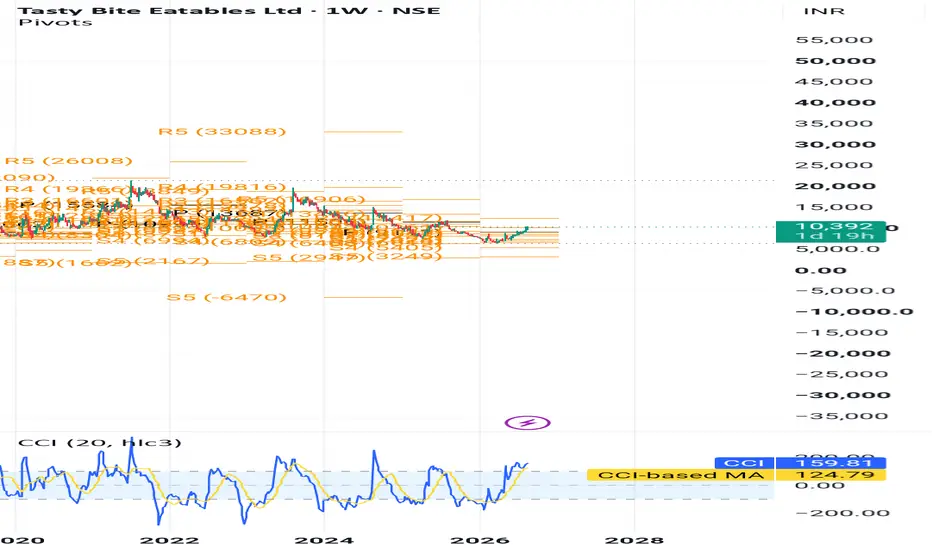
₹10,261–₹10,300 → ₹19,816 → ₹33,088 👀
A premium packaged-food and ready-to-eat foods company appearing on my Weekly R4 Breakout Scanner.
📌 Buy Zone: ₹10,261–₹10,300
📌 Breakout Zone: ₹10,261
🛑 Stop Loss: ₹9,111
🎯 Target 1: ₹19,816
🎯 Target 2: ₹33,088
Why Tasty Bite?
🍱 Ready-to-eat food theme: Tasty Bite operates across packaged and ready-to-eat food products, with its business spanning consumer, food-service and affiliate channels.
📈 Strong FY26 profitability: FY26 EBITDA rose 20% to ₹84.34 crore, while PAT increased 38% to ₹35.30 crore. EBITDA margin improved to 14.8% from 12.3%.
🔥 Fresh Q1 FY27 growth: June 2026 sales increased about 29% YoY to ₹155.53 crore, while standalone net profit rose about 8% to ₹8.84 crore.
💰 Debt-free balance sheet: The company reported that it had repaid its borrowings and was debt-free at FY26 year-end.
🌍 International + food-service exposure: The business has exposure to affiliate markets and food-service, with FY26 food-service revenue growing 18% and the company highlighting ten consecutive quarters of positive growth in that business.
📊 Weekly Camarilla R4 Breakout Setup.
Why It Caught My Attention
✅ Premium packaged-food theme
✅ Strong FY26 PAT growth
✅ Improving EBITDA margins
✅ Debt-free balance sheet
✅ Food-service growth
✅ Weekly R4 Momentum Breakout
⚠️ High Risk – High Reward Setup. Always follow strict stop-loss and disciplined position sizing.
📢 Disclaimer: This content is for educational purposes only and not investment advice. Please do your own due diligence before making any investment decisions.
Risk Defined. Reward Visible.
© 20K Microcap Investing | R4 Momentum Desk
#TastyBite #TastyBiteEatables #PackagedFoods #FMCG #FoodStocks #ReadyToEat #ConsumerStocks #StockMarketIndia #IndianStocks #StocksToWatch #R4Breakout #MomentumInvesting #20KMicrocap  Long
Long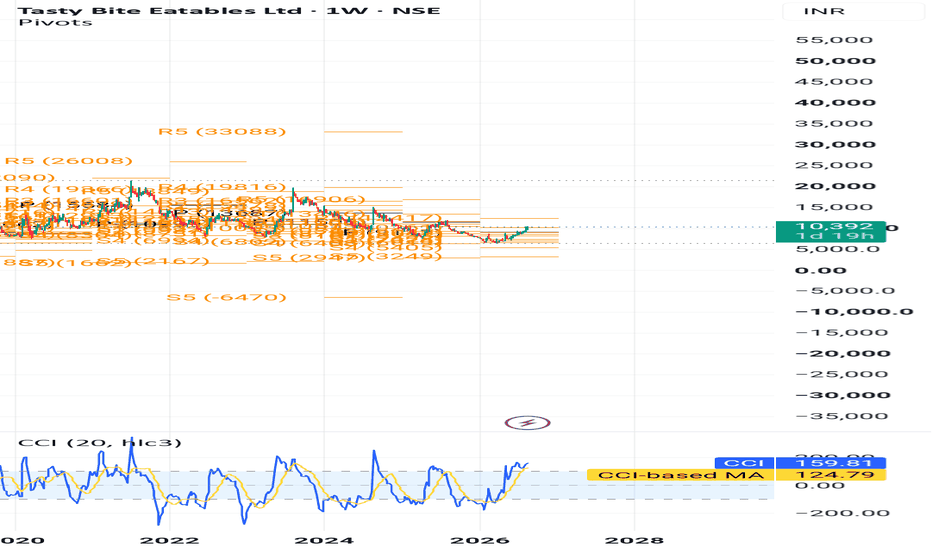
 Long
Long
 Long
Long
 Long
Long
Bullish View On Aditya Birla Fashon Retail Ltd## Aditya Birla Fashion & Retail Ltd. (ABFRL) – Business Model
**Aditya Birla Fashion & Retail Limited (ABFRL)** is one of India's major branded fashion companies, operating across premium, mid-premium and value fashion categories. Its business model is built around **strong brands, large retail distribution, omnichannel sales, private labels, and a diversified fashion portfolio**.
### 1. Core Business Model
ABFRL essentially follows:
**Brand Creation/Acquisition → Product Design → Sourcing & Manufacturing → Distribution → Retail/Online Sales → Customer**
The company monetizes its brands through a combination of:
* Exclusive Brand Outlets
* Department stores
* Multi-brand outlets
* Large-format stores
* E-commerce marketplaces
* Brand-owned online channels
* Franchise stores
---
## 2. Major Business Segments
| Segment | Key Focus |
| ------------------------------- | --------------------------------------------------- |
| **Premium & Lifestyle Fashion** | Premium branded apparel and lifestyle products |
| **Casual & Youth Fashion** | Casualwear and contemporary fashion |
| **Ethnic & Indian Wear** | Traditional and contemporary Indian clothing |
| **Luxury Fashion** | Premium and luxury international brands |
| **Value Fashion** | Affordable fashion for mass-market consumers |
| **Innerwear & Athleisure** | Innerwear, activewear and leisurewear |
| **Accessories** | Footwear, bags, belts and other fashion accessories |
---
## 3. Major Brands / Brand Portfolio
ABFRL has historically built a diversified portfolio covering different consumer segments.
Important brands associated with the business include:
* **Louis Philippe**
* **Van Heusen**
* **Allen Solly**
* **Peter England**
* **Pantaloons**
* **American Eagle**
* **Simon Carter**
* **Ted Baker**
* **Ralph Lauren**
* **Reebok**
* **Jaypore**
* **Tasva**
* **Shantnu & Nikhil**
The strategic objective is to operate brands across different **price points, consumer demographics and fashion categories**.
---
## 4. Brand-Led Business Model
The biggest strength of ABFRL is its **portfolio of recognized brands**.
Instead of competing primarily as a commodity clothing manufacturer, ABFRL attempts to create value through:
**Brand → Design → Consumer Aspirations → Pricing Power → Retail Presence**
A strong brand can potentially command a higher selling price than an unbranded product with similar raw-material costs.
This creates an opportunity for better gross margins and stronger customer loyalty.
---
## 5. Retail Distribution Model
ABFRL uses a multi-channel distribution network.
### Offline
* Exclusive brand outlets
* Franchise stores
* Department stores
* Large-format stores
* Multi-brand retailers
### Online
* Brand websites
* E-commerce marketplaces
* Digital-first channels
* Omnichannel retail
The combination of physical stores and online channels allows ABFRL to reach consumers across different shopping preferences.
---
## 6. Asset-Light / Outsourcing Approach
Fashion companies generally do not need to manufacture every product themselves.
ABFRL can use a combination of:
* Third-party manufacturers
* Contract manufacturing
* Domestic sourcing
* Imported products
* In-house product development
* Brand licensing arrangements
This allows the company to focus more heavily on **brand management, design, merchandising, marketing and distribution** rather than owning the entire manufacturing chain.
---
## 7. Private Label & Product Development
Another important part of the model is developing products under owned or controlled brands.
The company decides:
**What to sell → Design → Fabric → Price → Collection → Distribution → Promotion**
This provides greater control over:
* Product positioning
* Pricing
* Fashion trends
* Gross margins
* Customer experience
---
## 8. Premiumization Strategy
ABFRL has been increasing its focus on premium and lifestyle fashion.
Premiumization means encouraging consumers to move from:
**Basic Clothing → Branded Clothing → Premium Clothing → Luxury**
The company can potentially increase revenue per customer by selling:
* Premium apparel
* Designer collections
* Luxury brands
* Premium accessories
* Complete lifestyle products
This strategy can improve the quality of the revenue mix over time.
---
## 9. Ethnic & Indian Fashion Opportunity
Indian ethnic wear represents a large and fragmented market.
ABFRL has expanded into this opportunity through brands and formats focused on:
* Men's ethnic wear
* Women's ethnic wear
* Wedding wear
* Occasion wear
* Contemporary Indian fashion
The opportunity is attractive because organised branded penetration remains relatively low compared with several Western fashion categories.
---
## 10. Omnichannel Business Model
ABFRL's modern retail model increasingly connects offline and online channels.
**Customer sees product online → Visits store → Purchases offline**
or
**Customer visits store → Checks additional products online → Purchases online**
This allows the company to use its physical store network and digital platforms together.
---
## 11. Revenue Generation
ABFRL primarily generates revenue from:
**Apparel Sales + Footwear + Accessories + Innerwear + Lifestyle Products + Licensing/Brand-related Income**
Revenue depends on:
* Number of stores
* Store productivity
* Same-store sales growth
* Online sales
* Average selling price
* Product mix
* Seasonal collections
* Brand strength
---
## 12. Fashion Inventory Cycle
Fashion is highly dependent on inventory management.
The business cycle is:
**Design → Production → Inventory → Store → Sale**
If products sell quickly:
**Higher Inventory Turnover → Lower Discounting → Better Margins**
If products do not sell:
**Higher Inventory → Discounts → Lower Gross Margin → Potential Inventory Loss**
Therefore, **inventory management is one of the most important success factors in the fashion business.**
---
## 13. Key Growth Drivers
### 1. Premiumization
Growth in premium and luxury fashion.
### 2. Store Expansion
Opening stores in new cities and underpenetrated markets.
### 3. Digital Growth
Increasing online and omnichannel sales.
### 4. Ethnic Wear
Expansion of branded Indian fashion.
### 5. Youth Fashion
Growing demand for casual and contemporary clothing.
### 6. Brand Portfolio
Launching, acquiring or scaling additional brands.
### 7. Tier-2 & Tier-3 Cities
Increasing penetration beyond India's major metropolitan markets.
---
## 14. Competitive Advantages
| Factor | Assessment |
| ------------------------------- | --------------- |
| Brand Portfolio | **Strong** |
| Retail Network | **Strong** |
| Distribution | **Strong** |
| Product Diversity | **Very Strong** |
| Premiumization Opportunity | **High** |
| Digital/Omnichannel Opportunity | **High** |
| Scale | **Strong** |
| Brand Recognition | **Strong** |
---
## 15. Key Risks
### Fashion Risk
Consumer preferences can change rapidly.
### Inventory Risk
Unsold seasonal inventory may require heavy discounting.
### Competition
Competition comes from both organised brands and fast-fashion players.
### Rental Costs
Large retail networks create significant fixed operating costs.
### Consumer Spending
Fashion demand is discretionary and can weaken during economic slowdowns.
### Brand Risk
A decline in brand relevance can negatively affect sales.
### Margin Pressure
Discounting and rising operating costs can reduce profitability.
---
## 16. Simple Business Model Diagram
**ABFRL**
↓
**Brands & Product Design**
↓
**Sourcing / Manufacturing**
↓
**Distribution Network**
↓
**Stores + E-Commerce + Marketplaces**
↓
**Consumers**
↓
**Revenue**
↓
**Gross Profit**
↓
**Operating Profit**
---
## 17. Investment Perspective
ABFRL's investment story is primarily based on the potential of **branded fashion consumption in India**.
The long-term opportunity comes from:
**Rising disposable income + Increasing brand awareness + Organised retail penetration + Premiumization + E-commerce + Ethnic fashion + Expansion into smaller cities**
The key question for investors is not simply whether ABFRL can increase sales, but whether it can convert its **large brand portfolio and retail presence into sustainable EBITDA and free-cash-flow growth**.
### One-Line Business Model
> **ABFRL is a diversified branded-fashion platform that creates value by building and scaling fashion brands through a combination of sourcing, brand management, retail distribution and omnichannel sales across multiple consumer segments.**
 Long
Long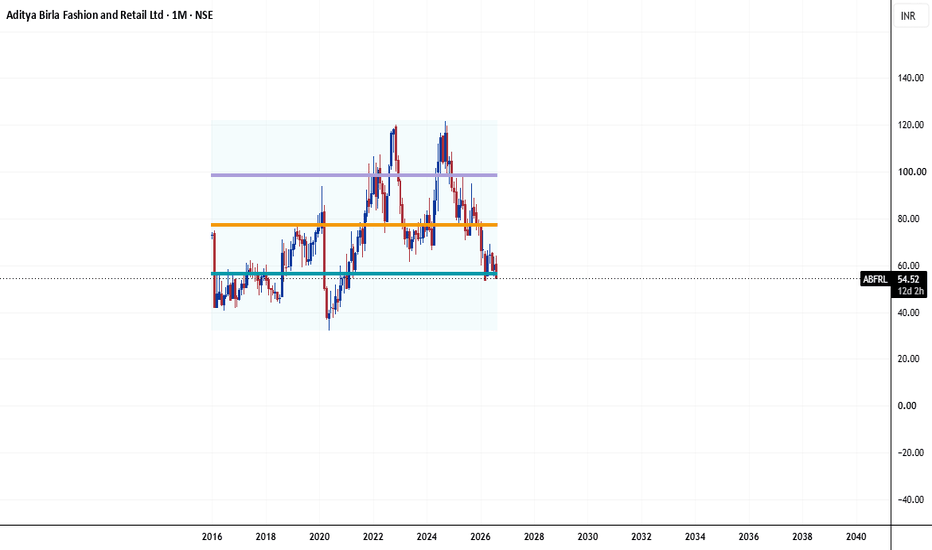
Dalmia Bharat: Bullish Consolidation Near BreakoutDalmia Bharat is showing a bullish recovery structure on the daily chart after finding support near the ₹1,620–₹1,650 zone.
The stock has formed a series of higher lows and is currently consolidating around ₹1,850–₹1,865, with price moving along a rising short-term trendline.
🔍 Technical Setup
Timeframe: Daily
Current Price: ~₹1,864
Structure: Bullish consolidation / ascending support
Immediate Resistance: ₹1,865–₹1,880
Support: ₹1,850
Major Support: ₹1,794
Trend Support: ~₹1,728
🎯 Target Zone
A sustained breakout above the current consolidation/resistance area could open the way toward:
Target 1: ₹2,040
Target 2: ₹2,080
Target 3: ₹2,120
📌 Trade View
Bullish above ₹1,850–₹1,865
A strong close above the recent swing resistance, preferably with volume confirmation, would strengthen the breakout setup.
⚠️ Invalidation: A decisive breakdown below the rising support structure would weaken the bullish thesis.
Disclaimer: This idea is for educational purposes only and is not investment advice. Please do your own research and manage risk appropriately.  Long
Long
 Long
Long
 Long
Long
 Long
Long
 Long
Long
 Long
Long
 Long
Long
 Long
Long
 Long
Long
 Long
Long
 Long
Long
 Long
Long
 Long
Long
SUNDARAM FASTNERSSundaram Fasteners Ltd. (CMP ₹1,228.00, NSE: SUNDRMFAST)
The SmartWay Research Desk | 19 August 2026
A Chennai‑based auto ancillary company, incorporated in 1965. Sundaram Fasteners, part of the TVS Group, is a leading manufacturer of automotive fasteners, powertrain components, wind energy parts, and industrial engineering products, with strong domestic and export presence.
FY22–FY26 Snapshot
Revenue Growth: FY26 revenue ₹5,842 Cr vs ₹5,212 Cr in FY25 (+12.1% YoY). → Good
Net Profit: FY26 PAT ₹812 Cr vs ₹712 Cr in FY25 (+14.0% YoY). → Good
Operating Margin: FY26 EBITDA ₹1,212 Cr, margin 20.7% vs 20.1% last year (+60 bps). → Good
Equity Capital: Stable, face value ₹1. → Good
Dividend Policy: Dividend ₹8.00/share declared for FY26. → Good
Asset Building: Investments in wind energy components and EV fasteners. → Good
Sales: Strong demand from OEMs in automotive and industrial sectors. → Good
Expense: Raw material cost pressures (steel, alloys) remain. → Neutral/Good
EPS: FY26 EPS ₹27.25 vs ₹23.90 last year (+14.0%). → Good
Institutional Interest & Ownership Trends (Mar 2026)
Promoter Holding (TVS Group): ~52.9% (no pledges)
FII Holding: ~18.2%
DII Holding: ~20.1%
Retail & Others: ~8.8%
Strategic Moves & Innovations
Expansion in EV fasteners and lightweight components.
Focus on wind energy and renewable sector supplies.
Partnerships with global OEMs for long‑term contracts.
Diversification into industrial engineering and aerospace fasteners.
Cash Flow & Balance Sheet Strength
Market cap ~₹26,800 Cr.
Debt‑to‑equity ratio ~0.32 (moderate leverage).
Book value per share ₹182.40; P/B ~6.7.
EPS (TTM) ₹27.25; P/E ~45.1.
Risk Factors
High P/E ratio ~45.1, valuations expensive.
Dependence on automotive demand cycles.
Exposure to commodity price volatility (steel, alloys).
Competition from Ramkrishna Forgings, Sundram Clayton, and Bharat Forge.
Investor Takeaway
Sundaram Fasteners has delivered steady FY26 performance, supported by OEM demand, EV component expansion, and wind energy diversification. With strong promoter backing, dividend payouts, and leadership in fasteners and engineering products, Sundaram remains a mid‑cap auto ancillary and industrial play. At CMP ₹1,228.00, valuations are expensive (P/E ~45.1, P/B ~6.7), reflecting growth expectations but also sectoral risks.  Long
Long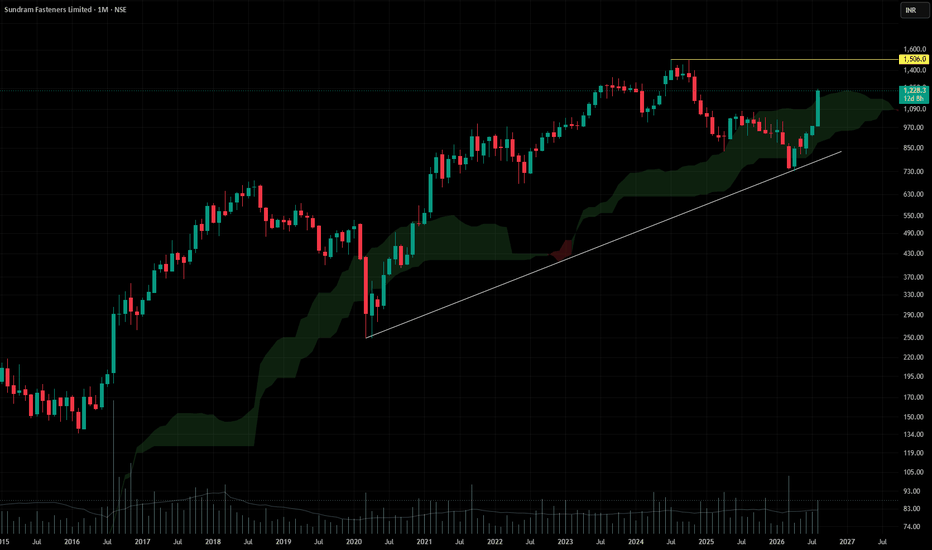
 Short
Short